Novel Method Development, Validation and Forced Degradation Studies for the Concurrent Determination of Lamivudine, Tenofovir Disoproxil Fumarate and Doravirine in Active Pharmaceutical Ingredient and Formulation using RP-UPLC
Vamsi Dadi* and Gummadi Sowjanya
Department of Pharmaceutical Analysis and Quality Assurance, GITAM Institute of Pharmacy, GITAM (Deemed to be University), Rushikonda, Visakhapatnam-530045, Andhra Pradesh, India.
Corresponding Author E-mail: vamsidadi88@gmail.com
DOI : http://dx.doi.org/10.13005/ojc/380618
Article Received on : 16 Nov 2022
Article Accepted on :
Article Published : 26 Dec 2022
Reviewed by: Dr. Shivam Joshi
Second Review by: Dr. Saket Yadav
Final Approval by: Dr. Roselin Jenifer
The main objective of proposed method is to develop, validate & to perform the forced degradation studies for the simultaneous quantification of lamivudine, doravirine and tenofovir in active pharmaceutical ingredient (API) and formulation using reverse phase ultra-performance liquid chromatography (RP-UPLC). The estimation was performed using HSS C18 (100mm×2.1mm,1.8µ)column with acetonitrile and 0.1 % ortho phosphoric acid (OPA) (35:65) as mobile phase ran in isocratic mode at rate of flow 0.3ml/min. The column temperature maintained at 30°C and detection wavelength used was 260nm. The developed method validated as per ICH guidelines. Method obeyed Beer’s law in the range of concentration of 37.5µg/ml – 225µg/ml, 37.5µg/ml – 225µg/ml and 12.5µg/ml – 75µg/ml for lamivudine, tenofovir and doravirine respectively. The method is stable when exposed to different stressed conditions with less degradation. For regular analysis of estimate of lamivudine, tenofovir, and doravirine in tablet formulation, this UPLC method can be employed
KEYWORDS:Doravirine; Development; Lamivudine; RP-UPLC; Stability-indicating.; Tenofovir; Validation
Download this article as:| Copy the following to cite this article: Dadi V, Sowjanya G. Novel Method Development, Validation and Forced Degradation Studies for the Concurrent Determination of Lamivudine, Tenofovir Disoproxil Fumarate and Doravirine in Active Pharmaceutical Ingredient and Formulation using RP-UPLC. Orient J Chem 2022;38(6). |
| Copy the following to cite this URL: Dadi V, Sowjanya G. Novel Method Development, Validation and Forced Degradation Studies for the Concurrent Determination of Lamivudine, Tenofovir Disoproxil Fumarate and Doravirine in Active Pharmaceutical Ingredient and Formulation using RP-UPLC. Orient J Chem 2022;38(6). Available from: https://bit.ly/3WLqW7E |
Introduction
Lamivudine1-3 (Fig. 1a), chemically known as 4-Amino-1-1[(2R, 5S)-2-(hydroxymethyl)-1,3-oxathiolan-5-yl]-1,2-dihydropyrimidin-2-one. It is a white or almost white powder, soluble in water, sparingly soluble in methanol and practically insoluble in acetone. It has a molecular formula of C8H11N3O3S, molecular weight 229.3g/mol and a pKa value of 14.29. Lamivudine acts as an antiretroviral drug as it inhibits nucleoside reverse transcriptase enzyme and hence used for the treatment of HIV/ AIDS and chronic hepatitis B. Tenofovir disoproxil fumarate4-6 (Fig. 1b), chemically known as 9-[(R)-2-[[bis[[(isopropoxycarbonyl) oxy] methoxy] phosphinyl] methoxy]propyl]adenine fumarate (1:1). It has a molecular weight of 635.52g/mol and a molecular formula of C19H30N5O10P.C4H4O4. It is a white to off-white crystalline powder, soluble in water and aqueous solvents. It belongs to a category of antiretroviral drug which acts by inhibiting the activity of HIV-I reverse transcriptase and HBV reverse transcriptase enzymes. Doravirine7,8 (Fig. 1c), chemically known as 3-chloro-5-[[1-[(4,5-dihydro-4-methyl-5-oxo-1H-1,2,4-triazol-3-yl)methyl]-1,2-dihydro-2-oxo-4-(trifluoromethyl)-3-pyridinyl]oxy] benzonitrile. It has a molecular formula of C17H11ClF3N5O3 with a molecular weight of 425.75g/mol practically insoluble in water. It belongs to a category of antiviral agent which acts by inhibiting the HIV-1 non-nucleoside reverse transcriptase inhibitor (NNRTI).
 |
Figure 1a: Structure of lamivudine. |
 |
Figure 1b: Structure of tenofovir disoproxil fumarate |
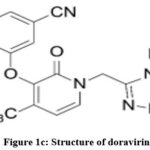 |
Figure 1c: Structure of doravirine |
According to the review of the literature, numerous analytical techniques have been established for estimating lamivudine, tenofovir, and doravirine separately. But only few methods such as RP-HPLC9-14, UPLC15-17 were developed for the concurrent determination of lamivudine, doravirine and tenofovir in multidrug combination. The major goal of the proposed research was to simultaneously design and validate a new UPLC method for stability indication that could be used to estimate lamivudine, tenofovir, and doravirine in pharmaceutical dose form.
Material and Methods
Chemicals and reagents
Working standards for lamivudine, tenofovir, and doravirine were obtained as free samples from spectrum labs in Hyderabad. Delstrigo pills were acquired from a nearby drugstore. The analytical reagent (AR) grade chemicals and reagents utilised for the method development and validation were all purchased from Merck in Mumbai, India. Each and every solvent utilised in the procedure was of the AR grade and was obtained from Merck in Mumbai, India.
Instruments and chromatographic conditions
The acquity UPLC system operated using empower 2 software was used as chromatographic instrument for the development of the novel method. HSS C18(100mm×2.1mm,1.8µ)column, acetonitrile and 0.1% ortho phosphoric acid (65:35) mobile phase, 0.3ml/min flow rate, 260nm detection wavelength and 30°C column temperature were used as optimized chromatographic conditions for the simultaneous estimation of drugs. Other instruments used during the process of the method were weighing balance (Sartorius), ultrasonic bath (Phoenix), and pH meter (Lab India). Glassware such as volumetric flasks, pipettes, burettes and beakers made of borosil was used.
Experimental work
Preparation of 0.1%OPA buffer
0.1% OPA buffer was created for 1000 ml by diluting 1ml of concentrated ortho phosphoric acid in 1 litre of distilled water.
Preparing mobile phase
The mobilephase was created by combining 350ml of acetonitrile with 650ml of 0.1% OPA buffer.
Diluent preparation
Equal parts of distilled water and methanol were combined and used as a diluent to create the solutions (Both sample and standard) for measurements.
Preparation of Standard and sample solutions
An accurate amounts of 75 mg of lamivudine, 75 mg of tenofovir & 25 mg doravirine are taken and transferred to a 50 ml volumetric flask which was cleaned and dried previously. The standard medicines were dissolved using sonication and the addition of 25ml of diluent. Later, using the diluent to obtain the stock solution, the volume was raised to the required level. The standard solution, which contains lamivudine (150 mg/ml), tenofovir (150mg/ml), & doravirine (50mg/ml) was created by diluting 1 ml stock solution in to 10 ml solution by using a diluent.
Twenty Delstrigo tablets were weighed on average. In a mortar and pestle, the tablets are fine grounded into powder. Accurately Weighed, dissolved in 50ml of diluent was a quantity equal to 75mg of lamivudine. The solution underwent filtering and sonication. The sample solution was created by diluting 1ml of the filtrate with diluent to a volume of 10ml.
Method validation18,19
System suitability
Into the UPLC system the prepared standard solution is injected five replicate times and the parameters for system suitability i.e tailing factor, plate count, % relative standard deviation (RSD), resolution were evaluated.
Linearity
A concentration range of 37.5 µg/ml to 225µg/ml, 37.5µg/ml to 225µg/ml and 12.5µg/ml to 75µg/ml are accurately prepared from stock solution for lamivudine, tenofovir and doravirine respectively, and injected in the UPLC system. The measured peak areas plotted vs the concentration of the drug solution and correlation coefficients were determined.
Accuracy
Three levels of drug solutions are prepared 50%, 100% and 150% using spiking method; and the peak areas were measured in triplicates for these levels.
Precision
Repeatability
For the estimation of repeatability of the method, the prepared sample solution is injected into the UPLC six times, the respective peak areas were noted. From the measurements, % RSD was evaluated.
Intermediate Precision
For determining the intermediate precision, the % RSD was calculated when the sample solutions were injected into the UPLC six times in two consecutive days.
Specificity
The interference of the placebo peaks with the reference peaks was evaluated to determine the method’s specificity.
Limit of detection & limit of quantification
Utilizing standard deviation & slope values from linearity results, the limits of detection (LOD) & quantification (LOQ) were accurately calculated.
Robustness
The method robustness is assessed by slightly modifying the final optimized chromatographic conditions such as ± 0.1ml/min flow rate, ± 5% organic phase in a mobile phase composition and ±5°C column temperature; later the %RSD was calculated.
Solution stability
In order to study the effect of diluent on the standard drugs, the prepared standard solution was made to stand for 24 hours under normal conditions. The solution was assessed after 24 hours to observe for any degradation of the drugs.
A study on forced degradation
The chosen standard solution of drug is implicated to a variety of stressed conditions during forced degradation studies20–22, including photolysis (at 105°C, 6 hours), thermo lytic conditions (keeping the solution under UV light continuously for 7 days), peroxide conditions (Hydrogen peroxide 20% continuously 30 minutes at a temperature of 60 °C), acid conditions (2Normal HCl continuously for 30 minutes at a temperature of 60 °C), and base conditions (2Normal Sodium hydroxide continuously for 30 minutes at a temperature of 60˚C)
Results and Discussion
Initially for the method development, various stationary phases and mobile phase compositions were tried. Based on trial and error method, HSS C18 (100×2.1 mm,1.8 µ) column and 0.1% OPA buffer & ACN (65:35) were selected as stationary phase and mobile phase respectively, as the peak shape and resolution were observed good. Flow rates were selected as 0.3ml/minute and isocratic mode of elution was used. The detection wavelength for the analysis was selected depends on the overlay UV spectrum of the three drugs as 260nm and the figure was shown in Fig. 2.
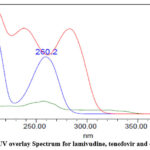 |
Figure 2: UV overlay Spectrum for lamivudine, tenofovir and doravirine |
To assess the system appropriateness characteristics, the produced std. solution is injected to the UPLC system. All the results are given in Table 1. Figs. 3a and 3b, respectively, show the chromatograms of the std, sample & blank solutions. Plate count, tailing factor, resolution, and percent RSD—all system suitability parameters—were discovered to be within acceptable bounds. Lamivudine’s retention time was determined to be 0.48 minutes, tenofovir’s to be 1.08 minutes, and doravirine’s to be 1.59 minutes.
Table 1: Validation parameter results
|
Parameters |
Lamivudine |
Tenofovir |
Doravirine |
|
Specificity |
Specific |
Specific |
Specific |
|
Linearity, Regression equation |
y = 7832.3x + 4142 |
y = 9031.6x + 12149 |
y = 7212x + 3474.3 |
|
Correlation coefficient |
0.9998 |
0.9992 |
0.9997 |
|
Accuracy Level I (50%) |
99.15% |
100.88% |
99.99% |
|
(recovery)Level II (100%) |
99.76% |
100.67% |
100.24% |
|
n=3 Level III (150%) |
100.16% |
100.08% |
100.78% |
|
Precision, Repeatability |
1.0 |
0.5 |
0.8 |
|
Intermediate precision Day 1 |
1.1 |
0.6 |
0.4 |
|
(% RSD), n=6 |
0.2 |
0.8 |
1.2 |
|
LOD (µg/ml) |
1.05 |
0.50 |
0.46 |
|
LOQ (µg/ml) |
3.19 |
1.52 |
1.40 |
|
Robustness |
Robust |
Robust |
Robust |
|
Solution Stability |
Stable |
Stable |
Stable |
|
System suitability, Plate count Tailing Resolution |
2917 1.66 – |
3930 1.76 5.8 |
3527 1.16 3.6 |
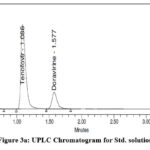 |
Figure 3a: UPLC Chromatogram for Std. solution Click here to View figure |
 |
Figure 3b: UPLC Chromatogram of sample solution. |
In the concentration ranges of 37.5g/ml to 225g/ml for lamivudine, 37.5g/ml to 225g/ml for tenofovir & 12.5g/ml to 75g/ml for doravirine, it was discovered that the procedure was linear and adhered to Beer’s law. In all three linearity plots, the correlation coefficient was discovered to be within the acceptable range, or 0.999. The plots were depicted in Figs. 4a, 4b, and 4c, and Table 2 showed the linearity results.
Table 2: Linearity results
|
S. No. |
Lamivudine |
Tenofovir |
Doravirine |
||||
|
concentration (µg/ml) |
peakarea
|
concentration (µg/ml) |
peakarea
|
concentration (µg/ml) |
peakarea
|
||
|
1 2 3 4 5 6 |
37.5 75.0 112.5 150.0 187.5 225.0 |
293918 604734 868835 1201390 1469115 1758968 |
37.5 75.0 112.5 150.0 187.5 225.0 |
342605 720084 997205 1414172 1695828 2027558 |
12.5 25.0 37.5 50.0 62.5 75.0 |
93273 184223 276192 371973 452428 539380 |
|
|
Correlation |
0.9998 |
0.9992 |
0.9997 |
||||
 |
Figure 4a: Linearity plot of lamivudine |
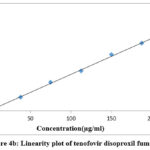 |
Figure 4b: Linearity plot of tenofovir disoproxil fumarate. |
 |
Figure 4c: Linearity plot of doravirine |
The above method is said to be Accurate as the % recovery values for lamivudine are 99.15% – 100.16%, for tenofovir it was 100.08% – 100.88% and for doravirine it was 99.99% – 100.78%, which were within the limits. For the determination of precision, % RSD was calculated in two ways, repeatability and intermediate precision. The % RSD for repeatability was 1.0, 0.5 and 0.8 for lamivudine, tenofovir and doravirine respectively. The % RSD for day 1 was 1.1 and for day 2, it was found to be 0.2 for lamivudine. The % RSD for day 1 was found to be 0.6 and for day 2, it was found to be 0.8 for tenofovir. The % RSD for day 1 was found to be 1.2 and for day 2, it was found to be 0.4 for doravirine. The above values indicate that the method was precisely developed.
Since the placebo peak did not interfere with the typical drug peaks, the approach was proven to be precise. In Fig. 5, the placebo chromatogram was displayed.
 |
Figure 5: UPLC chromatogram for placebo solution. |
The linearity results were used to calculate the LOD & LOQ values. LOD & LOQ data for lamivudine were found to be 1.05 and 3.19, respectively. Tenofovir’s LOD & LOQ were discovered as 0.50 and 1.52, respectively. For doravirine, the LOD was determined as 0.46 and the LOQ as 1.40.
The robustness of the method is detected by slightly changing the finally selected chromatographic conditions and the method was found to be robust as % RSD values were observed within the acceptance criteria. The robustness results were summarized in Table3.
Table 3: Robustness results
|
Parameter |
Lamivudine |
Tenofovir |
Doravirine |
|
Optimized |
1.1 |
0.6 |
1.2 |
|
Less flow rate |
1.8 |
0.8 |
1.6 |
|
More flow rate |
0.9 |
1.7 |
1.3 |
|
Decrease mobile phase (organic) |
1.5 |
0.8 |
1.0 |
|
Increase mobile phase (organic) |
0.4 |
0.4 |
0.5 |
|
Low column temperature |
0.2 |
1.0 |
0.5 |
|
More column temperature |
0.2 |
0.3 |
0.3 |
After 24 hours standing of standard drug in solution form, the drugs were found to be stable as there was no deviation in results.
The drug solution was exposing to several stressed conditions, like acidic, alkaline, peroxide, thermal, and photolytic, to assess the analytical method stability. Since the net deterioration was found to be within acceptable bounds, the medication solution was determined to be stable. Degradation chromatograms were displayed in Fig. 6 together with the final results of the forced degradation research, which are provided in Table 4.
Table 4: Forced degradation study results
|
Drug |
Forced degradation condition |
|||||
|
Acid |
Alkaline |
Peroxide |
Thermal |
Photolytic |
||
|
Lamivudine
|
% Assay % Degradation |
93.89 6.11 |
80.89 19.11 |
95.37 4.63 |
97.26 2.74 |
98.70 1.30 |
|
Tenofovir
|
% Assay % Degradation |
93.77 6.23 |
95.67 4.33 |
95.36 4.68 |
97.06 2.94 |
98.01 1.99 |
|
Doravirine
|
% Assay % Degradation |
94.41 5.59 |
95.57 4.43 |
95.58 4.42 |
97.27 2.73 |
98.17 1.83 |
 |
Figure 6a: Chromatogram for Acid degradation |
 |
Figure 6b: Chromatogram for Basic degradation |
 |
Figure 6c: Chromatogram for Oxidation stress degradation |
 |
Figure 6d: Chromatogram for Photolytic degradation. |
 |
Figure 6e: Chromatogram for Thermal degradation |
Conclusion
Novel technique is developed for concurrent determination of the compounds lamivudine, tenofovir and doravirine in active pharmaceutical ingredient & formulation by UPLC. According to ICH requirements, the devised method was validated, and it was discovered to be specific, accurate, linear, sensitive, and highly robust. The stressed degradation studies was also conducted to determine the stability of the analytical method. The degradation studies revealed that the approach remained stable even when subjected to stressful situations. For routine quality control analysis of simultaneous estimation of lamivudine, tenofovir, & doravirine in combination dosage forms, the developed UPLC method can be employed.
Acknowledgement
The Hetero Labs Pvt. Ltd. in Hyderabad and the Spectrum labs in Hyderabad, India, who provided the resources needed to conduct this research are both gratefully acknowledged by the authors.
Conflict of Interest
We have no conflicts of interest to disclose
References
- Jayaseelan, S.; Ganesh, S.; Rajasekar, M.; Sekar, V.; Perumal, P. Int. J. Pharm. Tech. Res. 2010, 2(2), 1539-1542.
- Deepali, G.; Elvis, M. J Young Pharm. 2010, 2(4), 417-419.
- Gorja, A.; Sumanta, M. (2018). Saudi J. Med. Pharm. Sci., 2018, 4(2), 289-296.
- Budawari, S. The Merck Index, Merck and Co. Inc. Whitehouse Station. NJ, 630, 32-1631, 2001.
- Martindale, S. S. The complete drug reference, Electronic version. 2007.
- Martin, P.; Lau, D.T.; Nguyen, M.H.; Janssen, H.L.; Dieterich, D.T.; Peters, M.G.; Jacobson, I.M. Clin. Gastroenterol. Hepatol. 2015, 13(12), 2071–87.e16
- Khalilieh, S.; Yee, K.L.; Sanchez, R.; Stoch, S.A.; Wenning, L.; Iwamoto, M. Clin. Drug Investig. 2020, 40(10), 927-946.
- Talwani, R.; Temesgen, Z.; Drugs Today. 2020, 56(2), 113-124.
- Tej Kumar, K.; Prasad, K.; Pallavi, A.; Suryakala, D. Biomed. Chromatogr. 2021, 35(8), e5121.
- Godela, R.; Gummadi, S. Ann. Pharm. Fr. 2021, 79(6), 640-651.
- Indira Priyadarshini, G.; Harish, K. Int. J. Pharm. Res. Appl. 2021, 6(5), 1272-1284.
- Balaji Gupta Tiruveedhi, V.L.N.; Venkateswara Rao, B.; Kishore Babu, B. Int. J. Appl. Pharm. 2021, 13(1), 153-159.
- Gowri, G.; Sowjanya, G. Pharm. Chem. J. 2020, 54, 526-535.
- Pandya, Y.; Patel, S. Int. J. Health Sci. 2022, 6(S3), 4931–4949.
- Balaji, N. T.; Abhilasha, M.; Manoj S. C. Biointerface Res. Appl. Chem. 2022, 13(1), 1-14.
- Challamalla, P.; Jayashree, V. J. Drug Alcohol Res. 2022, 11(7).
- Swetha, A.; Ramya Kuber, B. Future J. Pharm. Sci. 2021, 7.
- ICH Q2A validation of analytical procedure: Methodology International Conference on Harmonization, Geneva, 1994.
- ICH Q2B validation of analytical procedure: Methodology International Conference on Harmonization Geneva, 1996.
- Ashok, G.; Sumanta, M. Asian J. Pharm. Edu. Res. 2018, 7(1), 77-89.
- Jahnavi, B.; Ganapaty, S. Indian J. Pharm. Biol. Res. 2017, 5(4), 10-16.
- Ngwa, G. Drug delivery Technol. 2010, 10, 56-59.

This work is licensed under a Creative Commons Attribution 4.0 International License.
About The Author
![]()
A New Edition of Web of Science
Journal Impact Factor
2022: 0.5
Five Year: 0.8
Journal is Indexed in

Cabells Whitelist
![]()


