Isolation and Characterisation of Flavonoids (Rutin) from the Roots of Cadaba Aphylla (Thunb) and Adenia Glauca of Potential in Anti-Oxidant Activity
A. Anitha Immaculate1,2* , J. Rosaline Vimala 1 and David T. Takuwa2
1Department of Chemistry, Holy Cross College (Autonomous), Affiliated to Bharathidasan University, Trichy-1, Tamil Nadu, India
2Department of Chemistry, University of Botswana, Private Bag UB 00704 Gaborone, Botswana
Corresponding Author E-mail: anifraxy@gmail.com
DOI : http://dx.doi.org/10.13005/ojc/380610
Article Received on : 17 Nov 2022
Article Accepted on :
Article Published : 19 Dec 2022
Reviewed by: Dr. Akhtar Hussain
Second Review by: Dr. Camila Kazimova
Final Approval by: Dr. Naeem Uddin
Natural medicine is widely used to treat a variety of ailments. This work aims to isolate and characterise flavonoids from the roots of Cadaba aphylla and Adenia glauca. The compound was extracted using the Ultrasonicate Assisted Extraction (UAE), and Chromatographic methods including thin layer chromatography (TLC) and column chromatography were then used to separate it. The isolated compound was then examined using UV-visible, FTIR, NMR (H1 & C13), and mass spectra (MS) followed by antioxidant evaluation. From the qualitative and spectral examination. The isolated component is identified as 3, 3', 4', 5, 7-pentahydroxy flavones-3-rutinoside, it is concluded (Rutin) and it also showed good free radical scavenging behaviour. Therefore, these plants can be used for therapeutic purpose.
KEYWORDS:Adenia glauca; Cadaba aphylla; characterisation; flavonoid, anti-oxidant; Isolation
Download this article as:| Copy the following to cite this article: A. Anitha Immaculate 1*, J. Rosaline Vimala 2, And David T. Takuwa 3 Immaculate A. A, Vimala J. R, Takuwa D. T. Isolation and Characterisation of Flavonoids (Rutin) from the Roots of Cadaba Aphylla (Thunb) and Adenia Glauca of Potential in Anti-Oxidant Activity. Orient J Chem 2022;38(6). |
| Copy the following to cite this URL: A. Anitha Immaculate 1*, J. Rosaline Vimala 2, And David T. Takuwa 3 Immaculate A. A, Vimala J. R, Takuwa D. T. Isolation and Characterisation of Flavonoids (Rutin) from the Roots of Cadaba Aphylla (Thunb) and Adenia Glauca of Potential in Anti-Oxidant Activity. Orient J Chem 2022;38(6). Available from: https://bit.ly/3jcM2NI |
Introduction
Traditional medicinal herbs were the primary supply source in most developing nations. Nowadays, plants are the primary source for developing new drugs and treating a variety of disorders in the field of natural medicine. In most of the world, people, especially those who reside in rural areas, rely on conventional plant-based medications because they are easily accessible, socially acceptable, and affordable. Numerous secondary metabolites, including alkaloids, flavonoids, and other vital phytocomponents, are present in plants.1,2,3 Most researchers discovered that plants contain flavonoids and phenolic components, which are great for acting as anti-oxidants, anti-inflammatory agents, anticancer and treating various ailments.4,5 The natural plant of the native Botswana and Southern Africa, Cadaba aphylla (Thunb) belongs to the “Capparaceae” family 6 whereas, it is a leafless plant, and the roots are taken orally to treat many disorders. 7,8 Previous research of C.aphylla root extracts proves that they have been used to treat several cancer cells.9 Adenia glauca belongs to “Passifloraceae” family and is native to southern Africa. 10 This plant’s powdered substance has been used to cure ear infections, swelling legs, and skin conditions related to the skin. 11 Additionally, plant extracts have been employed for protein synthesis and hemagglutinating activity, as well as galactose-binding lectins,12 respectively which make it a potential therapeutic source.
In the present study these plants were employed for isolation of bioactive principle and characterize its structure using various spectral techniques such as UV-Visible, FT-IR, H1NMR, C13 NMR and MS and the antioxidant activity of the isolated compound was then subjected to invitro analysis.
Materials and methods
Chemicals and Reagents
The chemicals (n-Butanol, hexane, methanol, petroleum ether, ethyl acetate, precoated TLC Silica gel 60 F, column chromatographic setup) and DPPH were bought from Sigma Aldrich.
Collection of plants
Medicinal plants of Cadaba aphylla (Thunb) (Capparaceae) and Adenia glauca (Passifloraceae) roots were collected from Kanye and Moshupa villages in Botswana’s capital city, Gaborone. The Botswana National Herbarium and the University of Botswana Herbarium authenticated and identified the plants. The plants were washed with tap water to remove the unwanted particles like sand and dust. Then the roots are cut into small pieces for fast drying under the shade. After complete drying, the plant roots were powdered using Thomas Wiley Model 4 grinder, and then stored in the brown bottle for further analysis
Extraction process
The Ultrasonicate Assisted extraction method (UAE) was followed for the extraction of plants.13 1.000g of each plant sample was accurately weighed into a 15ml centrifuge tube and 10ml methanol was added. The plant samples were vortexed for 5 minutes and then put into an ultrasonic bath at 25ºC for 30 min. Again, Vortex shaking was done for 1min; then sample was centrifuged for10 minutes at 5000rpm. To remove the undissolved solid particles, the remaining supernatant solution was filtered through a Whatman No.1 filter paper. This was followed by filtration with a 0.45µm Nylon filter membrane to remove suspended particles. The filtrate was then kept for further analysis.
Isolation by Column and thin-layer chromatography
In column chromatography, the stationary phase is a solid, while the mobile phase is a liquid. This kind of chromatography uses adsorption. Typically, it is used for the regular separation and purification of substances. A thoroughly agitated silica gel dispersion (100–150 g in petroleum ether at 60–80°C) was added to a column. The surplus petrol-ether was allowed to run through the column once the absorbent had settled thoroughly. The slurry was digested into a well-stirred column after passing through the petrol-ether silica gel. In order to achieve a homogeneous packing, the progressive setting was created by maintaining a mild agitation as solvent flowed through the column. The silica gel slurry and the extracted sample were combined, and the mixture was put to the top of the column as uniformly as feasible. In order to prevent column packing distortion, distorted bands were produced. Hexane, chloroform, and methanol mixes of increasing polarity were used to elute the column in turn. Methanol elution produced a yellow color.
A stationary phase (silica-gel coated plate) was used, and the fraction was put as spots on the plate using capillary tubes, about 1 cm from the base. An appropriate solvent combination, consisting of ethanol, water, and ethyl acetate (5:1:5), was then used to submerge the dish. After that, the plate was put into a tank that was well-covered and contained adequate solvent. Up the plate, the solvent moves. Spots in the thin layer form as the solvent separates the mixture’s components at varying rates, which causes the solvent to rise through the thin layer. The plate is taken from the tank and briefly dried at moderate temperatures of 60–120°C once the solvent has nearly reached the top edge of the plate and covered nearly 3/4 of the plate. The extracts contained secondary metabolites, which TLC was able to identify. It is a ratio between the distances that the sample and solvent travelled.
Rf = distance of the sample (solute) from the origin / distance of the solvent from the origin
Confirmation test for flavonoid with standards:
The separated fraction was qualitatively tested for the presence of flavonoids on exposure to ammonia. The colour so obtained was compared with the standard flavonoid namely quercetin.
Characterisation of isolated compound:
UV and FT-IR Spectroscopic analysis
Using a Perkin Elmer Spectrophotometer, the collected sample was scanned in the 200-900nm wavelength range, and the distinctive peaks were found. The FTIR study was conducted using a Perkin Elmer Spectrophotometer, and the unique peaks between 400 to 4000 cm-1 corresponding to their functional groups were visible. Recorded were the FTIR and UV peak values. Three times through each analysis, the spectrum was confirmed.
NMR Spectroscopy
Column chromatography was utilized to divide plant extract into fractions, and Thin Layer chromatography was employed to further purify the obtained particles. 5 mg of the purified substance in DMSOd6 was used in an NMR experiment on a BRUKER-AMX400 MHz device. Chemical changes are reported in parts per million (ppm) and the internal standard is tetramethyl silane.
Mass spectrum analysis
The sample was analyzed by GC-mass spectrometry (GC-MS) using a JEOL GC MATE-11 HR mass spectrometer. For the chromatography, a DB 5 MS capillary column (30 m x 0.25 mm (internal diameter) film thickness 0.25 mm) was employed. The mass spectrometer was operated in electron impact mode at 70 eV. The temperature of the transfer line and ion source was controlled at 250 C. Positive ion mode mass spectra with a m/z range of 50 to 600 were captured. The detector converts the quantity of molecules into an electrical signal, and a computer or integrator converts each of the signal’s peaks into a graph.
Application:
In-vitro antioxidant activity by DPPH assay for the isolated compound:
4mg of DPPH was dissolved in 100 mL of ethanol. Different concentrations, such as 20,40,60,80 and100 µg/mL, were made from the sample stock solution, which was obtained by dissolving 0.01 g in 1 mL (100 mg/mL). 2 mL of DPPH reagent was combined with 1 mL of various sample solution concentrations and allowed to room temperature for 30 minutes, the absorbance at 517 nm was measured, and the antioxidant activity percentage was determined using the formula below.
% Of Radical Scavenging activity = (Ac -As / Ac x 100)
Ac – Absorbance of Control, As – Absorbance of Sample
The absissa of the plots represented the concentration of the tested material, and the ordinate reflected the typical percentage of radical scavenging activity, which was used to determine the IC50 values.
Result and discussion:
Column Chromatographic separation:
The technique was used to separate flavonoid compounds using column chromatography.14 Column chromatographic separation of C.aphylla and A. glauca extracts allowed three fractions. The result of the chromatographic separation is shown in Fig1 and Table 1.
 |
Figure 1: Chromatographic extraction of C.aphylla and A.glauca |
Table 1: Chromatographic Separation
|
S. No. |
Eluents |
No. of fraction(s) |
Nature of fractions |
|
Cadaba aphylla |
|||
|
1 |
Hexane (HE) |
1 |
Pink color |
|
2 |
Chloroform (CE) |
1 |
Dark brown color |
|
3 |
Methanol (ME) |
1 |
Brownish yellow color |
|
Adenia glauca |
|||
|
1 |
Hexane (HE) |
1 |
White colour |
|
2 |
Chloroform (CE) |
1 |
Whitish yellow colour |
|
3 |
Methanol (ME) |
1 |
Dark yellow colour |
Qualitative analysis of flavonoids in Chromatographic Separation:
Chemical analyses were conducted on the extract using established methods to identify the contents as indicated, including qualitative screening for flavonoids of all eluted substances.15,16,17 The production of yellow color with the reaction by exposure to ammonia was used to identify the qualitative analysis of flavonoids. C.aphylla is shows dark yellowish brown while A.glauca is yellow in colour, indicating the presence of flavonoid as compared with standard flavonoid quercetin, as shown in Table 2 and Fig 2.
Table 2: Qualitative analysis of flavonoids in Chromatographic Separation.
|
S. No. |
Eluents |
C.aphylla |
A. glauca |
|
1 |
Hexane (HE) |
– |
– |
|
2 |
Chloroform (CE) |
– |
– |
|
3 |
Methanol (ME) |
++ |
++ |
|
Std. Flavonoid (Quercetin) |
++ |
||
(-) Absent, (+) present and (++) High concentration
 |
Figure 2: Qualitative analysis of flavonoids in chromatographic separation |
Thin layer chromatography separation
It is used to confirm the presence of secondary metabolites in the extracts. The spot showing yellow coloration on exposure to ammonia is a positive indication for the presence of flavonoids. 15,16,18 The presence of flavonoids was confirmed further using TLC. The methanolic fraction of Cadaba aphylla and Adenia glauca methanol fraction spots showed Rf value of 0.41 and 0.40 respectively which is then compared with the standard flavonoid substances namely quercetin (Rf=0.87) and rutin(Rf=0.42). From the observed results it can be confirmed that the isolated fraction contains rutin as the flavonoid. The results are shown in Table 3 and Fig 3.
Table 3: Analysis of flavonoid by TLC
|
Flavonoid |
Cadaba aphylla |
Adenia glauca |
|
Sample |
0.41 |
0.40 |
|
Std. (Rutin) |
0.42 |
0.41 |
|
Std. (Quercetin) |
0.87 |
0.86 |
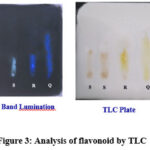 |
Figure 3: Analysis of flavonoid by TLC |
Spectral analysis of Isolated compound:
UV Spectrum analysis of flavonoid:
The UV-Visible spectrum of Cadaba aphylla and Adenia glauca in the present study shows characteristics absorption peaks at λmax= 299.07 nm and 300.10 nm, figure 4a and 4bvalues which is in accordance with the study conducted by,19, 20 The presence of rutin was confirmed by the UV spectrum study’s findings.
 |
Figure 4: (a). Cadaba aphylla |
 |
Figure 4: (b) Adenia glauca |
FTIR Spectrum analysis of flavonoid
When a mixture of plant extracts is unknown, FT-IR is a useful tool for characterizing and identifying the chemicals or functional groups (chemical bonds) that are present. The FT-IR spectrum of the Cadaba aphylla plant extract is given in Fig 5a. The FTIR analysis of C. aphylla plant extract delivered a broad peak at 2917.54 cm-1, due to C-H stretching, strong peaks at 1408.76cm-1, represent C-C stretch, indicating the presence of aromatics and C-C stretch (in-ring) attributing to the presence of aromatic ring, whereas peaks at 1219.27 cm-1 and 1065.80 cm-1 is due to C–N stretch, which indicates the presence of aliphatic amines. The FTIR spectrum of the Adenia glauca plant extract is given in Fig 5b. The FTIR analysis of A. gluaca plant extract shows broad peak at 3428.01 cm-1, representing alcohols, and O–H stretching phenols. The peak at 2924.79 cm-1 represents alkanes C–H stretching. The strong peaks at 1444.64 cm-1 and 1421.29 cm-1, represent C-C stretching which indicates the presence of aromatics and C-C stretch (in-ring) attributed to benzene ring present (aromatic ring), while the peak at 1110.43 cm-1 shows C–N stretch, which indicates aliphatic amines. The finding of the flavonoids in the present investigation is in agreement of many researchers as their investigation revealed that flavonoids compounds have major functional groups –OH group, -OH bending, C=O group, C-H stretch and C-H bending groups.21,22 The results supported the presence of aromatic and phenolic groups in rutin.
 |
Figure 5: (a). FTIR spectrum of C.aphylla |
 |
Figure 5: (b) FTIR spectrum of A.glauca. |
NMR Spectrum of flavonoid
NMR spectroscopy is a commonly used technique for elucidation of natural product structure. The technique is used to quantify and identify individual components from compounds’ mixtures. It provides a highly reproducible means for purity, strength, identity and composition verification, quality control analysis and product assessment. Many compounds could be identified using this spectroscopy.23
1H-NMR & 13C -NMR spectrum of flavonoid (C.aphylla)
The 1HNMR spectrum shown in Fig 6a & Table 4a exhibits a two-doublet proton at the frequencies of δ6.21 and δ 6.40 ppm, which correspond to the protons H-6 and H-8, respectively. Two doublets in the range of 6.2–6.8 ppm is produced by the protons at flavanol’s C-6 and C-8, which contain the typical 5,7-dihydroxy substitution pattern. When compared to the signal for the H-8, the H-6 doublet consistently occurs at a greater field.24 At the positions H -1″, H-1″, δ4.52, δ5.10, δ6.89 and δ7.68 four doublet proton occur. respectively, the H- 5′ and H-2′ protons. At 7.61 ppm, the H-6′ proton, one double doublet proton is discovered. The chemical shift values confirms that the isolated compound is rutin(3, 3’, 4’,5, 7-pentahydroxy flavones-3-rutinoside).
The study of the 13C-NMR data produced evidence that supported the rutin’s structural identity, and the full assignment is shown in Fig. 6b and Table. 4b. The resonance signals at 158.49 ppm and 179.43ppm is due to C-2 and C-4 carbons, C-1 resonates at 116.13ppm. The peaks in the proton and carbon NMR spectrum are in resemblance with the rutin, which was also confirmed by previous literature.25,26,27Thus, it can be confirmed that the isolated compound is found to be rutin.
 |
Figure 6: (a). 1H -NMR spectrum of flavonoid |
Table 4a: 1H-NMR data and their assignment for isolated compound obtained from the extract.
|
Extract |
Standard (Rutin) [27] |
Assignment |
|
1.13 |
1.12 |
d, 3H, CH3 |
|
3.37-3.55 |
3.38-3.56 |
m, 8H, rutinoside protons and CH2O |
|
3.63 |
3.62 |
dd, 1H, CH-CH3 ramnose |
|
3.83 |
3.82 |
d, 1H, CH-CH2O glucose |
|
4.51-4.52 |
4.51 |
d, 1H, OCHO ramnose |
|
5.06-5.15 |
5.10 |
d, 1H, OCHO glucose |
|
6.21-6.23 |
6.20 |
d, 1H, Ar-H |
|
6.38-6.40 |
6.39 |
d, 1H, Ar-H |
|
6.86-6.88 |
6.89 |
d, 1H, Ar-H |
|
7.61-7.68 |
7.61-7.67 |
m, 2H, Ar-H |
 |
Figure 6: (b). 13C -NMR spectrum of flavonoid |
Table 4b: 13C-NMR data and their assignment for isolated compound obtained from C.aphylla extract.
|
Location of Carbon |
Extract |
Standard (Rutin)[25,26] |
|
2 |
158.49 |
158.5 |
|
3 |
135.71 |
135.6 |
|
4 |
179.43 |
179.4 |
|
5 |
162.67 |
162.5 |
|
6 |
99.86 |
99.9 |
|
7 |
166.03 |
166.0 |
|
8 |
94.78 |
94.8 |
|
9 |
159.40 |
159.3 |
|
10 |
105.43 |
105.6 |
|
1’ |
123.17 |
123.1 |
|
2’ |
117.71 |
117.6 |
|
3’ |
145.86 |
145.8 |
|
4’ |
148.86 |
149.7 |
|
5’ |
116.13 |
116.1 |
|
6’ |
122.65 |
123.5 |
|
1” |
104.74 |
104.7 |
|
2” |
75.66 |
75.7 |
|
3” |
77.24 |
77.2 |
|
4” |
71.45 |
71.4 |
|
5” |
87.13 |
78.1 |
|
6” |
68.66 |
68.6 |
|
1’’’ |
102.45 |
102.4 |
|
2’’’ |
72.02 |
72.0 |
|
3’’’ |
72.24 |
72.2 |
|
4’’’ |
73.80 |
73.9 |
|
5’’’ |
69.71 |
69.7 |
|
6’’’ |
17.88 |
17.9 |
1H-NMR & 13C -NMR spectrum of flavonoid (A.glauca)
The 1HNMR spectrum Fig 7a & Table 5a showed a two-doublet proton at the frequencies of δ 6.21 and δ 6.40 ppm, which correspond to the protons H-6 and H-8, respectively. Two doublets in the range of 6.2–6.8 ppm are produced by the protons at flavanol’s C-6 and C-8, which contain the typical 5,7-dihydroxy substitution pattern. When compared to the signal for the H-8, the H-6 doublet consistently occurs at a greater field.24 At the positions H -1″, H-1″, δ4.52, δ5.10, δ6.89 and δ7.68 four doublet proton occur. respectively, the H- 5′ and H-2′ protons. At 7.61 ppm, the H-6′ proton, one double doublet proton is discovered. It is thereby characterised as 3, 3’, 4’,5, 7-pentahydroxy flavones-3-rutinoside (rutin).
The study of the 13C-NMR data produced evidence that supported the rutin’s structural identity, and the full assignment is shown in Fig. 7b and Table. 5b. The C-2 and C-4 carbons absorbs at 158.46 ppm and 179.42ppm, respectively. C-1׳׳ absorbs at 116.20ppm. The NMR (proton and carbon) peaks showed a resemblance with the rutin, which was also confirmed by previous literature.25,26,27 Thus, it can be confirmed that the isolated compound is found to be rutin.
 |
Figure 7: (a). 1H -NMR spectrum of flavonoid |
Table 5a: 1H-NMR data and their assignment for isolated compound obtained from A.glauca extract
|
Extract |
Standard (Rutin) [27] |
Assignment |
|
1.12 |
1.12 |
d, 3H, CH3 |
|
3.36-3.54 |
3.38-3.56 |
m, 8H, rutinoside protons and CH2O |
|
3.62 |
3.62 |
dd, 1H, CH-CH3 ramnose |
|
3.84 |
3.82 |
d, 1H, CH-CH2O glucose |
|
4.53-4.55 |
4.51 |
d, 1H, OCHO ramnose |
|
5.08-5.16 |
5.10 |
d, 1H, OCHO glucose |
|
6.20-6.21 |
6.20 |
d, 1H, Ar-H |
|
6.40-6.41 |
6.39 |
d, 1H, Ar-H |
|
6.87-6.90 |
6.89 |
d, 1H, Ar-H |
|
7.59-7.67 |
7.61-7.67 |
m, 2H, Ar-H |
 |
Figure 7: (b). 13C -NMR spectrum of flavonoid. |
Table 5b: 13C-NMR data and their assignment for isolated compound obtained from A.glauca extract
|
Location of Carbon |
Extract |
Standard (Rutin) [25,26] |
|
2 |
158.46 |
158.5 |
|
3 |
135.70 |
135.6 |
|
4 |
179.42 |
179.4 |
|
5 |
162.64 |
162.5 |
|
6 |
99.88 |
99.9 |
|
7 |
166.10 |
166.0 |
|
8 |
94.70 |
94.8 |
|
9 |
159.36 |
159.3 |
|
10 |
105.50 |
105.6 |
|
1’ |
123.20 |
123.1 |
|
2’ |
117.65 |
117.6 |
|
3’ |
145.70 |
145.8 |
|
4’ |
148.80 |
149.7 |
|
5’ |
116.20 |
116.1 |
|
6’ |
123.30 |
123.5 |
|
1” |
104.78 |
104.7 |
|
2” |
75.60 |
75.7 |
|
3” |
77.10 |
77.2 |
|
4” |
71.50 |
71.4 |
|
5” |
78.30 |
78.1 |
|
6” |
68.50 |
68.6 |
|
1’’’ |
102.30 |
102.4 |
|
2’’’ |
72.20 |
72.0 |
|
3’’’ |
72.10 |
72.2 |
|
4’’’ |
73.85 |
73.9 |
|
5’’’ |
69.68 |
69.7 |
|
6’’’ |
17.17 |
17.9 |
Mass spectrum analysis of flavonoids (C.aphylla and A.glauca)
The mass spectrum of the isolated compound from C.aphylla and A.glauca is illustrated in Fig 8 a,8b and Fig 9a, 9b. A base peak [M]+ in the both the cases for the compound was observed at m/z 610.05 and 610.36 respectively, in the mass spectrum indicating the compounds as rutin. The molecular formula is inferred to be C27H30O16. This result agrees with the earlier report,28 which reported that mass spectrum peak 610 was found to be rutin isolated from C.aphylla extract. Rutin (3, 3′, 4′, 5, 7-pentahydroxy flavones-3-rutinoside) has been identified as the isolated compound based on chemical and spectral data. (MF: C27H30O16) from both the plants.
 |
Figure 8:a: Mass spectrum of isolated flavonoid (C.aphylla) |
 |
Figure 8: (b). Structure of isolated compound (C.aphylla) |
 |
Figure 9: (a): Mass spectrum of isolated flavonoid (A.gluca) |
 |
Figure 9: (b). Structure of isolated compound (A.gluca) |
Antioxidant of isolated compound:
The DPPH radical is ideally adapted for detecting antioxidants in crude plant extracts or isolated compounds extracted from plant material.29 An influential report of radical scavenging activity has been found in the isolated component from this plant. Compared to the ascorbic acid standard, the IC50 value demonstrates good activity as seen from Fig 10a & b and Table 6. Due to their purity, non-toxicity, and widespread acceptance, natural antioxidants have a higher medical benefit than chemical preservatives.30
 |
Figure 10: (a) In-vitro anti-oxidant DPPH assay for the isolated compound in Cadaba aphylla |
 |
Figure 10: (b). In-vitro anti-oxidant DPPH assay for the isolated compound in Adenia glauca. |
Table 6: % inhibitions of the isolated compound by the DPPH assay of the C.aphylla and A.glauca
|
Sample |
% Inhibitions |
Linear equation |
R2 |
IC50 value |
||||
|
20 (µg/ml) |
40 (µg/ml) |
60 (µg/ml) |
80(µg /ml) |
100(µg /ml) |
||||
|
Std(ascorbic acid) |
32 ± 1.72 |
46 ± 2.97 |
61 ± 4.78 |
72 ± 5.85 |
93 ± 6.69 |
Y=0.74 x +16.4 |
0.9908 |
45.40 |
|
Cadaba aphylla |
25 ± 1.46 |
39 ± 2.84 |
52 ± 3.92 |
66 ± 6.01 |
79 ± 6.21 |
Y= 0.675x+11.7 |
0.9998 |
57.29 |
|
Adenia glauca |
22 ± 1.65 |
36 ± 3.01 |
55 ±4.83 |
64 ± 6.51 |
82 ± 6.98 |
Y= 0.74 x + 7.4 |
0.9917 |
57.56 |
Conclusion
The extraction and characterisation of bioactive components found in plant sources still present challenges because they are composed of a complex mixture of primary and secondary metabolites. A bioactive component is extracted, separated and characterised from the roots of the C.aphylla and A.glauca plants as a result of the current work. By adopting separation techniques such as thin layer and column chromatography, bioactive principle was separated and isolated. The structural elucidation of the isolated compound was analyzed by UV-visible, FTIR, NMR and MS spectral methods. Rutin, also known as 3, 3′, 4′, 5, 7-pentahydroxy flavones-3-rutinoside, is a flavonoid with the chemical formula C27H30O16. The isolated compound possesses more therapeutical uses because of its antioxidant and anti-cancer properties.
Acknowledgement
All the authors have accepted responsibility for the entire content of this submitted manuscript and approved submission.
Conflict of interest
The authors declare no conflicts of interest regarding this article.
References
- Hussain, W.; Badshah, L.; Ullah, M. J. Ethnobiology Ethnomedicine. 2018, 14, 30.
CrossRef - Hoareau, L.; Silva, E.L. 1999, 2, 56-70.
CrossRef - Cragg, M.G.; Newman, D. J. Pharm Biol. 2001, 39, 8-17.
CrossRef - Ravipati, A.S.; Zhang, L.; Koyyalamudi, S.R. BMC Complement Altern Med 12. 2012, 173.
CrossRef - Chanda, S.; Nagani, K. J. pharmacognosy and phytochemistry. 2013, 2(2).
- http://pza.sanbi.org/cadaba-aphylla
- Setshogo, M.P.; Mbereki, C.M. Floristic diversity and uses of medicinal plants sold by street vendors in Gaborone, Botswana. 2011.
- Davids, D.; Gibson, D.; Johnson, Q. 2016, 194, 755–766.
CrossRef - Fouche, G.; et al. J. Ethnopharmacol. 2008.
- https://tula.house/blogs/tulas-plant-library/adenia-glauca
- Maema, L.P.; Mahlo, S.M.; Potgieter, M. J. Int. J. Tradit. Complement. Med 1. 2016: 28-44.
- Pelosi, E.; Lubelli, C.; Polito, L.; Barbieri, L.; Bolognesi, A.; Stirpe, F. 2005, 46(6), 658–663.
CrossRef - Abibu M.A.; Takuwa D.T.; Sichilongo K. Sep Sci plus. 2019,1–10.
- Charoonratana T.; Settharaksa S.; Madaka F.; Sak T.S. Int. J. Pharm Sci. 2014, 6, 224-6.
- Javed I.; Mohammad A.; Malaysian J. Pharmaceutical Sciences.2009, 7(1), 1–8
- Harborne J.B.; 2nd Edition, London, New York. 1973.
- Harborne J.B.; 2nd Edition, London, New York. 1984.
- Sofowara, A.; Spectrum Books Ltd., Ibadan, Nigeria. 1993.
- Adam J.H.; Omar, R.; Wilcock, C.C. J. Biological Sciences. 2002, 2, (9), 623–625.
CrossRef - Sasidharan,S.; Chen, Y.; Saravanan, D.; Sundram, K. M.; Latha, L. Y. African J. O. traditional, complementary and alternative medicines. 2011, 8(1).
CrossRef - Selvaraj, K.; Chowdhury, R.; Bhattacharjee, C. Int J Pharm Sci. 2013, 5(3), 743-749.
- Maria M. F. F.; Ikhmal, W. M. K. W. M.; Sabri1, M. G. M.; Ibrahim, M. S. C.; Adnan, A. Materials Science and Engineering. 2018, 440, 012035.
CrossRef - Kumari A.; Kumar, J. Int. J. Pharmaceut. Sci. Drug Res. 2019, 11: 376-381.
- Verpoorte R. J. Chem Ecol. 2006, 32, 2417–2428.
CrossRef - Marby T.J.; Markham K.R.; Thomas M. M. B. Springler-Verglar Publishers: New York. 1970, 1-58.
- Guvenalp, Z.; Nurcan, K.; Kazaz, C.; Yusuf, K.; Omur, D. L. Turk. J. Chem. 2006, 30, 515-523.
- Guvenalp, Z.; Omur, D. L. Turk.J.Chem. 2005, 29, 163-169.
CrossRef - Georgeta, S.; Pana, P.; Tunde, H.; Sanda, B. An. Univ. Oradea Fasc. Ecotoxicol. Zooteh. Tehnol. Ind. Aliment. 2016, 109-113.
- Braca, A.; Sortino, C.; Politi, M.; Morelli, I.; Mendez, J. J. ethnopharmacology. 2002, 79(3), 379-381.
CrossRef - Jaya Gupta; Amit Gupta. Int. J. Chemical Studies.2015, 3(2), 113-115.
CrossRef

This work is licensed under a Creative Commons Attribution 4.0 International License.
About The Author
![]()
A New Edition of Web of Science
Journal Impact Factor
2022: 0.5
Five Year: 0.8
Journal is Indexed in

Cabells Whitelist
![]()


