Equilibrium and Kinetics Adsorption Modelling Comparison of Zn(II) and Fe(II) on Phosphate Modified Oil Palm Empty-Fruit Bunches Bio-Sorbent
M. Zubir1*, Z. Muchtar1, E. Rukmana2, R. Selly1, S. Rahmah1, Jasmidi1, H.I. Nasution1 and D Miswanda3
1Department of Chemistry, Faculty of Mathematics and Natural Science, Universitas Negeri Medan, Medan 20221, Indonesia
2Nutrition Science Study Program, Faculty of Engineering, Universitas Negeri Medan, Medan 20221, Indonesia
3Department of Pharmacy, Muslim Nusantara Al Washliyah University, Medan 20147, Indonesia.
Corresponding Author E-mail: moondrazubir@unimed.ac.id
DOI : http://dx.doi.org/10.13005/ojc/380606
Article Received on : 28 Oct 2022
Article Accepted on :
Article Published : 22 Nov 2022
Reviewed by: Dr. Nizar el Guesmi
Second Review by: Dr. Nisha Thakur
Final Approval by: Dr.MGH Zaidi
Oil palm empty-fruit bunches (OPEB) bio-sorbent were modified by introducing phosphate(P) into the OPEB-cellulose structure (P-OPEB). This modification effect to increasing the surface area in purpose to enhancing the adsorption amount. Adsorption of Zn(II) was keeping the optimum adsorption by P-OPEB is higher than Fe(II). On the other hand, by using OPEB bio-sorbent, Fe(II) was adsorbed higher than Zn(II), but the adsorption amount by P-OPEB is higher than OPEB which indicated phosphate modified was effected to increasing the adsorption capability of OPEB. The properties of all adsorption systems are similar, refer to the Langmuir model, and kinetic models refer to the 2nd-order kinetics model, but Fe(II) adsorption fits better with the OPEB bio-sorbent. Besides being able to increase the adsorption capacity, P-OPEB also makes the adsorption process faster so that can be more efficient to remove Fe and Zn contaminants.
KEYWORDS:Adsorption; Bio-sorbent; Heavy metals; Phosphate modified; Oil palm waste
Download this article as:| Copy the following to cite this article: Zubir M, Muchtar Z, Rukmana E, Selly R, Rahmah S, Jasmidi J, Nasution H. I, Miswanda D. Equilibrium and Kinetics Adsorption Modelling Comparison of Zn(II) and Fe(II) on Phosphate Modified Oil Palm Empty-Fruit Bunches Bio-Sorbent. Orient J Chem 2022;38(6). |
| Copy the following to cite this URL: Zubir M, Muchtar Z, Rukmana E, Selly R, Rahmah S, Jasmidi J, Nasution H. I, Miswanda D. Equilibrium and Kinetics Adsorption Modelling Comparison of Zn(II) and Fe(II) on Phosphate Modified Oil Palm Empty-Fruit Bunches Bio-Sorbent. Orient J Chem 2022;38(6). Available from: https://bit.ly/3VedEQ6 |
Introduction
The development of science and technology results in increased usage of heavy metals such as Fe, Zn, Cu, Pb, Hg, Cd, and Cr. Heavy metals are toxic materials that can cause damage to aquatic organisms.1-4 Sources of metal pollution mostly originate from mining, metal smelting, and other industries, but can also come from domestic waste as well as agricultural land that uses metal-containing fertilizers.5,6 Heavy metal pollution can damage ecosystems in water, affecting the population and biodiversity. Water pollution can be caused by two types of pollutants: those that cause eutrophication and toxic substances that cause damage to aquatic organisms.7-9 Previously, several treatments had been developed, such as ion exchange,8 deposition,5,9 and electrochemistry.10 However, the adsorption method has become an advantageous method for heavy metal control because of the uncomplicated method used, easy sample preparation, and unchallenging selection of adsorbents.11-13
The palm oil business produces a lot of solid trash, including oil palm empty-fruit bunches (OPEB). The OPEB produced accounts for around 23% of palm oil production. In one day, processing can produce hundreds of tons of OPEB. Since the main components of oil palm waste are cellulose and lignin, it is referred to as lignocellulosic waste.14-17 Notably, palm oil processing also produces liquid waste containing heavy metals such as Fe and Zn. As a result, OPEB has the potential to be a good recycled product that can be widely employed the function as a heavy metal adsorbent.18-20 OPEB contains cellulose (C6H10O5)n by 41.3% – 46.5%, whereas hemicellulose is 25.3% – 32.5% and contains lignin by 27.6% – 32.5%. Cellulose is a carbon molecule made up of more than 1000 glucose units bound by 1,4-β-glycoside bonds and can be decomposed into simple carbon compounds by various cellulose organisms. In the meanwhile, lignin is a difficult-to-degrade component of OPEB waste. This polymer is related to cellulose and hemicellulose as a structural polymer.21,22
In addition, palm is one of the cultivated plants that produces vegetable oil in the form of Crude Palm Oil (CPO). In the palm oil processing process, in addition to producing CPO, a large amount of waste such as shell waste (shell), as much as 6.5%, wet decanter solid (palm mud) 4%, fiber 13%, and liquid waste as much as 50% is also produced.23,24 Palm oil mill effluent is brown, with a high Chemical Oxygen Demand (COD) and Biological Oxygen Demand (BOD) concentration of 68.000 ppm and 27.000 ppm, respectively. It contains dissolved and suspended solids in the form of colloids, as well as oil residue. It’s acidic (pH 3.5 – 4) and made up of 95 percent water, 4–5 percent dissolved and suspended components (cellulose, protein, and fat), and 0.5 – 1 percent oil residue (mainly emulsion). Palm oil liquid waste has a high copper (Cu) 0.89 ppm, iron (Fe) 46.5 ppm, zinc (Zn) 2.3 ppm, and ammonia 35 ppm content.25,26
In this study, We explored solid waste from oil palm empty-fruit bunches as absorbent for heavy metal waste like Fe(II) and Zn(II), that is also produced from processing oil palm waste. Because of the Van der Waals interaction between these functional groups and positively charged heavy metals, the presence of the OPEB cellulose structure’s functional groups -OH and -COOH enhances the number of heavy metals adsorbed.27,28 The presence of -OH groups in cellulose is responsible for the polar nature of the adsorbent. The reactive nature of this functional group can also be modified on purpose to increase the adsorption ability of OPEB, like the phosphate introduced in this structure.29 The positively-charged phosphate will bind to the -OH group on cellulose and allow it to bind again with the-OH group on other cellulose. This polymerization bond chain will make the cellulose polymer structure longer so that the surface area of this bio-sorbent gets larger.30 In addition, the introduction of phosphate to the cellulose bonds in the OPEB bio-sorbent into phosphate oil palm empty-fruit bunches (P-OPEB) bio-sorbent is also a strategy to increase the amount of heavy metal adsorption, since the metal is better adsorbed in an acidic atmosphere.31 This strategy was also carried out because the larger the surface area of the bio-sorbent induced, the greater is the adsorption amount.32, 33
Materials and Methods
Materials
Oil palm empty bunches were taken from oil palm plantations around the Batang Kuis area, Deli Serdang, North Sumatra, Indonesia. A total of 15 kg was washed with distilled water, cut into small pieces, dried at 70 °C and ground to a size of 100 mesh. This oil palm empty bunch powder is called bio-sorbent without modification (OPEB bio-sorbent). The bio-sorbent is then purified by washing in three repetitions.
Phosphate Modification
A total of 50 g of bio-sorbent and 9.8 g of H3PO4 was combined, transferred to 1000 mL of distilled water and heated at 60 °C for 3 hours. Then it was cooled, filtered, and neutralized with distilled water until the pH was neutral. The prepared powder was heated at 120 °C for 3 hours. The phosphate-modified oil palm empty bunches are obtained by referring to P-OPEB bio-sorbent.
Bio-sorbent Characterization
The bio-sorbent characterization of OPEB was determined using an X-ray diffractometer (XRD) to observe the structure of the bio-sorbent, a Fourier Transform Infrared Spectrophotometer (FTIR) for functional group analysis, a Scanning Electron Microscope and Energy Dispersive X-ray (SEM-EDX) for morphological analysis, and Brunauer-Emmett-Teller (BET) for surface area determination.
Effect of Bio-sorbent Dosage on Fe(II) and Zn(II) Adsorption
Different quantities of the bio-sorbent, such as 0.5 g, 1 g, 2 g, 4 g, 6 g, and 8 g were prepared in separate containers and 15 ml of FeSO4 30 mg/L was added. The solution was allowed to stand for 45 minutes and stirred at 125 rpm. Then it was filtered and the filtrate was analyzed with AAS. The same method is used for ZnSO4 solution for Zn(II) adsorption.
Effect of Initial Concentration on Fe(II) and Zn(II) Adsorption
An optimum mass of the bio-sorbent was measured and 15 mL of FeSO4 solution was added to each beaker in varying concentrations of 10 mg/L, 20 mg/L, 30 mg/L, 40 mg/L and 50 mg/L. The solution was allowed to stand for 45 minutes and stirred at a speed of 125 rpm. It was filtered and the filtrate was analyzed using AAS. The same method is used for ZnSO4 solution for Zn(II) adsorption.
Isotherms Properties Studies
Isotherm properties were observed from the initial concentration-effect adsorption data to analyze the interaction between OPEB bio-sorbent and P-OPEB bio-sorbent with Fe(II) and Zn(II) ions. This equilibrium adsorption is then fitted into Langmuir as refer to Eq. (1) and Freundlich isotherms as Eq. (2) to observe the properties of the occurring adsorption.
The Langmuir isotherms equation is represented by :

The Freundlich isotherms equation is represented by :

Where qe represents the equilibrium metal ion adsorption (mg g-1), Ce represents the equilibrium concentration (mg L-1) and qm is the maximum adsorption amount of metal ions (mg g-1). KL, also known as Langmuir’s isotherm constant, is the energy of adsorption that is related to binding affinity and KF is the Freundlich isotherm constant to examine the process and the energy of adsorption.
Effect of Contact Time on Fe(II) and Zn(II) Adsorption
The biosorbent was weighed as the optimum mass and put into each glass beaker. Then, 15 mL of FeSO4 solution was added with the optimum concentration previously obtained. The solution was stirred using a stirrer at a speed of 125 rpm for various adsorption times of 15 min, 30 min, 45 min, 60 min, and 90 min. Then it was filtered and the filtrate was analyzed using AAS. The same method is used for ZnSO4 solution for Zn(II) adsorption.
Kinetics Properties Studies
Adsorption rate mechanisms between Fe(II) and Zn(II) with both biosorbents, OPEB and P-OPEB, were determined using pseudo first-order as shown as Eq. (3) and pseudo second-order kinetics models which manifested as Eq. (4)
Pseudo first-order is equation represented by :

Pseudo-second-order equation is represented by :

Where qe is the metal ions concentration (mg/g1) adsorbed at equilibrium and qt is the amount of metal ions adsorption at a specific time, t. k1 is the 1st-order rate constant (min-1) and k2 is the 2nd-order rate constant (g/mmol min).
Results and Discussion
SEM / EDX Characterization
The process illustrated in Fig.1 was carried out to compare changes in morphology in both bio-sorbents of oil palm empty-fruit bunches and an EDX analysis was conducted to ascertain the phosphate (P) that was introduced into the cellulose structure.. The morphology of the modified OPEB with phosphate (P-OPEB) was observed to be more homogeneous and denser than the initial OPEB. The presence of phosphate among the cellulose structures, in addition to expanding its surface, also makes the particle shape uniform in the bio-sorbent. It is supported by XRD analysis that phosphate presence in the cellulose structure initiates the polymer ordered structure of OPEB and begins to form a slightly crystalline structure.34,35 It is observed that in addition to C and O, which are the main constituents of OPEB, this raw OPEB bio-sorbent turned out to contain a lot of metal impurities, such as Mg, Ca, and Al, as well as several non-metallic elements like Si and P, which would be inducted into the OPEB cellulose structure.
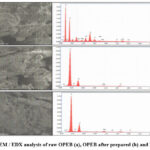 |
Figure 1: SEM / EDX analysis of raw OPEB (a), OPEB after prepared (b) and P-OPEB (c). |
The contaminant content in the initial OPEB may come from the use of fertilizers or pesticides in oil palm plantations. To obtain a bio-sorbent that is free of contaminants before phosphate was added, three-time washes with distilled water were used to complete the purification process. The phosphate anion was then tested qualitatively using HNO3 and ammonium molybdate reagents in the filtrate. It was discovered that there was a substantial amount of yellow precipitate in the first washing, indicating the presence of phosphate. There was a minor quantity of precipitate in the second washing, but none in the third filtrate, indicating that there was no phosphate content.
Table 1: Analysis of EDX Bio-sorbent of oil palm empty bunches.
|
Elements |
Prepared OPEB |
Washed OPEB |
P-OPEB |
|
C |
60.1 |
75.5 |
70.7 |
|
N |
5.3 |
5.2 |
5.3 |
|
O |
26.5 |
16.0 |
18.7 |
|
Mg |
0.4 |
1.0 |
0.6 |
|
Al |
0.6 |
0.0 |
0.7 |
|
Si |
4.5 |
2.3 |
3.1 |
|
P |
1.3 |
0.0 |
1.1 |
|
Ca |
1.4 |
0.0 |
0.0 |
|
M |
1.0 |
0.0 |
0.0 |
The prepared raw OPEB then analyzed again with EDX and showed that there was no longer any previous contaminant content. The inclusion of phosphate in the bio-sorbent after modification was observed from the increase in phosphate after modification compared to after washing, which no longer contained phosphate. The details of the EDX characterization of raw OPEB, after washing and after phosphate modification, are shown in Table 1.
XRD Characterization
The introduction of phosphate into the cellulose structure was also observed through changes in the XRD pattern (Fig. 2). All XRD patterns show that the bio-sorbent was formed as an amorphous adsorbent. The presence of metal contaminants in the raw OPEB was also observed in the XRD pattern where several sharp peaks appeared in the 2θ around the 20–40 region. Then these sharp peaks disappeared in the OPEB after washing, which also strongly supports the previous EDX data. OPEB, after being modified with phosphate, induced the presence of phosphate elements with the appearance of two sharp peaks in the 2θ region around the 60–65 region. The appearance of this sharp peak, in addition to indicating the entry of P elements, also indicates the slight formation of a crystallinity phase. The appearance of this crystal peak can also contribute towards increasing the adsorption capacity.21, 22
 |
Figure 2: XRD pattern of raw OPEB, OPEB after washed and modified OPEB / P-OPEB. |
FTIR Characterization
The FTIR spectra analysis showed several adsorptions, indicating the presence of several functional groups in the sample, including those belonging to the bio-sorbent or to functional groups originating from impurities that could not be cleaned completely (Fig. 3).
 |
Figure 3: FTIR spectra of raw OPEB and modified P-OPEB. |
The adsorption is considered to be associated with functional groups in the biosorption of oil palm empty bunches, appearing at wavenumbers 3374.16 cm-1 (OPEB) and 3332.15 cm-1 (P-OPEB), with a strong adsorption band of 3000 – 4000 cm-1, which is indicated as an -OH bond.35 Raw OPEB shows an adsorption wavenumber of 1055.36 cm-1 on the bio-sorbent OPEB and shifts to a wavenumber of 1034.34 cm-1 on the bio-sorbent P-OPEB, indicating the presence of a -CO group. FTIR results indicate that there is no significant change in the structure of OPEB after it was modified with phosphate. The binding of P with -OH groups between the cellulose structures was observed in the reduced -OH intensity observed in the FTIR image in the 3374.16 cm-1 regions (OPEB) and 3332.15 cm-1 in P-OPEB. Phosphate introduced continuously into each cellulose structure will initiate a new cellulose polymer with higher surface area. Based on the characterizations above, it proves that the process of inserting the phosphate into the cellulose structure includes the reaction scheme illustrated in Fig. 4.
 |
Figure 4: Phosphate Introduce Scheme in Cellulose Structure of OPEB. |
BET Characterization
The BET graph of both OPEB and P-OPEB shows type III (Fig. 5), which shows a weak interaction between the adsorbent and the adsorbate (Fig. 5). However, the P-OPEB bio-sorbent showed a higher adsorption, starting at p/po 0.3 until it reached a total nitrogen uptake of 22.63 cm3/g at p/po = 1, while the OPEB bio-sorbent was 15.51 cm3/g and the surface area of P-OPEB increased from 16.19 m2/g to 25.18 m2/g.
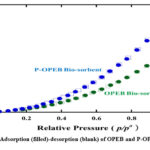 |
Figure 5: N2 Adsorption (filled)-desorption (blank) of OPEB and P-OPEB at 77K. Click here to View figure |
The surface area enhancement of P-OPEB bio-sorbent was triggered by the formation of a deeper pore volume than OPEB bio-sorbent. The inclusion of phosphate in the OPEB cellulose structure makes the pores deeper, with the volume increasing from 0.029 cm3 /g to 0.043 cm3/g. Surface area and pore size estimated by Barrett-Joyner-Halenda (BJH) plot analysis and pore volume by Dubinin–Radushkevich(DR) plot analysis of N2 adsorption isotherms at 77K. The summarized pore properties of these two bio-sorbents are presented in Table 2.
Table 2: Pore properties of OPEB and P-OPEB.
|
Characteristic |
OPEB Bio-sorbent |
P-OPEB Bio-sorbent |
|
Surface Area (m2/g) Pore Size (nm) Pore Volume (cm3/g) |
16.19 7.09 0.029 |
25.18 6.15 0.043 |
Adsorption Properties
Adsorption of the heavy metals Fe(II) and Zn(II) was used to examine the adsorption properties of OPEB and P-OPEB. Fig. 6 shows the adsorption performance with variations in adsorbent weight. Fe(II) was adsorbed optimally when the sample weight was 0.5 g for the two bio-sorbents, exhibiting a higher adsorption capacity of P-OPEB as compared to OPEB, at 1.88 mg/g and 3.23 mg/g, respectively. The increase in surface area in OPEB was able to increase the amount of Fe(II) adsorption in P-OPEB.
 |
Figure 6: Effect of adsorbent dosage of Fe(II) and Zn(II) adsorption on OPEB and P-OPEB bio-sorbent. |
Meanwhile, Zn(II) was adsorbed optimally when the weight of the OPEB bio-sorbent was 2 g, with an adsorption capacity of 1.14 mg/g; slightly lower than the adsorption of Fe(II) in OPEB. The Zn atomic is larger than Fe, so weak Zn interactions will require more adsorbent for optimum adsorption.8,14 However, by using the P-OPEB, the maximum adsorption of Zn(II) observed to be 4.53 mg/g with a P-OPEB weight of 0.5 g. This shows that the interaction of Zn(II) with P in P-OPEB is stronger than the interaction of Fe(II) with P in OPEB. The weak interaction of Fe and P was also observed in the utilization of these two elements in plant nutrients.17,23
Adsorption Isotherms Characteristics
The variation in the initial concentration of heavy metal solution showed the same phenomenon as the previous mass variation of the biosorbent (Fig-7a). Fe (II) is adsorbed more than Zn(II) by using OPEB, showing values of 2.48 mg/g and 1.59 mg/g, respectively. Meanwhile, using P-OPEB, Zn(II) is adsorbed more than Fe(II), which was 6.24 mg/g and 4.23 mg/g, respectively. The weak interaction between P and Fe is the probable reason behind this observation. However, due to smaller atomic size, Fe(II) can still be adsorbed at up to 50 mg/L, whereas Zn(II) is saturated at 40 mg/L. The increased surface area of P-OPEB also causes greater interactions between P in P-OPEB, as compared to OPEB.
 |
Figure 7: Effect of initial concentration of Fe(II) and Zn(II) adsorption on OPEB and P-OPEB. (a), Linearization of Langmuir isotherms adsorption . Click here to View figure |
The adsorption isotherms of Langmuir and Freundlich were utilized to explain the adsorption features of Fe(II) and Zn (II). The adsorption isotherms of OPEB bio-sorbent and P-OPEB bio-sorbent on Fe(II) and Zn(II) ions have a similar trend where the equilibrium adsorption tends to enhance the adsorption amount with increasing initial concentration. All adsorption processes are best fitted with the Langmuir model (Fig.-7b) compared to the Freundlich model (Fig.-7c). By using the correlation coefficient (R2) in Table 3, both Fe(II) and Zn(II) ions were adsorbed on both OPEB and P-OPEB bio-sorbents and fitted for the Langmuir plot. It assumes the formation of a monolayer on both the OPEB and P-OPEB bio-sorbent surfaces structurally, and no interaction among adsorbed ions. Zn(II) adsorption on P-OPEB bio-sorbent also fit better than Zn(II) adsorption on OPEB bio-sorbent based on the correlation coefficient (R2).
Table 3: Langmuir and Freundlich parameters for Fe(II) and Zn(II) ions adsorption on OPEB and P-OPEB bio-sorbent.
|
Bio-sorbent |
Heavy metal ions |
Langmuir parameters |
Freundlich parameters |
||||
|
qm (mg/g) |
KL |
R2 |
1/n |
KF |
R2 |
||
|
OPEB OPEB P-OPEB P-OPEB |
Fe(II) Zn(II) Fe(II) Zn(II) |
16.79 7.32 9.29 20.24 |
0.05 0.19 0.31 0.04 |
0.997 0.990 0.983 0.993 |
0.80 0.61 0.46 0.69 |
1.12 1.29 2.41 1.27 |
0.989 0.982 0.941 0.921 |
The structural homogeneity observed in the SEM images supports this phenomenon, where the presence of phosphate makes the monolayer adsorption on the surface of P-OPEB more optimal than that of OPEB. On the other hand, Fe(II) adsorption on OPEB fit better than Fe(II) adsorption on P-OPEB bio-sorbent. Because the Zn(II) ion is more stable than the Fe(II) ion, monolayer adsorption on a homogeneous surface is possible. Adsorption of Fe(II) disrupted the homogeneous structure of P-OPEB.36
Adsorption Kinetics Modelling
The optimum contact time was also determined to see the effectiveness of adsorption with both bio-sorbents (Fig.-8a). The adsorption results showed that Fe(II) and Zn(II) were adsorbed optimally after 75 min, with a large adsorption capacity of 2.81 mg/g and 2.67 mg/g, where Fe(II) has a smaller atomic size and was adsorbed more than Zn(II). On the other hand, using P-OPEB, the presence of P in P-OPEB also decreased Fe(II) adsorption by 4.23 mg/g, compared to Zn(II) by 6.79 mg/g. By using P-OPEB, the optimum adsorption of Zn(II) and Fe(II) ions is not only to a greater extent, but also faster, where Fe(II) is adsorbed optimally after 45 minutes and Zn(II) is adsorbed after 60 minutes. Because of the weak interaction between Fe and P, adsorption occurs faster, but at a lower rate than Zn(II), which has a stronger interaction with P.23
 |
Figure 8: Effect of contact time on Fe(II) and Zn(II) adsorption on OPEB and P- OPEB. (a), Linearized of pseudo 1st-order kinetics for adsorption of Fe(II) and Zn(II) onto OPEB and P-OPEB. Click here to View figure |
The adsorption kinetics model also observes the properties of all adsorption systems. To investigate the adsorption properties due to the OPEB bio-sorbent alteration, pseudo first-order and pseudo second-order kinetics were used. All kinetics models also show the same phenomena for all adsorption systems. Pseudo second-order (Fig. 8b) fit better than the pseudo first-order (Fig.-8c), which assumes that all adsorption systems refer to the second-order kinetics model. The correlation coefficient (R2) for all adsorption systems (Table 4) also supported it while R2 of pseudo second-order fit better than R2 of pseudo first-order. Table 4 also describes the differences in adsorption properties of Fe(II) and Zn(II) on modified OPEB. Despite the fact that both are second kinetic models, the adsorption of Zn(II) on P-OPEB fit better than the OPEB bio-sorbent. Meanwhile, Fe(II) adsorption on OPEB fit better than P-OPEB adsorption. This supports the previous reason, that the instability of Fe(II) metal makes the adsorption of bio-sorbents containing phosphate less than optimal.
Table 4: Kinetics parameters for Fe(II) and Zn(II) ions adsorption on OPEB and P-OPEB bio-sorbent.
|
Bio-sorbent |
Heavy metal ions |
Pseudo 1st order |
Pseudo 2nd order |
|||
|
k1 x 10-4 (min-1) |
R2 |
k1 x 10-3 (g/mmol min) |
R2 |
|||
|
OPEB OPEB P-OPEB P-OPEB |
Fe(II) Zn(II) Fe(II) Zn(II) |
2.45 0.26 1.44 2.84 |
0.868 0.803 0.812 0.854 |
4.91 4.03 5.14 6.85 |
0.972 0.989 0.936 0.998 |
|
Conclusion
The addition of phosphate elements into the cellulose structure of OPEB is a new strategy to expand the surface of this bio-sorbent and increase its adsorption ability against heavy metals. With a P-OPEB weight of 0.5 g, an initial concentration of 40 mg/L, and an optimum adsorption of 6.79 mg/g for 60 minutes, Zn(II) has an optimum adsorption of 6.79 mg/g for 60 minutes. Meanwhile, Fe(II) absorbs optimally at 4.23 mg/g at 0.5 g by weight of bio-sorbent. The initial concentration is 50 mg/L-1 and the adsorption time is 45 minutes. Besides being able to increase the adsorption capacity of heavy metals, P-OPEB also makes the adsorption process faster so that the utilization of OPEB solid waste can be more effective as a smart bio-sorbent to remove Fe and Zn metal contaminants in palm oil processing liquid waste. The properties of all adsorption systems are similar, while adsorption isotherms refer to the Langmuir model and kinetics model, second-order kinetics model. According to the correlation coefficient (R2), Zn(II) adsorption fit better on P-OPEB bio-sorbent than Fe(II) adsorption on OPEB bio-sorbent.
Acknowledgement
The research work was financially fully supported by the Universitas Negeri Medan Non-Tax Revenue Fund (PNBP) funding with a reference number is 0063/UN33.8/PL-PNBP/2021. The authors acknowledge to Research and Community Service Centre (LPPM) of Universitas Negeri Medan, Chemistry and Physics Laboratory of Faculty Mathematics and Natural Science of Universitas Negeri Medan.
Conflict of Interest
The authors declare that we do not have any conflicting interest.
References
- Mohamed, R.R.; Nurul, E.R.; Wan, Z.N.Y. Eng. Trans., 2019, 72, 175-180. doi : 10.3303/CET1972030
- Nwabanne, J.T.; Igbokwe, P.K. J Eng. and Appl. Sci., 2018, 3(11), 825-834. doi : https://medwelljournals.com/abstract/?doi=jeasci.2008.829.834
- Blais, J.F.; Dufresne, B.; Mercier, G. Constr. Build. Mater. 2010, 21, 2059-2065. doi : http://dx.doi.org/10.1016%2Fj.conbuildmat.2006.05.05
- Alau, K.K.; Gimba, C.E.; Kagbu, J.A.; Nale, B.Y. Arch. of Appl. Sci. Res., 2010, 2(5), 451-455.
- Barakat, M.A.; Schmidt, E. Desalination, 2010, 256, 90–93. doi : 10.1016/j.desal.2010.02.008.
CrossRef - Fo, K.Y.; Hameed, B.H. Elsevier, 2009, 13, 2495-2504. doi : 10.1016/j.rser.2009.06.009.
CrossRef - Kuswaha, S.; Sudhakar, P.P. J. Environ. Radioact., 2013, 126, 115-124. doi : 10.1016/j.jenvrad.2013.07.021
CrossRef - Mutasim H.E.; Rashida M.H.; Sumia, A. N.; Mawia, H. E. Am. J. of Phys. Chem., 2013, 6(2), 59-69. doi: 10.11648/j.ajpc.20170604.12
CrossRef - Siti, N.M.Y.; Azlan, K.; Wiwid, P.P.; Che, F.I.; Azmi, M.; Norhayati, H.; Illyas, M.I. J. of Environ. Prot. 2014, 5, 289-300. doi : 10.4236/jep.2014.54032.
- Ayucitra, A.; Gunarto, C.; Kurniawan, V.; Hartono, SB. Chem. Eng. Trans., 2017, 56, 1441-1446. doi : 10.3303/CET1756241.
- Hafni, I.N.; Jasmidi; Marini, D.; Siti, R.; Wasis, W.W.B.; Rendra, E.; Moondra, Z. Poll Res., 2021, 40(1), 1-7. doi : http://www.envirobiotechjournals.com/PR/v40i121/Poll%20Res-1.pdf
- Ili, S.J.; Nor, A.Y.; Md, J.H.; Siti M.M.N. Molecules, 2013, 18, 8461-8472. doi : 10.3390/polym5031056
CrossRef - Barakat, M.A. Arabian J. Chem., 2011, 4(4), 361-377. doi : 10.1016/j.arabjc.2010.07.019
CrossRef - Salamatania, B.; Kamaruddin, A.H.; Abdullah. J. of Appl. Sci., 2007, 7(15), 2020-2027. doi : 10.3923/jas.2007.2020.2027
- Janice, M.L.T.; Noumie, S.; Harry, L.H.C. Trans. on Sci. and Tech., 2019, 6(1), 9-26. doi : http://tost.unise.org/pdfs/vol6/no1/6x1x9-26.pdf
- Abdullah, N.; Sulaiman, F. J. of Phys. Sci., 2013, 24(2), 117–137. doi : 10.21894/jopr.2017.000
- Abu, B.R.; Darus, S.Z.; Kulaseharan, S.; Jamaluddin, N. Nutr. in Agr., 2011, 89, 341–349. doi : 10.1007/s10705-010-9398-9
CrossRef - Ahmad, M.I.; Rizman, Z.I.; Rasat, M.S.M.; Alauddin, Z.A.Z.; Soid, S.N.M.; Aziz, M.S.A.; Mohamed, M., Amini M.H.M.; Amin M.F.M. J. of Fundam. and Appl. Sci., 2018, 9, 924 – 940. doi : 10.4314/jfas.v9i3s.67
CrossRef - Alam, M.Z.; Ameem, E.S.; Muyibi, S.A.; Kabbashi, NA. Chem. Eng. J., 2009, 155, 191–198. doi : 10.1016/j.cej.2009.07.033
CrossRef - Alam, M.Z.; Muyibi, S.A.; Mansor, M.F.; Wahid, R. J. of Environ. Sci., 2007, 19, 103–108. doi : 10.1016/s1001-0742(07)60017-5
CrossRef - Moondra, Z.; Zainuddin, M.; Ricky, A.S.; Teguh, F.S.; Hafni, I.N.; Rizka, F.L.; Lailatul, F.; Kurnia, S. IOP Conf. Series: J. of Physics: Conf. Series, 2021, 1819, 1-6. doi : 10.1088/1742-6596/1819/1/012020
- Jasmidi; Sri, A.S.; Rini, S.; Siti, R.; Hafni, I.N.; Moondra, Z.; Lelita, R.B.; Yuda, D.E. IOP Conf. Series: J. of Physics: Conf. Series, 2021,1819, 1-6. doi : 10.1088/1742-6596/1819/1/012021
CrossRef - Vandna R.; Raghavendrarao, S.; Bhaskaran, S.; Sandeep, Y.; Ananda, K.S.; Prem, K.D.; Ajay ,J. Cell. Physiol., 2015, 56(6), 1107–1123. doi ; 10.1093/pcp/pcv035
CrossRef - Josiane, P., Marcela F.S.; Marcelo F.V.; Rosângela, B.; Angélica, M.; Salcedo, V. Mater. Res., 2018, 21(1), 1-11. doi : 10.1590/1980-5373-MR-2016-0460
- Athanasia, A.S.; Annisa, R.; Ajeng, A.S.; Yulianti, S.; Gita, N.A.; Sudiyarmantoa; Dewi, S. Carbohydr. Polym., 2020, 229, 115433. doi : 10.1016/j.carbpol.2019.115433
CrossRef - Coral, M.J.D.; Woiciechowski, A.; Filho, A.Z.; Noseda, M.D.; Kaur, B.S.; Soccol, C.R. Bioresour. Technol., 2015, 194, 172–178. doi : 10.1016/j.biortech.2015.07.018
CrossRef - Daneshfozoun, S.; Abdullah, B.; Abdullah, M.A. Appl. Mech. and Mater., 2014, 625, 889 – 892. doi ; 10.4028/www.scientific.net/AMM.625.889
CrossRef - Moondra, Z.; Zainuddin, M.; Hafni, I.N.; Ricky, A.S.; Wasis, W.W.B. Poll Res., 2020, 39(2), 245-250. doi : http://www.envirobiotechjournals.com/PR/v29i220/Poll%20Res-16.pdf
- Daneshfozoun, S.; Nazir, M.S.; Abdullah, B.; Abdullah, MA. Chem. Eng. Trans., 2014, 37, 679–682. doi : 10.3303/CET1437114
- Ibrahim, M.N.M.; Ngah, W.S.W.; Norliyana, M.S.; Daud, W.R.W. Clean – Soil, Air, Water, 2009, 37(1), 80–85. doi : 10.1002/clen.200800187
CrossRef - Idris, S.S.; Rahman, N.A.; Ismail, K.; Alias, A.B.; Rashid, Z.A.; Aris, M.J. Bioresour. Technol, 2010, 101, 4584–4592. doi : 10.1016/j.biortech.2010.01.059
CrossRef - Jamari, S.S.; Howse, J.R. Biomass and Bioenergy, 2012, 47, 82–90. doi : 10.1016/j.biombioe.2012.09.061
CrossRef - Johari, I.S.; Yusof, N.A.; Haron, M.J.; Mohd, N.S.M. Polymers, 2013, 5(3),1056–1067. doi : 10.3390/molecules18078461
CrossRef - Ibrahim, M.N.M.; Ngah, W.S.W.; Norliyana, M.S.; Daud, W.R.W.; Rafatullah, M.; Sulaiman, O.; Hashim, R. J. of Hazard. Mater., 2010, 182(1-3), 377–385. doi : 10.1016/j.jhazmat.2010.06.044
CrossRef - Hidayu, A.R.; Mohamad, N.F.; Matali, S.; Shaifah, A.S.A.K. Procedia Eng., 2013, 68, 379–384. doi : 10.1016/j.proeng.2013.12.195
CrossRef

This work is licensed under a Creative Commons Attribution 4.0 International License.
About The Author
![]()
A New Edition of Web of Science
Journal Impact Factor
2022: 0.5
Five Year: 0.8
Journal is Indexed in

Cabells Whitelist
![]()


