Therapeutic Drug Naproxen Pollution Removal by the Acid Digested Carbon of Waste Leathers
K. Veeravelan1 , S. Arivoli1* and J. Samu Solomon2
1Department of Chemistry, Poompuhar College, (Affiliated to Bharathidasan University), Melaiyur-609 107, Tamil Nadu, India.
2Department of Chemistry, T.B.M.L College, (Affiliated to Bharathidasan University), Porayar -609 307, Tamilnadu, India.
Corresponding Author E-mail: shashikaperera20@gmail.com
DOI : http://dx.doi.org/10.13005/ojc/380518
Article Received on : 16 Sep 2022
Article Accepted on :
Article Published : 20 Oct 2022
Reviewed by: Dr. Mervette El Batouti
Second Review by: Dr. Robert Mbedzi
Final Approval by: Dr. Ioana Stanciu
The adsorption characteristics study on the removal of therapeutic drug naproxen on the acid digested carbon of waste leather were analysed by varying the physico-chemical conditions. Effect of particle size, adsorbent dosage, pH, temperature, initial concentration of adsorbate and contact time were analysed carefully by batch mode. The minimum particle size gives maximum number of surface area and adsorbed more, 90.89% for 0-63 micron. Acidic pH ranges were desirable for the adsorption of naproxen on this Acid digested carbon of waste Leather (ADCL). But different adsorbates preferred different acidic pH ranges of pH from 1 – 6. Above pH 6 precipitations of drugs takes place. In this case at pH 1, 96.87% of adsorption takes place. The percentage of adsorption of naproxen is directly proportional to the adsorbent dosage and contact time and inversely proportional to the initial concentration of the adsorbate were found out from this study. Order of this adsorption is pseudo second order kinetics and it belongs to the physisorption, because of no chemical bond formation between the adsorbent and adsorbate. The fruendlich and Langmuir isotherm model is fit for these studies. The thermodynamic study reveals the negative ∆Go, positive ∆Ho and ∆So values concluded that this adsorption is spontaneous, feasible and physical in nature respectively. The spectral evidence from the FT-IR, SEM and XRD are in favour of above experimental results.
KEYWORDS:Adsorption; Isotherm; Kinetics; Spectrum; Therapeutic drugs; Thermodynamics
Download this article as:| Copy the following to cite this article: Veeravelan K, Arivoli S, Solomon J. S. Therapeutic Drug Naproxen Pollution Removal by the Acid Digested Carbon of Waste Leathers. Orient J Chem 2022;38(5). |
| Copy the following to cite this URL: Veeravelan K, Arivoli S, Solomon J. S. Therapeutic Drug Naproxen Pollution Removal by the Acid Digested Carbon of Waste Leathers. Orient J Chem 2022;38(5). Available from: https://bit.ly/3ScvfG5 |
Introduction
A growing number of studies are focusing on how pharmaceuticals can harm the environment and how to prevent against their impacts. Drugs are present in raw and processed effluent, surface water, groundwater, and even drinking water around the world due to the high drug consumption1. Despite the fact that this issue has been addressed for a long time, no regulatory guidelines or standards for the allowable levels of pharmaceuticals in raw sewage discharged from wastewater treatment facilities and subsequently released into ecosystems exist at this time. Beta-blockers, non-steroidal anti-inflammatory medicines, antibiotics, female sex hormones, lipid metabolism regulators, and antiepileptic drugs are the most frequently found pharmaceuticals in aquatic environments2. Atenolol, bezafibrate, ciprofloxacin, diclofenac, erythromycin, gemfibrozil, ibuprofen, carbam- azepine, naproxen, and sulfamethoxazole are among the substances that, 3. deserve special attention because they are highly toxic to living things, persist in the environment for long periods of time, and are According to their hypothesis, these compounds need to be monitored initially4. In both human and veterinary medicine, naproxen is frequently used as an analgesic, anti-inflammatory, and antipyretic drug. Despite the absence of monitoring for this substance, it was discovered in the surface waters of many nations, including Poland (300 ngL-1) 1. Because naproxen was not completely removed from typical wastewater treatment plants, it is now present in surface water2.
This study sought to determine whether commercial carbon sorbents might be used to extract naproxen sodium from water, examine the kinetics and statics of adsorption, and assess the impact of process parameters on process effectiveness 3.
Materials and Methods
Adsorption Experiments
The studies were conducted at 30°C, with 0.1M HCl and 0.1M NaOH used to change the acidic and basic properties of the solution. The adsorbent and adsorbates were allowed to come into contact with each other for a set amount of time to allow for adsorption, and the amounts of adsorbent and adsorbates were recorded. For this experiment, a 100ml stopper bottle was used, and the mixture was agitated for 180 minutes with a mechanical shaker set to the right rpm (100-300). It is filtered after the equilibrium with watt man 40 filter paper and filtered. A UV-spectro photometer set to a suitable filter range was used to check the drug adsorbent solution Con. in the filtrate. The experiment was performed with the physical and chemical parameters changed, and the adsorbate volume was 50ml.
Adsorption(%) = (Co –Ce) × 100/ Co —————————-(1)
Where Co is the IC is initial Con. and Ce is the Con. of the drug adsorbate at equilibrium.
Effect of adsorbent dosage
The effect of effect of adsorbent dosage was investigated using adsorbent ranging from 50 to 250 mg in a 50 cm3 drug adsorbate solution (50 mg dm-3). The percentage of adsorption in each case was calculated while keeping all other variables constant. The top-quality value for adsorbent dosage was determined as a result of this, and it was used in all batch experiments.
Effect of pH
The effect of pH on drug adsorbate adsorption on the adsorbent was investigated by equilibrating 50 cm3 of drug adsorbate solution (50mgdm-3) at pH values ranging from 1 to 6, while keeping all other variables constant. The ideal pH was then determined and used in all subsequent adsorption trials. Using a digital pH metre, the pH of the samples was determined. 4 and 9.2 buffers were employed to calibrate the pH metre.
Effect of initial concentration
At room temperature (300C), the adsorption studies were done in a batch approach. A known weight of adsorbent fabric was added to 50ml of drug adsorbate solution with an IC of 10 mgL-1 to 60 mgL-1 while all other factors were kept constant. After equilibrium was determined, the percentage of adsorption for each value of preliminary concentration was determined.
Effect of contact time
The effect of contact time between the adsorbent and the adsorbate was determined by conducting the experiment at different contact times ranging from 30 to 180 minutes, while keeping particle size, preliminary Con., AD, pH, and temperature constant. Each experiment was repeated three times to increase the accuracy of the data, and average results were utilised to generate the graphs.
Effect of temperature
The adsorption studies were carried out in a thermostat shaker (Remi, India) at four distinct temperatures, namely 30, 40, 50, and 60oC, while keeping all other variables constant. Temperature fidelity was previously maintained with an accuracy of 0.5oC.
Effect of particle size
For checking the most adsorption of drug adsorbate, the impact of adsorbent size of particle measurement was tested in the range of 0-200μ microns particle dimension (0-63μ, 63-125μ, 125-200μ).
Result and Discussion
Adsorption of Naproxen
Effect of particle Size
In this study, particles with diameters ranging from 0-63 microns to 125-200 microns were employed. Greater amounts of naproxen were reported to have been adsorbed by adsorbent particles with surface areas 0-63 micron compared to those with surface areas 63-125 and 125-200 micron. Accordingly, the adsorption capacity increases as surface area increases and decreases as surface area decreases. The results are given in Fig. 1 and Table 1. Once more, it was discovered that the smaller particles had higher adsorption capacities than the larger, equivalent ADCL particles of the same weight. This was due to the different porosities of the adsorbents4.
 |
Figure 1 Click here to View figure |
Effect of pH
Naproxen does not significantly depend on neutral or alkaline pH for adsorption on these ADCLs. According to the results discussed above, interactions between the aromatic rings of naproxen and the aromatic rings of ADCL as well as the formation of hydrogen bridges between naproxen and the superficial groups of the ADCL allow for the retention of naproxen on the carbon. The process of adsorption heavily relies on the adsorption of organic contaminants on ADCL, hydrogen bonds, Van der Waals forces, and donor-acceptor interactions. In light of the findings previously revealed, it was chosen to test the ADCL made from ADCL at a pH of 1.0, indicating that the study was conducted on naproxen in its neutral form. As shown in Fig. 2, the pH of the solution has a significant impact on the absorption and percentage elimination of naproxen from the aqueous solution. The absorption of naproxen increases from 33.33% to 96.87% when the pH rises from pH 1 to pH:6. Table.2. At pH 1, the ability for naproxen sorption to increase noticeably to 96.87%5.
 |
Figure 2 Click here to View figure |
Adsorption dosage
It was clear that the absorption of naproxen rises from 68.44% with 50 mg of adsorbent to 90.99% with 200 mg of adsorbent. Prior to that, it is evident that as the adsorbent dose rises from 50 mg to 200 mg, the percentage of removal of naproxen increases. This is likely because there are fewer adsorbing species available for a proportionally greater number of surface sites on the adsorbent at higher dosages of adsorbent. It makes sense that there would be more exchangeable Naproxen sites available at higher adsorbent dosages. The dense outer layer of the cells may screen out the high adsorbent dosage, protecting the binding sites from metal. At the ideal pH of 1.0 and at room temperature (30°C), the role of adsorbent mass in the adsorption of naproxen was examined. The mixture of 50mg of the adsorbent and 50ml of a Naproxen solution with an initial concentration of 10mgL-1 was shaken for 180 minutes. After centrifugation, a quantitative estimation of the Naproxen concentration in the supernatant was made Table 3 & Figure 36.
 |
Figure 3 Click here to View figure |
Initial concentration
Figure 4 demonstrates that when the drug concentration rises from 10 to 60mgL-1, the adsorption capacity falls from 93.44% to 82.02%. The pattern is due to a steady decline in the electrostatic interaction between naproxen and the active sites of the absorbent. Additionally, this can be explained by the fact that when the Naproxen concentration dropped, fewer adsorption sites were covered. Additionally, lower initial Naproxen concentrations result in a greater affinity of Naproxen for the active sites. Because there are fewer surface sites on the adsorbent available for a comparatively higher number of adsorbing species at lower concentrations, the adsorption capacity is declining. Table 4 and Figure 4 display the experimental findings of Naproxen adsorption on ADCL at varied starting concentrations. It demonstrates that when the concentration of naproxen increased, the actual amount of naproxen absorbed per unit mass of ADCL dropped. This outcome suggests using the Langmuir isotherm model and is in favour of merely monolayer coverage7.
 |
Figure 4 Click here to View figure |
Effect of Contact Time
Efficiency first increased from 59.11% to 85.61%, and then there was no change when the adsorption time was altered from 30 to 180 minutes. The adsorbent’s surface covering increases over time and additional adsorption is not observed. Table 5 and picture 5 indicate the impact of contact time on Naproxen’s ability to bind to ADCL. 5.2.5. Adsorption rises as contact duration rises and reaches a high of 85.61% at 3 hours. The smooth and continuous Naproxen to saturation curve shown in Figure 5 suggests that Naproxen may be covered in a monolayer on ADCL. The effectiveness of ADCL as an adsorbent is demonstrated by the nearly 59.11% adsorption that has occurred during 30 minutes of contact time with the substance. For balance to be reached, more time is needed8.
 |
Figure 5 Click here to View figure |
Effect of Temperature
As a function of temperature, between 30 and 60 degrees Celsius, the percentage of naproxen adsorption was investigated. It was found that temperature increase causes an increase in adsorption yield. For a 50 ppm starting concentration of naproxen solution, the lowest and maximum rates of adsorption were 80.31 percent at 30°C and 86.33 percent at 60°C, respectively. Figure 6 and table 6 illustrate how temperature affects the fraction of Naproxen that binds to ADCL. This is expected given that a rise in temperature supplies the required energy for the endothermic process of adsorption, increasing the pace of the process. The important thing to understand is that enough adsorption more than 80.31% has already occurred at ambient temperature. This further supports the effectiveness of the adsorbent in removing naproxen9.
 |
Figure 6 Click here to View figure |
Kinetic Study
Understanding the adsorption rate and the process’s regulating mechanism is possible thanks to adsorption kinetics investigations. The pseudo-first-order and pseudo-second-order kinetics models were put to the test on the experimental data in order to clarify the adsorption kinetics of naproxen ion by produced adsorbent. Equations represent the pseudo-first-order and pseudo-second-order kinetic models in their nonlinear forms.
pseudo-first-order : log (qe-qt) = log qe – k1t/2.303 ——————–(2)
pseudo-second-order : t/qt = 1/k2.qe2 + t/qe ———————————(3)
For the adsorption of naproxen onto produced adsorbent, nonlinear models of pseudo-first-order and pseudo-second-order kinetics were presented in table 7 and figure 7, respectively. The pseudo first-order kinetic model is ineffective for simulating naproxen adsorption onto prepared adsorbent, as shown by a comparison of the R2 and adsorption capacity values predicted in table 7, Fig. 7. The results clearly show that the experimental data are more closely correlated with the pseudo-second-order kinetic model (R2 > 0.9). According to this kinetic model, the physisorption mechanism regulates the metal ion adsorption process10.
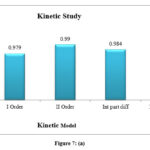 |
Figure 7: (a) Click here to View figure |
 |
Figure 7: (b) Click here to View figure |
Table 7: and Figure 7: (a,b) Kinetic parameters for the adsorption of Naproxen
|
I Order |
K1 |
0.004606 |
qe |
1.287883 |
R2 |
0.979 |
|
II Order |
qe |
3.144654 |
K2 |
0.013302 |
R2 |
0.99 |
|
Int part diff |
Kp |
0.109 |
c |
1.366 |
R2 |
0.984 |
|
Elovich model |
β |
0.477 |
α |
0.297 |
R2 |
0.944 |
Isothermal Study
Isotherm parameters were calculated from the equations’ linear plots, which are shown in Table 8 and Fig. 8a & b. The Langmuir isotherm’s sorption equilibrium constant KL value, 3.2584 mg L-1, showed the biosorbent’s strong capacity for adsorbing naproxen. The fact that the values of the dimensionless separation factor (RL) are less than one is more evidence for this. The Langmuir isotherm is a reliable explanation for the adsorption of naproxen, according to the R2 (correlation coefficient) value of 0.985. The Freundlich isotherm can be used to explain the experimental results because its computed R2 value, which was found to be 0.94, is 0.94. Inferred from the Freundlich isotherm, the ultimate adsorption capacity (KF) value was 2.985111. The values of the Freundlich constant (n) are substantially higher than one, suggesting that the only factor controlling the adsorption process is physisorption. The experimental results may be explained by the Redlich-peterson isotherm, according to the R2 value that was determined for the isotherm, which was found to be 0.824. According to this isotherm’s calculations, the value was 0.234. It was decided to use the Dubinin-Kaganer-Radushkevich (DKR) model to explain the single-solute adsorption isotherms. The experimental results cannot be satisfactorily explained by the DKR isotherm, as shown by the R2 value determined for the DKR isotherm, which was found to be 0.94. According to this isotherm’s calculations, the value was 0.9674.A measurement of the desorption constant is found in the values of the desorption constant, (β), in the Redlich-Peterson and Dubinin-Kaganer-Radushkevich isotherms. When its values are smaller than 1, it means that adsorption is favourably impacted. In the DKR isotherm, the sorption energy is a useful measure for differentiating between physisorption and chemisorption. Lower values imply greater physisorption12.
 |
Figure 8: (a) Click here to View figure |
 |
Figure 8: (b) Click here to View figure |
Table 8: and Figure 8: (a,b). Isothermal parameters for the adsorption of Naproxen
|
L Isotherm |
KL |
q0 |
bL |
R2 |
|
4.06504 |
24.3902 |
0.16667 |
0.928 |
|
|
F Isotherm |
KF |
n |
– |
R2 |
|
3.91742 |
1.68634 |
– |
0.997 |
|
|
DKR |
β |
b |
q0 |
R2 |
|
2.13488 |
1.16 |
14.4544 |
0.97 |
|
|
RP |
β |
bR |
KR |
R2 |
|
0.136 |
7.35294 |
1.80147 |
0.975 |
Thermodynamic Study
The thermodynamic parameters for the adsorption of naproxen onto ADCL generated from ADCL at 30, 40, 50, and 60oC are shown in Table 9a. Since ∆Go was negative, the adsorption process was feasible and spontaneous. Additionally, none of the ∆Go values were greater than 20 kJ/mol, which would suggest that Naproxen was adsorbed onto ADCL physically. The results are consistent with the trend in which the adsorption capacity increased with increasing temperature because the enthalpy value ∆Ho was also positive, indicating that the adsorption process was endothermic. The study’s enthalpy is measured in absolute terms and falls within the 2-40 kJ/mol range for the adsorption enthalpy due to hydrogen-bonding interactions. This is mostly because the hydrogen atoms in the hydroxyl groups of ADCL create hydrogen bonds with the nitrogen atoms of naproxen, which act as hydrogen-bond acceptors. The increased randomness or disorder at the solid-liquid interface during the adsorption process was suggested by the positive ∆So for naproxen adsorption on ADCL. The findings suggest that the adsorption mechanism may involve water desorption before Naproxen is adsorbed. Naproxen’s molecular volume is significantly greater than that of water; so much more water must be desorbed in order for the same amount of Naproxen to be adsorbed13. The Arrhenius equation,
log k = log A – (Ea / 2.303RT) ————————– (4)
which was used to compute the activation energies for Naproxen’s adsorption on the adsorbent, is displayed in Fig. 9a and listed in table 9b. The activation energy found in this instance suggests that the sorption mechanism and feasibility of sorption are influenced by physical factors14.
 |
Figure 9: (a). Thermodynamic plot |
 |
Figure 9: (b). Arrhenius plot |
Table 9: (a,b) and Figure 9: (a,b). Thermodynamic parameters for the adsorption of Naproxen
|
NAPROXEN |
||||
|
∆G0 |
∆H0 |
∆S0 |
Log 10 Ka |
1/T |
|
-774.19 |
22.9766 |
59.3561 |
0.1334 |
0.0033 |
|
-1130.1 |
0.18852 |
0.00319 |
||
|
-1850.4 |
0.29911 |
0.00309 |
||
|
-2061.7 |
0.32327 |
0.003 |
||
Table 9: (b).
|
NAPROXEN |
||
|
Ea |
Log A |
R2 |
|
13.1809 |
2.402 |
0.975 |
FT-IR Study
In the pictures, FT-IR (NICOLET iS50, Thermo Scientific, USA) spectra of ADCL samples before and after adsorptions are displayed. Figure 10 a&b correspondingly50. The existence of surface groups on the adsorbent’s surface is demonstrated by the spectra. The peak intensities between them show notable variations. Nearly all of the absorption bands have distinct changes in intensity between the carbons, which is indicative of how differently dense the respective functional groups are. Following adsorption, a few peaks disappear due to desorption into the adsorbate, while a few others have their wave numbers slightly altered upward or downward by electrostatic forces. After adsorption proved the absence of the production of new compounds, there are no new peaks. The adsorption frequencies are nearly identical, as seen in the figures, and it is assumed that they had little impact on the functional groups, supporting the idea that solely physisorption had occurred. Following adsorption, a few peaks disappear due to desorption into the adsorbate, while a few others have their wave numbers slightly altered upward or downward by electrostatic forces. The adsorption frequencies are nearly identical, as seen in the figures, and it is assumed that they had little impact on the functional groups, supporting the idea that solely physisorption had occurred15.
 |
Figures 10: (a,b) FT-IR spectrum of ADCL |
XRD
The Rigaku Corporation, Japan X-ray Diffractometer 40KV / 30mA, Model XRD 6000 SHIMADZU was used to conduct the X-ray Diffraction Studies. Figures 11(a) and 11(b) show the diffraction patterns of the adsorbent ADCL before and after Naproxen adsorption. The figures clearly show that there is no discernible difference between the adsorbent’s spectra before and after adsorption. This might be because adsorption doesn’t change the chemical composition of the surface of the adsorbent, or less. Weak Van der Waals forces control the adsorption, which is a physical process16.
 |
Figure 11: (a,b) XRD pattern of ADCL |
SEM
The uneven surface and high porosity of the ADCL derived ADCL are depicted in the SEM micrograph in figures 12a and 12b. These carbonaceous materials often have huge macropores that allow adsorbates to pass through and into the microporous system. Scanning Electron Microscopy (SEM) was used to analyse the surface morphology of ADCL before and after adsorption. The corresponding SEM micrographs were captured using a JEOL JSM 6390 at a 20kV accelerating voltage and are shown in figures 12a and 12b. The ADCL particles displayed rough patches of surface with readily discernible micropores at such magnification. Because the majority of the minerals in biomass are not lost during the pyrolysis process and remain on the ADCL structure, this metallic element was not evenly distributed across the surface of the carbon17.
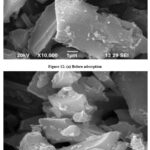 |
Figures 12: SEM micrograph of ADCL |
Conclusion
The adsorption characteristics studies on the removal of therapeutic drug ibuprofen on the acid digested carbon of waste leather were analysed by varying the physico-chemical conditions. The minimum particle size gives maximum number of surface area and adsorbed more, 90.89% for 0-63 micron. Acid pH ranges were desirable for the adsorption of Naproxen on this ADCL. But different adsorbate preferred different acidic pH range of pH from 1 – 6. In the basic pH range the adsorption is very pure due to the formation of the hydroxide precipitate. In this case at pH 1, 96.87% of adsorption takes place. The percentage of adsorption of Naproxen is directly proportional to the adsorbent dosage and contact time and inversely proportional to the initial concentration of the adsorbate. Were found out from this study. Order of this adsorption is pseudo second order kinetics and it belongs to the physisorption, because of no chemical bond formation between the adsorbend and adsorbate. The fruendlich and Langmuir isotherm model is fit for these studies. The thermodynamic study reveals the negative ∆Go and positive ∆Ho and ∆So values concluded that this adsorption is spontaneous, seasible and physical in nature respectively. The spectral evidence from the FT-IR, SEM and XRD are in fovour of above experimental results and provided the strong applications on the removal of Naproxen therapeutic drug pollution from the water bodies as well as from the industrial effluence. This is an economically cheapest and eco friendly method for the treatment of water pollution.
Acknowledgement
I am very gratitude to the principal and staff members PG and Research Department of Chemistry at Poompuhar College, Melaiyur, Tamil Nadu, India, for permitting me to conduct the experimental part in the chemistry laboratory.
Conflict of Interest
There is no conflict of interest.
References
- Cuerda-Correa E.M.; Domínguez-Vargas J.R.; Olivares-Marínb F.J.; Beltrán de Heredia J.; On the use of carbon blacks as potential low-cost adsorbents for the removal of non-steroidal anti- inflammatory drugs from river water. Journal of Hazardous Materials, 2010, 177, 1046–1053.
- Yuchen Tian,; Anggrek C.; Nusantara,; Thamir Hamoh,; Aldona Mzyk,; Xiaobo Tian,; Felipe Perona Martinez,; Runrun Li,; Hjalmar P.; Permentier, Romana Schirhagl.; Functionalized Fluorescent Nanodiamonds for Simultaneous Drug Delivery and Quantum Sensing in HeLa Cells.2022, 14 (34) , 39265-39273.
- Płaziński W.; Rudziński W.; Adsorption Kinet- ics at solid/solution interfaces the meaning of the pseudo-first- and pseudo-second-order equations. Wiad. Chem., 2011, 65, 1055–1067.
- Prajesh Adhikari,; Pallav K.; Jani,; Lilian C.; Hsiao,; Orlando J.; Rojas,; Saad A.; Khan.; Interfacial Contributions in Nanodiamond-Reinforced Polymeric Fibers. 2021, 125 (36) , 10312-10323.
- Onal Y.; Akmil-Baser C.; Sarici-Ozdemir C.; Elucidation of the naproxen sodium adsorption onto activated carbon prepared from waste apricot: ki- netic, equilibrium and thermodynamic characteriza- tion. J. Hazard. Mater., 2007, 148, 727-734.
- Patrolecco L.; Silvio Capri S.; Ademollo N.; Occurrence of selected pharmaceuticals in the prin- cipal sewage treatment plants in Rome (Italy) and in the receiving surface waters. Environ. Sci. Pollut. Res., 2015, 22, 5864–5876.
- Paul S.C.; Githinji L.J.M.; Ankumah R.O.; Willian K.R.; Pritchett G.; Sorption Behavior of Ibu- profen and Naproxen in Simulated Domestic Waste- water. Water Air Soil Pollut., 2014, 38, 225, 1821.
- Cuerda-Correa E.M.; Domínguez-Vargas J.R.; Olivares-Marínb F.J.; Beltrán de Heredia J.; On the use of carbon blacks as potential low-cost adsorbents for the removal of non-steroidal anti- inflammatory drugs from river water. Journal of Hazardous Materials, 2010, 177, 1046–1053.
- Kosaku Yano,; Tomohiro Matsumoto,; Yutaka Okamoto,; Kenta Bito,; Naruki Kurokawa,; Terumitsu Hasebe,; Atsushi Hotta.; Gadolinium-Complexed Carboxylated Nanodiamond Particles for Magnetic Resonance Imaging of the Lymphatic System. 2021, 4 (2) , 1702-1711.
- Sarici-Ozdemir C.; Onal Y.; Study to investigate the importance of mass transfer of naproxen sodium onto activated carbon. Chemical Engineering and Processing, 2010, 49, 1058-1065.
- Płaziński W.; Rudziński W.; Adsorption Kinet ics at solid/solution interfaces the meaning of the pseudo-first- and pseudo-second-order equations. Wiad. Chem., 2011, 65, 1055–1067.
- Tran H.N.; You S-J.; Nguyen T.V.; Chao H-P.; Insight into the adsorption mechanism of cationic dye onto biosorbents derived from agricultural wastes. Chem. Eng. Commun., 2017, 204(9), 1020-1036.
- Tran H.N.; You S-J.; Hosseini-Bandegharaei A.; Chao H.-P.; Mistakes and inconsistencies regarding adsorption of contaminants from aqueous solutions: A critical review. Water Res., 2017, 120, 88-116.
- Biehl P.; Wiemuth P.; Garcia Lopez J.; Barth M.-C.; Weidner A.; Dutz S.; Peneva K.; Schacher F. H.; Weak Polyampholytes at the Interface of Magnetic Nanocarriers: A Facile Catch-and-Release Platform for Dyes. Langmuir 2020, 36 (22) , 6095-6105.
- de Voogt P.; Janex-Habibi M.L.; Sacher F.; et al. Development of a common priority list of pharmaceuticalsrelevantforthe water cycle. Water Sci. Technol., 2009, 59(1), 39-46.
- Franz M.; Arafat HA.; Pinto NG.; Effect of chemical surface heterogeneity on the adsorption mechanism of dissolved aromatics on activated carbon. Carbon 2000, 38(13), 1807–19.
- Dean Ho,; Ali Zarrinpar,; and Edward Kai-Hua Chow.; Diamonds, Digital Health, and Drug Development: Optimizing Combinatorial Nanomedicine. 2016, 10 (10) , 9087-9092.

This work is licensed under a Creative Commons Attribution 4.0 International License.
About The Author
![]()
A New Edition of Web of Science
Journal Impact Factor
2022: 0.5
Five Year: 0.8
Journal is Indexed in

Cabells Whitelist
![]()


