Effect of PMMA on PVDF-co-HFP/MgTf3 Polymer Composite with Improved Ionic Conductivity, Thermal and Structural Properties
N. Kundana1,2* , M. Venkatapathy2, V. Neeraja3, Chandra Sekhar Espenti3, V. Madhusudhana Reddy3 and Venkatramana Jeedi1
1B.V. Raju Institute of Technology, Narsapur, Telangana, India.
2Arignar Anna Government Arts College, Musiri, (Affiliated to Bharathidasam University, Tiruchirapalli-620024) Tamilnadu, India.
3Mallareddy College of Engineering and Technology, Hyderabad, Telangana, India.
Corresponding Author E-mail: kundananakkala@gmail.com
DOI : http://dx.doi.org/10.13005/ojc/380508
Article Received on : 30 Aug 2022
Article Accepted on : 30 Sep 2022
Article Published : 10 Oct 2022
Reviewed by: Dr. Aditya Bhattacharyya
Second Review by: Dr. Abdul Aziz Abdul Raman
Final Approval by: Dr. Ioana Stanciu
Polymer blend electrolytes composed of poly(vinylidene fluoride-co-hexafluoro-propylene) (PVDF-co-HFP), poly(methyl methacrylate) (PMMA) and 1•0 M magnesium trifluoromethanesulfonate (MgTf3) as salt have been synthesized using solution caste technique by varying the PMMA@PVDF-co-HFP/Mg2+ blend concentration ratio systematically. However, Mg2+ ions interaction with electrode materials and electrolyte molecules results in slow Mg2+ dissociation and diffusion, which in turn leads to inadequate power density and cycle stability. X-ray diffraction (XRD), FTIR, scanning electron microscopy (SEM), Differential scanning calorimetry (DSC), complex impedance spectroscopy, linear sweep voltammetry, AC and DC ionic conductivity studies were used to examine the impact of compositional modification of PMMA in the composite gel polymer electrolyte system. The PVDF-co-HFP/Mg2+ and PMMA@PVDF-co-HFP /Mg2+ mix-based solid polymer electrolyte membrane provides optimal ionic conductivity of 8.014×10⁻⁶ and 5.612×10⁻⁵ at ambient temperature, and the ionic conductivity of the system rises with increasing PMMA content. Scanning electron microscopy and x-ray diffraction analyses validate the improved ionic conductivity. Electrical conductivity was measured using electrochemical impedance spectroscopy at temperatures ranging from 303 to 363 K. Changes in temperature and PMMA concentration cause an increase in ionic conductivity. Loss tangent and imaginary part of modulus (M"), which relate to dielectric and conductivity relaxation, respectively, demonstrate a quicker relaxation process as PMMA concentration increases up to an optimal value. The modulus (M") demonstrates that the conductivity relaxation is not of the Debye type (broader than the Debye peak).
KEYWORDS:Analytical Characterization; Nanofiller; Polymer Membranes; Porosity; thermal properties
Download this article as:| Copy the following to cite this article: Kundana N, Venkatapathy M, Neeraja V, Espenti C. S, Reddy V. M, Jeedi V. Effect of PMMA on PVDF-co-HFP/MgTf3 Polymer Composite with Improved Ionic Conductivity, Thermal and Structural Properties. Orient J Chem 2022;38(5). |
| Copy the following to cite this URL: Kundana N, Venkatapathy M, Neeraja V, Espenti C. S, Reddy V. M, Jeedi V. Effect of PMMA on PVDF-co-HFP/MgTf3 Polymer Composite with Improved Ionic Conductivity, Thermal and Structural Properties. Orient J Chem 2022;38(5).Available from: https://bit.ly/3ROWjLz |
Introduction
Since the concept of lithium-ion batteries was presented and its commercial use was recognized in the mid-1990s, lithium-particle batteries (LIBs) have been the principal power source for adaptable electronic gadgets, electromobiles, power matrix energy capacity gadgets, and so on. However, the capacity of LIBs and their safety have often been related to the battery going off or even exploding. The film serves as a protective barrier between the cathode and the anode, acting as an electrical encasing while also managing the expense of lithium particle dispersion channels. An excellent layer should typically have positive electrical protection, low ionic blockage, high porosity, fantastic invasion, capturing mechanical power, and electrochemical stability1. Gel polymer systems with increased performance include polyethylene oxide (PEO), polymethyl methacrylate (PMMA), polyvinylidene fluoride (PVDF), polyacrylonitrile (PAN), and PVDF-co-HFP. Polyvinylidene fluoride (PVDF) and polyacrylonitrile (PAN)2-5 are two further examples. While PVDF has high mechanical strength and is easy to crystallize, which is not conducive to improving ionic conductivity, PMMA can contain a large amount of electrolyte but has poor mechanical qualities6, and PEO has low ionic conductivity7, all gel polymers have inherent issues. PAN is lithium incompatible and displays significant interfacial passivation. A single gel polymer electrolyte cannot suit all application criteria. Blending polymer electrolytes to increase conductivity and other characteristics is a simple and effective technique. PVDF, PVDF-co-HFP, PMMA, and PVC8-10 have been the focus of recent polymer electrolyte mixing research. The unusual interactions between polymers (primarily van der Waals forces and hydrogen bonds) are the primary cause for the beneficial impact of polymer electrolytes, which boost battery system compatibility and significantly reduce the crystalline area of the battery system. This might increase the ionic conductivity of the solution while decreasing the glass transition temperature.
One of the materials that is most often used to create gel polymer membranes is PVDF-co-HFP. This material has low crystallinity, which allows it to generate more holes and have a greater free volume. The PVDF-co-HFP based membrane still has a number of drawbacks, however, including low ion conductivity due to its hydrophobicity, low thermal stability, and questionable electrochemical characteristics that fall short of the strict standards for LIBs. Different approaches, including surface coating, cross-linking, amorphization, and crystalline polymer mixing, have been suggested to address these drawbacks11-13. PMMA’s ester structure, which is comparable to organic solvents in liquid electrolytes, may enhance the co-blended membrane’s ability to wet the electrolyte. PMMA also has a low interfacial impedance and a high interfacial stability to metallic lithium electrodes14. PVDF-co-HFP membranes can be combined with PMMA to increase their free volume and porosity in addition to lowering their crystallinity15. However, the PVDF-co-HFP/PMMA blended membrane still has poor mechanical strength and is brittle.
As a consequence of this, next-generation sophisticated rechargeable batteries, such as multivalent metal (Mg, Ca, Al, etc.) batteries, have piqued a lot of people’s attention owing to the high energy density that they theoretically possess. Because the theoretical volumetric energy density of the Mg anode is so much higher than that of the Li anode (2,066 mAh cm-3), rechargeable Mg batteries are widely regarded as the most promising type of battery technology16, 17. This is due to the fact that rechargeable Mg batteries have a capacity of up to 3,866 mAh per cubic centimeter. Because of the passive coating of magnesium hydroxide or magnesium oxide that forms on the surface, the interaction between magnesium and water is far more stable than the reaction between magnesium and water18. This research shelters light on a new strategy for improving the performance of Mg-based batteries via the chemistry of their electrolyte and electrodes. In addition, the reversible plating and stripping procedure does not result in the formation of a dendrite for the magnesium anode. Because of these benefits, the Mg anode has a higher level of safety when compared to the Li anode. In addition, the ratio of magnesium to lithium in the earth’s crust flavours magnesium.
Materials and methods
Materials used in the experimental section
Sigma Aldrich supplied the host polymer PVDF-co-HFP with a molecular weight of 4, 00, 000. Poly(methyl methacrylate) (PMMA), the salt magnesium trifluoromethanesulfonate (MgTf3) with a molecular weight of 322.4, and tetrahydrofuran (THF) solvent were obtained from Sigma Aldrich.
Fabrication of MgTf3 doped in PVDF-co-HFP based polymer electrolytes
MgTf3 doped polymer electrolytes are produced using PVDF-co-HFP as the basis material. Before being put to use, PVDF-co-HFP and PMMA were dried at temperatures of 70 °C and 100 °C respectively, while MgTf3 was dried in a vacuum at temperatures of 100 °C for about 3 hours. The method of solution casting was used for the preparation of PMMA@PVDF-co-HFP/Mg2+ polymer composite electrolyte membranes (PCEMs). PVDF-co-HFP, PMMA, and MgTf3 were dissolved in 50 mL of solvent anhydrous THF (Tetra hydro furan) according to the following composition ratios: PCEM-01 (00:0.07:0.003 wt.%), PCEM-02 (0.005: 0.065:0.003 wt.%), PCEM-03 (0.01: 0.060:0.003 wt.%), PCEM-04 (0.015: 0.055:0.003 wt.%), and PCEM-05 (0.02: 0.050:0.003 wt.%) were found in PMMA@PVDF-co-HFP/Mg2+ 19. The mixture was stirred vigorously for 36 hours at a petri dish that had been coated with Teflon was employed after it had been given a thorough cleaning in order to hold the consistent mixture that had been made. The solvent was allowed to evaporate at room temperature in a vacuum setting so that homogenous PCEMs could be produced without bubbles. These conditions were retained for the subsequent analytical characterization of the substance.
Analytical characterization
An X-ray diffraction (XRD) analysis was performed on the PMMA@PVDF-co-HFP/Mg2+ so that it could be determined whether or not they were of a crystalline or amorphous type. The X-ray diffractometer that was used was a Goniometer Ultima-IV model, and it was calibrated to operate at 40 kV/30 mA. The Cu X-ray tube served as the instrument’s radiation source. SEM micrographs were obtained using an FEI Apreo LoVac that was outfitted with a 200 kV accelerating voltage. This was done so that the resulting pictures would be of the greatest possible quality. A Shimadzu 8201 PC FTIR spectrophotometer was used so that an investigation could be conducted into the structural confirmation of the PCEMs that were manufactured. This instrument had a transmission range that went all the way down to 400 cm-1 from 4000 cm-1. Differential scanning calorimetry (Shimadzu DSC-60) was used to figure out how hot or cold the PCEMs were.
Electrochemical measurement
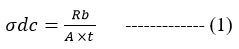
Electrochemical impedance spectroscopy (EIS) was used to measure the ionic conductivity of the PVDF-co-HFP/Mg2+ andPMMA@PVDF-co-HFP/Mg2+ composite electrolyte. Solartron 1260 Impedance analyzer was utilized to measure polymer electrolyte sheets’ ionic conductivity from 303K to 363K. The impedance measurements are performed by spring-pressing the polymer electrolyte layers between two stainless steel electrodes. Each sample’s ionic conductivity is computed using the following equation:
A blocking symmetric steel/CPE/steel cell was used to measure the ionic conductivity between 1 MHz and 0.01 Hz at temperatures between 20 and 80 degrees Celsius with an amplitude of 10 millivolts.
Results and Discussion
X-ray diffraction studies of the composite polymer electrolyte:
An X-ray diffraction (XRD) examination was used to look into the mixed membranes’ phase composition. X-ray diffraction (XRD) patterns of PMMA, PVDF-co-HFP, MgTf3, PVDF-co-HFP/Mg2+ (70:30) and PMMA@PVDF-co-HFP/Mg2+ composite membranes were shown in Fig. 1. Diffraction intensity is shown to be strong and peaks are sharp for all values of 2 except for pure PMMA. Figure 1’s XRD patterns show strong crystalline peaks corresponding to MgTf3 salt in all polymeric mix membranes, supporting the SEM images and Fig. 3 showing that the Mg2+ ions were distributed into the pores of the membranes without any chemical interaction. The porous polymer matrix, which is also made of interconnected pores, provides a pathway for the movement of Mg2+ ions, facilitating their mobility. The amorphous nature suggested by the SEM data is supported by the XRD findings.
PMMA has broad, dramatic peaks at 2θ = 15.26° and 30.24°, demonstrating its amorphous nature, indicating that the membrane is amorphous in nature. The 2θ = 17.96°, 19.33°, 20.67°, 28.45°, 24.53°, 30.00°, 32.73°, and 34.33° demonstrate the semi-crystallinity of the membrane20 when blended with PMMA@PVDF-co-HFP/Mg2+, as shown in Fig. 1. These peaks are similar to those seen in PMMA@PVDF-co-HFP/Mg2+ and PVDF-co-HFP/Mg2+, which pertain to the blend of PMMA@PVDF-co-HFP/Mg2+, almost all of the peaks vanished, leaving behind just the 19.55° and 30.69° peaks. This proves that a change from the semi-crystalline to amorphous phase takes place21. In the PMMA@PVDF-co-HFP/Mg2+ and PVDF-co-HFP/Mg2+membranes, peaks at 17.51°, 30.00°, and 34.23° resurfaced in the composite membranes, indicating that these membranes become semi-crystalline at these compositions. These findings suggest that PMMA@PVDF-co-HFP/Mg2+ (with 0.015: 0.055: 0.003 wt.%) composition is the optimal material for further research into AC and DC conductivities. This shows that the complexation that happened between the PVDF-co-HFP, PMMA, and MgTf3 made the polymeric blend membranes more amorphous.
 |
Figure 1: Illustrates the XRD peaks of pure PMMA, PVDF-co-HFP, MgTf3 salt, PVDF-co-HFP/Mg2+ and PMMA@PVDF-co-HFP/Mg2+ composite membranes. |
FT-IR spectroscopic analysis of the composite polymer electrolyte
Infrared spectroscopy is used in the study of both the vibrational modes that are exhibited by polymers as well as the functional groups that make up those modes. The addition of salt to the blended polymer causes the bands of FTIR absorption peaks to move, widen, and vanish as a result of the atomic and molecular interaction between them22, 23. This takes place as a direct consequence of the molecular interaction with the salt. In Fig. 2, we see the FTIR spectra of pure PVDF-co-HFP, pure PMMA powder, pure MgTf3 salt, PVDF-co-HFP/Mg2+ and PMMA@PVDF-co-HFP/Mg2+ electrolyte membranes consisting of different proportions of PMMA in the wave number range of 4000 to 400 cm-1.
 |
Figure 2: FTIR peaks of pure PMMA, PVDF-co-HFP, MgTf3 salt, PVDF-co-HFP/Mg2+ and PMMA@PVDF-co-HFP/Mg2+ composite membranes. |
The addition of PMMA causes a decrease in the crystallinity of the PVDF-co-HFP membrane, 976, 796, 760, and 530 cm-1 absorption bands are connected to α-phase PVDF-co-HFP crystals. At 1383 and 490 cm-1, PVDF-co-HFP absorbs CH2 and CF2 vibrations. These two peaks moved to 1398 and 482 cm-1 in polymer electrolytes. Blends did not include any of the PMMA, which is characterized by prominent peaks at 1445 cm-1. The bending of O-CH3, C-C-C, C-O-C, and CH2 as well as asymmetric stretching of C-O-C and CH2 have all been associated with these peaks. The IR absorption peaks for PMMA were moved from 2951 cm-1 (CH symmetric stretching) to 2918 cm-1 (C=O asymmetric stretching), 1718 cm-1 (C-O-C stretching), and 843 cm-1 (CH2 rocking) to account for the interaction between PVDF-co-HFP, PMMA, and MgTf3 in the blend complexes. In addition to the previously observed peaks in the mixtures at 2505, 2305, 2214, 2090, and 2,855 cm-1, numerous additional peaks appeared. New peaks in the IR spectra of PMMA@PVDF-co-HFP/Mg2+ blended polymer composite membranes, as well as the shifting and absence of IR bands in the pure polymer and salt, are indicative of a significant interaction between the two polymers and the dopant Mg salt24.
Physical properties of the composite polymer electrolyte
 |
Figure 3: Illustrates the SEM micrographs (Scale bars at 10 μm) of pure PMMA, PVDF-co-HFP, MgTf3 salt, PVDF-co-HFP/Mg2+ and PMMA@PVDF-co-HFP/Mg2+ composite membranes. |
The surface morphology and porous structure of the produced membranes were analyzed using SEM, and the resulting pictures were arranged in Fig. 3 according to their dimensions. In Figure 3, a comparison of pure PMMA membrane, pure PVDF-co-HFP membrane, PVDF-co-HFP/Mg2+ and PMMA@PVDF-co-HFP/Mg2+ blend composite membranes was displayed. The very porous character of the pure PMMA and PVDF-co-HFP may be seen in Figure 3 (A&B), which also reveals a smooth surface with a limited number of micropores accessible to depict the semi-crystalline structure of the PMMA and PVDF-co-HFP plain polymer membrane. The semi-crystalline surface morphology of the obtained membranes were converted into the amorphous nature when it doped with the MgTf3 salt and as evidenced in the SEM micrographs presented in Figure 3 (C&D), while it revealed the semi-crystalline α-phase of the pure MgTf3 salt. It was discovered, as shown in Figure 3 (E&F) that different compositions of PMMA@PVDF-co-HFP/Mg2+ blend composite membranes that were doped with the MgTf3 salt resulted in the pores of the membranes being filled with Mg2+ ions. This resulted in a reduction in the porosity of the membranes, which in turn led to the transformation of the β-phase into the α-phase which is more amorphous in nature. The surface morphology of the blended polymer membranes became smoother and more connected with a number of holes when PMMA was introduced to PVDF-co-HFP. These pores were then filled with Mg2+ ions to complete the process25. According to these findings, the produced membranes have become less crystalline while simultaneously increasing in amorphous content. These evidences are furtherly influenced in the increasing of the conductivity of the composite membranes.
Thermal properties of the composite polymer electrolyte
DSC testing may identify a drop in the melting point of a polymeric substance. The melting point of a polymer is directly proportional to its molecular weight. The melting point of a polymer may be lower than expected if it is heated to higher temperatures than it is designed to withstand. By comparing heat data collected at stable heating rates, we may get valuable insight into processes and material properties. DSC thermograms were made at heating rates of 10 °C/min and temperatures within an acceptable range (30 to 180 °C). They are shown in Figure-4 for the MgTf3 salt, pure PMMA, pure PVDF-co-HFP, PVDF-co-HFP/Mg2+ and PMMA@PVDF-co-HFP/Mg2+ composite polymer compositions. The melting point of pure MgTf3 salt is 133.37 °C, whereas the glass transition temperature is 94.24 °C. The Tg value was reduced to 99.49 °C and the Tm value was elevated to 126.34 °C (endothermic peak) when it was introduced into the polymer network of PVDF-co-HFP copolymer26. Pure PMMA polymer and pure PVDF-co-HFP did not exhibit any Tm or Tg values in any range. It is possible that a change in crystallinity or the local influence of polymer conformation on MgTf3 is responsible for the significant decrease in melting temperature. In the blend composition of PMMA@PVDF-co-HFP/Mg2+, the Tg and Tm values are 108.13 °C and 120.69 °C, respectively. These findings were found to have a correlation with those of the XRD and SEM examinations. Because of the amorphous structure, Mg2+ ions may be able to travel more easily throughout the chain in PMMA@PVDF-co-HFP/Mg2+ polymer composite membranes.
 |
Figure 4: Illustrates the DSC curves of pure PMMA, PVDF-co-HFP, MgTf3 salt, PVDF-co-HFP/Mg2+ and PMMA@PVDF-co-HFP/Mg2+ composite membranes. |
Electrical properties Complex impedance analysis
Electrochemical impedance spectroscopy was used to investigate the effect of the mix on the conductivity of the solid polymer electrolyte (SPE) as well as its frequency behavior. For the purpose of conducting conductivity experiments, PVDF-co-HFP containing varying proportions of MgTf3 (namely, 60:40, 70:30, 80:20, and 90:10) was produced and studied. It was discovered that a proportion of 70:30 offered the optimum conductivity27.
Later, PMMA, a blend, was added to know its effect on PVDF-co-HFP with MgTf3 (SPE) with different W%, and it was observed that the ratio of 55:15:30 (PMMA@PVDF-co-HFP/Mg2+) gets the best conductivity. The impedance spectra of polymer with a salt and polymer salt with a nano filler were presented in Nyquist plots as given in fig. It was observed that the bulk resistance Rb value is reduced for polymer blends when added to polymer complexes both at below and above Tm. Nyquist plots of pure polymer salt and blended polymer salt with different weight percentages of PMMA demonstrate a depressed semi-circle and a spike , which is given as a parallel and series combination of bulk resistance (Rb) and constant phase element (a) The plot consists of two semicircles, one at high frequency and the other at low frequency, which depict an unstable interface being formed between Mg2+ and PVDF-co-HFP . The medium frequency semi-arc is representative of the resistance of the Mg2+ interface. The impedance shows the effect of blend in stabilizing this interface due to its well-established scavenging and shielding actions. Indeed, the blend of the polymer of SPE is characterized by a smaller semicircle and a smaller expansion, which practically means that Mg2+ ions are protected by a thin and stable surface passivation layer, which reflects a good cycle life28. (b). the plot consists of an arc at high frequency, which corresponds to charge transfer at the electrode electrolyte interface; a non-vertical line at intermediate frequency, which depicts electron recombination mechanism, ion transport limitation in the bulk electrolyte; and a spike. The spike (vertical line) at lower frequencies is caused by a process that limits ion diffusion and adds to the impedance response.
The ionic conductivity of PMMA@PVDF-co-HFP/Mg2+ and PVDF-co-HFP/Mg2+ was calculated using impedance plots obtained from EIS. The bulk resistance (Rb) value is given by the intercept from the plots. The conductivity (σ) of the SPE membrane was calculated by using the following relation:
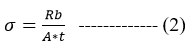
Where ‘t’ is the thickness of the polymer electrolyte and A is the contact area of the sample. The ionic conductivities of polymer and its blend were found to be 8.014×10⁻⁶ and 5.612×10⁻⁵.
 |
Figure 5: EIS spectra of samples PVDF-co-HFP/Mg2+ and PMMA@PVDF-co-HFP/Mg2+ (Nyquist plots). |
DC ionic conductivity
To examine the temperature-dependent conductivity of blended polymer salts and pure polymer salts, log of DC conductivity (LOG SIGMA) against 1000/T graphs were utilized. Comparatively, polymer salt and polymer salt complexed with (55-15-30) have demonstrated higher conductance at room temperature. As the concentration of the polymer increases, ions transfer quickly between adjacent polymer chains, one after the other. This enhances the segmental mobility of the next chain and facilitates the capacity to hop to other polymer chains. This enhances ion and polymer segment mobility and conductivity. Figure 6(A)’s slope represents activation energy, the threshold for ions to hop between sites. With the rise of PMMA polymer, the activation energy decreases, indicating amorphousness in the matrix blend electrolytes. Increases in the number of charge carriers and the mobility of ions29 are to blame for the rise in conductivity.
 |
Figure 6: Variation of ionic conductivity (A) DC conductivity (B) AC conductivity for electrolyte system of PVDF-co-HFP/Mg2+ and PMMA@PVDF-co-HFP/Mg2+. |
AC Conductivity
The blending effect of PMMA concentration with respect to PVDF-co-HFP in the PVDF-HFP/Mg+2 polymer blend was studied in terms of frequency dependence of conductivity. From the Figure 6(B), at low frequencies, σ′ is frequency independent and corresponds to dc conductivity. At higher frequencies, ionic conductivity becomes frequency-dependent and ac-conductivity, i.e., σac. This conductivity spectrum behaviour conforms to the universal Jonscher power law27 features, including:
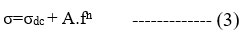
σdc is frequency-independent conductivity, A is the pre-exponential factor, and n is the usually zero-to-one fractional exponent. The exponent n reflects disordered materials’ numerous ion conduction mechanisms. This rule applies to the majority of disordered substances, including glasses, ceramics, polymers, and composites. We have covered ion conduction and charge carrier dynamics in this article. The conductivity values at low frequency are due to the accumulation of Mg+2 ions because of the slow periodic reversal of the electric field. Due to how mobile the Mg+2 ions are in the polymer composite membrane; the conductivity goes up sharply as the frequency goes up at high frequencies.
Dielectric Studies
Ion transport in SPE is a complicated process dependent on host polymer dielectric constant, salt concentration, salt dissociation, and chain mobility. Dielectric studies of ion-conducting polymer electrolytes reveal ion transport and ionic/molecular interactions30. Real and imaginary impedance components were used to compute dielectric permittivity and loss tangent, respectively.
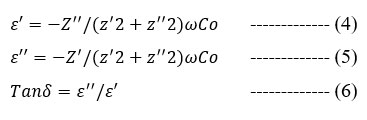
Where Co is the vaccum of capacitance and given by o A/t where o is a permittivity of free space and is equal to 8.85*10-12 F/m. The angular frequency =2 , where f = frequency of applied field.
Figure 7 shows the real and imaginary components of polymer salt dielectric permittivity as a function of frequency. Dielectric loss E” is frequency-independent at high frequencies and increases significantly at low frequencies (Figure 7B). Due to dissolved Mg2+ ions, polymer mixes with salt have higher. The numbers reflect coulombic interaction between ion pairs in polymer electrolytes. Low-frequency dispersion adds to charge buildup at the electrode electrolyte interface by accumulating free charges at the material-electrode interface (Figure 7B). It has been seen that the relaxation peak is lowest for polymer salt and moves to a higher frequency for polymer blend. This suggests that the blend polymer electrolyte has more flexibility and amorphous phase content in its matrix, which makes the polymer chain move more in segments31.
 |
Figure 7: Variation of dielectric constant (A) dielectric constant (B) dielectric loss for electrolyte system of PVDF-co-HFP/Mg2+ and PMMA@PVDF-co-HFP/Mg2+. |
Electric Modulus:
Figure 8 shows the variation of the imaginary (M”) part as a function of frequency for polymer salt and polymer blends with salt. At low frequencies, the regime suggests a capacitance associated with the electrodes that is substantial32. The relaxation peak of a polymer mix is migrating towards the high frequency domain. This dielectric relaxation is caused by the rearrangement of dipoles in the polymer chain33.
 |
Figure 8: Variation of electrical modulus (A) real part and (B) imaginary part for PVDF-co-HFP/Mg2+ and PMMA@PVDF-co-HFP/Mg2+ system at different frequencies. |
Tangent Loss
Figure 9 shows loss tangent curves for PVDF-co-HFP/Mg2+ and PMMA@PVDF-co-HFP/Mg2+ system at different frequencies. The peak maximum loss tangent curve was found to shift towards a high frequency region upon blending the polymer34. This is attributed to a decrease in the degree of crystallinity and an increase in the segmental motion of the polymer chain35. The frequency at which the distinctive peak appears in Z” and tan (δ) differs, showing that different relaxation mechanisms are at play in each case. The frequency of the Z” max peak of conductivity relaxation correlates with the frequency at which ion transport changes from AC to DC (Figure 6), whereas the frequency at which the tan peak occurs is correlated with the frequency at which electrode polarization begins. The plot of loss tangent (tan δ) as a function of frequency may also be used to learn more about the relaxation processes of a system under different salt concentrations.
 |
Figure 9: Shows loss tangent curves for PVDF-co-HFP/Mg2+ and PMMA@PVDF-co-HFP/Mg2+ system at different frequencies. |
Conclusion
In this study, porous PMMA@PVDF-co-HFP/Mg+2 polymer membrane doped with MgTf3 were solution cast. High-porosity, amorphous membrane may increase conductivity, which might assist future battery design. MgTf3 has been studied as a way to minimize pores in the both PMMA@PVDF-co-HFP/Mg+2 and PVDF-co-HFP/Mg+2 while increasing their number. By utilizing MgTf3 as an inorganic filler, the research reduced the size of prepared membrane holes and enhanced their amorphous nature. An FTIR study confirmed MgTf3’s chemical interaction with PMMA@PVDF-co-HFP/Mg+2 and the resultant composite membranes phase shift from semi-crystalline to amorphous. SEM studies indicated that the PMMA@PVDF-co-HFP/Mg+2 PBEMs were porous. PBEMs had weaker PVDF-co-HFP XRD peaks than composite membranes. This implies that PBEMs-03 has regained its semi-crystalline nature. The DSC study established the glass transition and melting temperatures of pure and salt-incorporated PMMA@PVDF-co-HFP/Mg+2 membranes. Inorganic salt particles may make PMMA@PVDF-co-HFP/Mg+2 membranes porous, which promotes ion mobility and membrane stability when filled with electrolytes and electrodes. PVDF-co-HFP/Mg2+ and PMMA@PVDF-co-HFP/Mg2+ solid polymer electrolyte membranes give optimum ionic conductivity of 8.014×10⁻⁶ and 5.612×10⁻⁵ at ambient temperature. System ionic conductivity increases with increasing PMMA content. EIS spectroscopy measured electrical conductivity between 303 and 363 K. Temperature and PMMA concentration affect ionic conductivity. Loss tangent and M” Dielectric and conductivity relaxation speed up when PMMA concentration reaches an ideal level. M” indicates that conductivity relaxation isn’t Debye-type.
Acknowledgment
The authors declare that they have no relevant financial or non-financial interests to disclose, and authors have no competing interests to declare that are relevant to the content of this article.
Conflict of interest
The authors declare that they have no known competing financial interests or personal relationships that could have appeared to influence the work reported in this paper. There is no potential conflict of interest.
References
- Sang, D. K., Wang, H., Guo, Z., Xie, N., Zhang, H. Adv. Funct. Mater, 2019, 29(45), 1903419.
CrossRef - Janakiraman, S., Agrawal, A., Biswal, R., Venimadhav, A. App. Surf. Sci. Adv., 2021, 6, 100139.
CrossRef - Ramana K. V, Sekhar A. M C, Reddy V. M, Subrahmanyam A. R, Reddy M. R, Reddy T. R. Orient J Chem. 2022, 38(2), 348-351.
CrossRef - Jamalpour, S., Ghahramani, M., Ghaffarian, S. R., Javanbakht, M. Polymer, 2021, 228, 123924.
CrossRef - Xue, N., Wang, W., Chen, Z., Heng, Y., Yuan, Z., Xu, R., Lei, C. J. Electr. Chem., 2022, 907, 116026.
CrossRef - SuAit, M. S., Ahmad, A., Hamzah, H., Rahman, M. Y. A. Journal of Physics D: App. Phy., 2009, 42(5), 055410.
CrossRef - Feng, J., Wang, L., Chen, Y., Wang, P., Zhang, H., He, X. Nano Convergence, 2021, 8(1), 1-12.
CrossRef - Jayaraman, R., Vickraman, P., Subramanian, N. M. V., Justin, A. S. J. Non-Cryst. Solids, 2016, 435, 27-32.
CrossRef - Liang, Y. F., Xia, Y., Zhang, S. Z., Wang, X. L., Xia, X. H., Gu, C. D., Tu, J. P. Electrochim. Acta, 2019, 296, 1064-1069.
CrossRef - Mallikarjun, A., Siva Kumar, J., Sreekanth, T., Sangeetha, M., Mettu, M. R., Espenti, C. S., Jaipal Reddy, M. Poly-Plas. Techn. Mat., 2022, 61(15) 1-17.
- Oral, E., Muratoglu, O. K. Nuclear Instruments and Methods in Physics Research Section B: Beam Interactions with Materials and Atoms, 2007, 265(1), 18-22.
CrossRef - Song, P., Wang, H. Adv. Mat., 2020, 32(18), 1901244.
CrossRef - Wang, D., Zhang, Q., Liu, J., Zhao, E., Li, Z., Yang, Y., Zhang, S. J. Mat. Chem. A, 2020, 8(19), 9693-9700.
CrossRef - Xiong, X., Zhi, R., Zhou, Q., Yan, W., Zhu, Y., Chen, Y., & Wu, Y. Mat. Adv., 2021, 2(13), 4240-4245.
CrossRef - Shi, J., Yang, Y., Shao, H. J. Memb. Sci., 2018, 547, 1-10.
CrossRef - Zhang, X., Lv, R., Tang, W., Li, G., Wang, A., Dong, A., Luo, J. Adv. Funct. Mat., 2020, 30(45), 2004187.
CrossRef - Zhan, Y., Zhang, W., Lei, B., Liu, H., Li, W. Front. Chem., 2020, 8, 125.
CrossRef - Liu, M., Zanna, S., Ardelean, H., Frateur, I., Schmutz, P., Song, G., Marcus, P. Corrosion Sci., 2009, 51(5), 1115-1127.
CrossRef - N. Kundana, M. Venkatapathy, V. Neeraja, CS. Espenti, VM. Reddy. NeuroQuantology, 2020, 20(06), 5890-5897.
- Zhang, J., Sun, B., Huang, X., Chen, S., Wang, G. Sci. Rep., 2014, 4(1), 1-7.
CrossRef - Liew, C. W., Ong, Y. S., Lim, J. Y., Lim, C. S., Teoh, K. H., Ramesh, S. Int. J. Electrochem. Sci., 2013, 8, 7779-7794.
- Wang, M., Zhao, F., Guo, Z., Dong, S. Electrochi. Acta, 2004, 49(21), 3595-3602.
CrossRef - Wang, X., Wang, X., Chen, J., Zhao, Y., Mao, Z., Wang, D. Solid State Ion, 2021, 365, 115655.
CrossRef - Ramaiah N, Raja V, Ramu C. Orient. J. Chem, 2021; 37(5), 1102-1108.
CrossRef - Rath, R., Kumar, P., Rana, D., Mishra, V., Kumar, A., Mohanty, S., Nayak, S. K. J. Mat. Sci., 2022, 57(5), 3565-3585.
CrossRef - Link, J., Sanseau, O., Tauban, M., Colbeau‐Justin, F., Lorthioir, C., Sotta, P. In Macromolecular Symposia, 2019, 385(1), 1800162.
CrossRef - Jonscher, A. Nature, 1977, 267, 673–679. https://doi.org/10.1038/267673a0
CrossRef - Riphaus, N., Stiaszny, B., Beyer, H., Indris, S., Gasteiger, H. A., Sedlmaier, S. J. J. Electrochem. Soc., 2019, 166(6), A975.
CrossRef - Porcarelli, L., Gerbaldi, C., Bella, F., Nair, J. R. Sci. rep., 2016, 6(1), 1-14.
CrossRef - Pradhan, D. K., Choudhary, R. N. P., Samantaray, B. K. Int. J. Electrochem. Sci, 2008, 3(5), 597-608.
- Johan, M. R., Shy, O. H., Ibrahim, S., Yassin, S. M. M., Hui, T. Y. Solid State Ion., 2011, 196(1), 41-47.
CrossRef - Karthikeyan, S., Sikkanthar, S., Selvasekarapandian, S., Arunkumar, D., Nithya, H., Kawamura, J. J. Poly. Res., 2016, 23(3), 1-10.
CrossRef - Dhatarwal, P., Sengwa, R. J. SN Applied Sciences, 2020, 2(5), 1-16.
CrossRef - Pradhan, D. K., Choudhary, R. N. P., Samantaray, B. K. Int. J. Electrochem. Sci, 2008, 3(5), 597-608.
CrossRef - Kumar, K. K., Ravi, M., Pavani, Y., Bhavani, S., Sharma, A. K., Rao, V. N. Physica B: Condensed Matter, 2011, 406(9), 1706-1712.
CrossRef

This work is licensed under a Creative Commons Attribution 4.0 International License.
About The Author
![]()
A New Edition of Web of Science
Journal Impact Factor
2022: 0.5
Five Year: 0.8
Journal is Indexed in

Cabells Whitelist
![]()


