Comparative Assessment of Single and Mixed Photosensitizers using Erythrosin B and Tartrazine Yellow Dye System in Photogalvanic and Dye Sensitized Solar Cells
Virendra Soni , Chanchal Mahavar, Varsha Rajoriya and K. R. Genwa*
Department of Chemistry, Jai Narain Vyas University, Jodhpur, 2/954 Kudi Bhagtasni Housing Board, Jodhpur, India.
Corresponding Author E-mail: krg2004@rediffmail.com
DOI : http://dx.doi.org/10.13005/ojc/380502
Article Received on : 25 Aug 2022
Article Accepted on : 26 Sep 2022
Reviewed by: Dr. Rafal Salam
Second Review by: Dr. Tanay Pramanik
Final Approval by: Dr. Ayssar Nahle
To reduce costs, a low-cost thin-film solar cell technique known as the Dye Sensitized Solar Cell (DSSC)/Gratzel Cell emerged. DSSC is an easy to manufacture photovoltaic technique but lacks its stability and higher conversion efficiency factors. In this paper, to overcome these challenges and to keep the cost factor on trial, the photogalvanic cell was also studied using an H-shaped glass tube. Both DSSC and photogalvanic cells were studied using the dyes Erythrosin B, Tartrazine, and a mixture of Erythrosin B and Tartrazine. It was noticed that the solution of a “mixture of photosensitisers” gave the conversion efficiency(η) of solar light of 0.11% in DSSC with Dimethyl sulphoxide (DMSO) as solvent, whereas the same system gave the 0.6963% conversion efficiency(η) of solar light in a photogalvanic solar cell, which states that photogalvanic cells shows comparatively higher conversion efficiency than DSSC.
KEYWORDS:comparative conversion efficiency; Dimethyl sulphoxide; Gratzel cell; Photogalvanic cell
Download this article as:| Copy the following to cite this article: Soni V, Mahavar C, Rajoriya V, Genwa K. R. Comparative Assessment of Single and Mixed Photosensitizers using Erythrosin B and Tartrazine Yellow Dye System in Photogalvanic and Dye Sensitized Solar Cells. Orient J Chem 2022;38(5). |
| Copy the following to cite this URL: Soni V, Mahavar C, Rajoriya V, Genwa K. R. Comparative Assessment of Single and Mixed Photosensitizers using Erythrosin B and Tartrazine Yellow Dye System in Photogalvanic and Dye Sensitized Solar Cells. Orient J Chem 2022;38(5). Available from: https://bit.ly/3Cn7xRy |
Introduction
At present, the use of traditional sources of energy is increasing rapidly; on the other hand, demand for energy for continuous domestic work, commercial and business work is there. So, the usage of various sources for the protection and the production of pollution-free energy have become very important to us. Therefore, it is necessary to find the most appropriate alternate findings for improving energy resources so that energy demand can be completed in a timely manner. In recent years, energy conservation has also emerged as a core fundamental issue. The energy resources present in any country have an important contribution to the progress of any country. There is less likelihood of pollution and also less disposal of pollutants. Conservation and pollution-free use of power resources help close the gap between how much power is needed and how much is given out. Energy performance improvement may be one of the best suitable alternatives for bridging the breach in a quick time period.
The renewable sources of energy1–5 are free of cost, pollution-free, vastly available and inexhaustible. Currently, renewable energy sources are being used in many countries. Energy has been produced by humans using windmills for many centuries6. In fact, solar power is also used as radiant energy, which is acquired from the sunlight, and it is harnessed by using a variety of technologies like solar, heating, photovoltaic, thermal, etc. for converting it into electric energy7-9.
Photo-electrochemical conversion is a type of process in which electrical energy is produced from the sun’s power. Photo-electrochemical conversion is based totally on photo-electrochemical effects. First of all, Becquerel10-11 observed electrochemical phenomena. After his work, a lot of other scientists and researchers12–13 looked into photoelectrochemical effects every now and then. Later, Chepelianskii14 investigated the photogalvanic impact systematically in different types of systems, but this area of photo electrochemistry got momentum with the observations of Michael Grätzel15 and excellently reviewed by Tachibana16. More research on photogalvanic phenomena by Chepelianskii17, König18, Alhorani19, and Prakash20 were considered useful from the point of view of solar power conversion and storage, as few of the conditions imposed on the selection of a photochemical reaction proved competent. Yadav and Lal21, Gangotri and Mahesh22, Koli, Sharma, and Gangotri23 have recently investigated photogalvanic effects in mixed photosensitiser and reductant systems. Genwa and some other researchers24–28 have developed some new dye-surfactant systems for improvement in solar energy storage and photoenergy conversion. Researchers are currently changing the molecular structure of photosensitizers29-34 in order to increase current density, and they are also working on stabilising electrolytes35 in order to increase photo-current conversions36. DSSCs are still under continuous investigation and development to obtain good durability, progressive performance with balance37. Continuous necessary conversions are being made to make DSSCs more efficient. Quantum dots are also being used to increase the photocurrent conversion efficiency of DSSCs, so that more photo-electric current generation can be done. Research has also been given foremost attention to the electrolyte, which is the main part of the DSS cell module; it is also responsible for electron transport synthesis of dyes through a high value of molar extinction coefficient and changing the doping of the TiO2 to a higher match through the electrolyte, which is currently used by investigators in the area of DSSCs. The continuous efforts of the scientists resulted in the great improvement of the DSSCs’ device performance and long-term stability. This will virtually cause fulfilment of the future guarantees of this new solar power technology38.
DSSC being consistently low priced as compare to silicon solar cell, has been given attention by researches to study. Some synthetic dyes have been used but their cost is high, therefore DSSC currently focuses more on the practise of organic dye because it is cheaper than synthesized dye. For commercialization, DSSC should reduce its price and increase its performance; therefore, organic dyes are currently being applied as photosensitizer for DSSC production. In addition, DSSC is being created by Natural Dyes and hence low fee organic dyes provide a factor of research39-40. Natural dyes primarily based DSSCs are more cost effective and commercially feasible which can compete current technologies. Fabrication of DSSCs is done with the components like organic dyes, monocrystalline semiconductor (TiO2) and photosensitizer41-42. Recently, numerous Photochemists43-44 have established new modified photosensitizer used in photogalvanic45-46 solar cells. Significant work is yet needed to expand the photo-to-current conversion efficiency and storage capacity of photogalvanic and Dye sensitized solar cells.
Experimental
Dye Sensitized Solar Cells (DSSCs)
“DSSCs” made up with photosensitizer, working electrode, counter electrode and electrolyte.
Photosensitizers (Dyes)
Photosensitizer is the essential part of DSSC that produces photoelectricity in solar cells. The sensitizer is adsorbed by the layer of the TiO2 semiconductor by chemical bonding. Satisfactory absorption of solar light is a precondition to attaining high efficiency for such a DSSC. The photosensitizers with the highest absorption, combined with a thin layer of fluorine doped tin oxide (FTO) with a nano-crystalline morphology, provide excellent photo absorption. We used different photosensitizers and mixtures of photosensitizers in various solvents for the fabrication of DSSC (figure 1).
 |
Figure 1: Structure of photosensitisers (a) Erythrosin B and (b) Tartrazine Y. |
Solution of the mixture of these dyes appears dark red color. It is easily soluble in water and ethanol. It gives absorption in Ultra-Violate and visible region and it gives Maximum absorption (λmax) at 528nm in water.
Fabrication of working electrode
Fabrication of the working electrode begins with the cleaning of the FTO glass slides with the aid of the ultrasonicator. The formulation of TiO2 paste is done by grinding TiO2 nano-particles (anatase) with acetic acid (pH 3 to 4) till a lump-free (smooth) paste is obtained. To this paste we add 1 or 2 drops of Triton-X 100 (surfactant). Triton-X 100 here covers the TiO2 nanoparticles and assists in regular distribution of the particles for an excellent colloidal smooth paste. By using the Doctor Blade Method47, TiO2 paste is spread out on the FTO glass slide of DSSC modules. The TiO2 coated FTO slide is then immersed in the photosensitizer solution for 24 hours in the dark for proper adsorption of the photosensitizer on the TiO2 coating.
Counter Electrode
By the aid of simple painting brush the Platinum Precursor painted on FTO glass plate; size of glass plate is same as Titania electrode being used in the DSS cell. Softly brush-paint the platinum (H2PtCl6) onto the conductive side of the FTO substrate and calcine it at 350oC for 30 minutes.
DSSC assembly
Activated FTO glass plates were used to construct the TiO2 semiconductor paste in the DSSC assembly. These plates were first washed with double distilled water (D. distilled water) followed by ethanol and then sonicated for 30 minutes. After washing, they were wiped slowly (to avoid scratches) and left to dry. These glasses were then covered from three sides, leaving 1x1cm2 areas using 50µm thick adhesive tape. Then at the top of one side of FTO glass, TiO2 paste was applied and rolled down through it by the help of a glass rod. This technique is called the doctor-blade technique. The layer of TiO2 was kept for drying at a 27o-30o temperature for 30 minutes, then after peeling off the adhesive tape, it was calcined at 500o C for one hour. Later, these plates were made adsorbed by dye solution by placing the TiO2 thin film upwards in a Petridis and pouring dye solution into it, ensuring the full coverage of the TiO2 layer. This was kept overnight (24 hours) and washed with water to remove non-adsorbed dye. 2-3 drops of iodide/tri-iodide (redox couple) electrolyte was introduced over photosensitized mesoporous TiO2 film. This liquid electrolyte of I2/KI is widely used as a charge mediator. Finally, the Pt-counter electrode was placed on the top of the TiO2 film. Fabricated cells were characterized by using a digital multimeter. This method was repeated four more times with dye solutions prepared in various solvents.
Photogalvanic Solar cells
There are four main components used
H- shaped glass tube (covered with black tape)
Dye solution containing reductant (EDTA), surfactant (NaLS) and sodium hydroxide (NaOH).
Platinum electrode (1.0 x 1.0 cm2)
Saturated calomel electrode (SCE)
Firstly, the dye solution is prepared in which known amount of reductant (EDTA), surfactant (NaLS) and sodium hydroxide (NaOH) are added in 25ml volumetric flask. This dye solution is then diluted by adding 25ml D. distilled water and poured in to H-shaped glass tube. To the one end/limb of H-tube, platinum electrode (1.0 x 1.0 cm2), and to other limb Saturated Calomel Electrode48 (SCE) were immersed. The terminals of both the electrode were connected to a digital pH meter (Systronics Model–335) to determine the potential of solution, and also to a micro-ammeter (Ruttonsha Simpson) through a key and resistance to determine the photo-current generation by the solution. The entire cell was initial placed in the dark condition and the potential (mV) of cell was measured. When the photovoltaic cell reaches a steady potential, it was mentioned as dark potential. Then the limb holding platinum electrode was visible to light emitted by a 200 W tungsten lamp. Engaging lamps of altered wattage varies the light intensity, which marks the efficiency of cell. A water filter was positioned among the illumined compartment and the light source, for the cut off infrared radiations.
The procedure was done with the appropriate photosensitizer or dye, surfactant and in photogalvanic cells for improved electrical output. In the method of this bearing, we have an aspect of photo-galvanic significance through “sodium lauryl sulphate” (NaLS) as a surfactant, and the used reducing agent was EDTA in photo-voltaic solar cell systems.
Results and Discussions
UV-visible spectral study of photosensitizers
Obtained spectrums are shown in this part with concluding tables for best solvent for mixture of dyes and new λmax obtained for them which also gives higher efficiency in that particular solvent.
Erythrosin B
Erythrosin B dye was dissolved in three types solvents to check its absorption properties by UV-Spectro-photo-meter (ELICO-SL-244) (Figure 2).
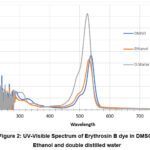 |
Figure 2: UV-Visible Spectrum of Erythrosin B dye in DMSO, Ethanol and double distilled water. |
The characteristics spectrum presented those dyes were frequently dissolved in all these solvents, with the best dissolution property in double-distilled water.
The UV-Visible spectra of Erythrosin B show that the highest absorption is in D. distilled water (as a solvent) more than DMSO and ethanol. The broadness of the spectra was obtained to be comparatively almost equal in all of the three solvents. But the absorption band observed for D. distilled water as the solvent was the highest. It gives information about photon absorption for solar cells and that it may also give good efficiency among all the solvents which solubilized the dye.
Tartrazine Y
Tartrazine Y dye was dissolved in three types of solvents, and its optical properties were studied by UV-Vis. Spectrophotometer (Figure 3).
 |
Figure 3: Spectra of Tartrazine Y in different solvent. |
The characteristics spectrum showed that Tartrazine Y was best dissolved in double distilled water.
Figure 3 shows the UV-Visible spectra of Erythrosin B; that the highest absorption is in D. distilled water (as a solvent) more than DMSO and ethanol. The broadness of the spectra was obtained to be comparatively almost equal in all of the three solvents. But the absorption band observed for D. distilled water as the solvent was the highest.
Erythrosin B and Tartrazine Y
Two photosensitizers that were being studied, were later mixed and dissolved in three types solvents, viz. ethanol, DMSO, D. distilled water; their optical properties were observed using UV-Vis Spectrophotometer. (Figure 4)
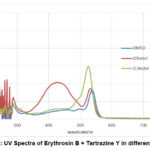 |
Figure 4: UV Spectra of Erythrosin B + Tartrazine Y in different solvent. |
When individually, these dyes showed the same solubility in solvents (Erythrosin B and Tartrazine Y in D. distilled water); when mixed, they showed good optical properties in D. distilled water.
Figure 4 shows the UV-Visible spectra of the solution of a “mixture of Erythrosin B and tartrazine Y”. It also shows the highest absorption, which is obtained in D. distilled water as a solvent rather than DMSO and ethanol. Also, Erythrosin B and tartrazine show good solubility in double distilled water other than DMSO and ethanol. The broadness of the spectra was found to be comparatively almost equal in all of the three solvents. But the absorption band was highest for that D. distilled water solvent.
Electrochemical parameter of DSSC
The I-V characteristics of devices were noticed under an illumination intensity of 100 mV/cm2. The typical I-V curves for DSSCs using Tartrazine, Erythrosin B and mixtures of these dyes in D. double distilled water, DMSO and ethanol are shown in Figures 5, 6 and 7. The I-V curves for the cell sensitized with Erythrosin B in DMSO, double distilled water, and ethanol are shown in Figure 5. In Figure 6, the I-V curve for the cell sensitized with tartrazine in DMSO, double distilled water, and ethanol is shown. The I-V curve for the mixture of tartrazine, Erythrosin B, and ethanol is shown in Figure 7, and the efficiency of these systems is given below the I-V curve.
Erythrosin B in different solvent ethanol
When Erythrosin B, planted in DSSC, its characteristics I-V curve was obtained (Figure 5).
 |
Figure 5: I-V Curve of Erythrosin B in different solvent. |
The I-V curve so obtained was used to derived the conversion efficiency (η), by using “short circuit current” (Isc) and Open circuit voltage (Voc). Characteristics fill factor was also calculated (Table 1).
Table 1: Electrochemical Properties of photosensitizer- Erythrosin B.
|
S. No. |
Name of Dye |
Solvent |
Voc (mV) |
Isc(mA) |
FF |
η (%) |
|
1. |
Erythrosin B |
Ethanol |
368 |
0.270 |
0.54 |
0.05 |
|
2. |
Erythrosin B |
DMSO |
360 |
0.278 |
0.64 |
0.06 |
|
3. |
Erythrosin B |
Double D. water |
380 |
0.301 |
0.63 |
0.07 |
Table 1 shows efficiency and FF of different cell systems with different solvent in which photosensitizer Erythrosin B is solubilized. For first system, having Erythrosin B in Ethanol, Voc as 368mV and Isc as 0.270 (mA) and the fill factor (FF) and efficiency as 0.54 and 0.05% were obtained respectively. In the Second system having Erythrosin B in DMSO Voc as 360mV and Isc as 0.278(mA) were obtained in which fill factor and efficiency were calculated as 0.64 and 0.06% respectively. Third system having Erythrosin B in double distilled water Voc as 380mV and Isc as 0.301(mA) were obtained and fill factor and efficiency were calculated as 0.63 and 0.07% respectively.
Tartrazine Y in different solvent
When Tartrazine Y was employed in DSSC; characteristic I-V curve was obtained (Figure 6).
 |
Figure 6: I-V Curve of Tartrazine Yellow in Different Solvent. |
The I-V curve so obtained was used to calculate fill factors and efficiencies of these cells made by dissolving Tartrazine Y in different solvents. (Table 2)
Table 2: Electrochemical Properties of photosensitizer- Tartrazine Y.
|
S. No. |
Name of Dye |
Solvent |
Voc (mV) |
Isc(mA) |
FF |
η (%) |
|
1. |
Tartrazine |
Ethanol |
400 |
0.370 |
0.55 |
0.08 |
|
2. |
Tartrazine |
DMSO |
350 |
0.342 |
0.73 |
0.08 |
|
3. |
Tartrazine |
Double D. water |
380 |
0.350 |
0.72 |
0.09 |
Table 2 shows the efficiency and FF of different cell systems in which the photosensitizer Tartrazine Y is solubilized in various solvents. For the first system, having Tartrazine Y in ethanol, a value of Voc of 400 mV and an Isc of 0.370 (mA) were obtained, and the FF and efficiency were 0.55 and 0.08%, respectively. In the second system, having Tartrazine Y in DMSO, the value of Voc as 350 mV and Isc as 0.342 mA were obtained, and the FF and efficiency were 0.73 and 0.08%, respectively. The third system, having Tartrazine in double distilled water, Voc as 380 mV and Isc as 0.350 mA, and the fill factor (FF) and efficiency were 0.72 and 0.09% respectively.
Tartrazine Yellow and Erythrosin B in different solvent
Both photosensitizers were later mixed and dissolved in various solvents. The solution prepared was employed in DSSC, and characteristic I-V curve was obtained (Figure 7) when connected in circuit. The I-V curves so obtained were used to calculate fill factors and conversion efficiencies of different cells (Table 3).
 |
Figure 7: Electrochemical Properties (I-V curve) of mixed photosensitizers. |
Table 3: Electrochemical Properties of mixed photosensitizers: Erythrosin B + Tartrazine Yellow.
|
S. No. |
Name of Dye |
Solvent |
Voc(mV) |
Isc(mA) |
FF |
η (%) |
|
1. |
Erythrosin B + Tartrazine Yellow |
Double D. Water |
420 |
0.409 |
0.65 |
0.11 |
|
2. |
Erythrosin B + Tartrazine Yellow |
DMSO |
400 |
0.395 |
0.51 |
0.08 |
|
3. |
Erythrosin B + Tartrazine Yellow |
Ethanol |
390 |
0.398 |
0.56 |
0.09 |
Table 3 shows the efficiency and FF of a cell system containing a photosensitizer mixture of Erythrosin B and Tartrazine solubilized in three type of solvents. Electrical parameters, such as Voc, Isc, and FF, were obtained as 390 mV, 0.398 mA, and 0.56 mV, respectively. Thus, the efficiency calculated was 0.09%. It can be noted that the mixing of dyes leads to an increase in both Isc and Voc. In the presence of a particular solvent, i.e., double distilled water, the maximum efficiency of the device assembled with TiO2 microparticles based photoanodes was obtained as 0.11% (where Isc = 0.409 mA, Voc = 420 mV, FF = 0.65, see Table 3). The result of Table 3 shows that the values of conversion efficiencies are altered by the solvent used for the dyes.
Though the values of voltage observed were good, the dyes still showed low conversion efficiency. This may occur due to low current generation by the dyes. A mixture of tartrazine and Erythrosin B showed Voc 400 mV, Isc 0.395 mA and FF 0.65 with an efficiency of 0.08% in DMSO. A mixture of tartrazine and Erythrosin B was institute to be the least efficient in DMSO.
Electrochemical Parameters of Photogalvanic cells
Variation of photo-potential and photo-current with interval of time were observed in these cells to obtain conversion efficiency. The storage capacity of solar cells also observed with this data.
The following conditions were laid in these experiments:
|
(Erythrosine + Tartrazine) = 2.0 x 10⁻⁵ M |
Temp. = 303 K |
|
[EDTA] = 1.62 x 10⁻³ M |
pH = 12.78 |
|
[NaLS] = 5.80 x 10⁻³ M |
Light Intensity = 10.4 mW cm-2 |
Photo-potential variation over time
The photogalvanic cell was positioned in the dark till it accomplished a steady potential, and then the platinum electrode was uncovered for the light. It was detected that potential changes in lighting and it reaches a constant value after a certain period. After the light source was detached, the path of change in potential was inverted and a stable photo-potential was yet again obtained after some time.
The variation of photo-potential of solar cells in “Erythrosin B + Tartrazine Y– EDTA-NaLS” system with reverence to time is given in Graph (Figure 8).
 |
Figure 8: Variation of Photo-Potential(mV) with Time (min.) for mixed photosensitizers system |
Variation of photo-current with time
It was observed that there was a quick rise in the photocurrent of the “Erythrosin B + Tartrazine – EDTA-NaLS” system on illumination. It reaches a maximum within a few minutes. This value is signified by imax. Then the current was originated to decrease progressively with the period of illumination, finally attaining a constant value at equilibrium. This value is characterized as Ieq. The photo-current was observed to decline on eliminating the source of illumination (Fig.9).
 |
Figure 9: Variation of Photocurrent with Time for mixed photosensitizers system. |
Performance of the photogalvanic solar cell
The implementation of the photo-galvanic cell was noticed by applying an external load (essential to have photo-current at the power point) after switching off the illumination, the moment the potential attains a constant value. The performance of a photovoltaic cell was determined in terms of expressions of t1/2, i.e., the time required for the drop of the output (power) to its half at power point. (PP) in the dark condition: It was noticed that the solar-cell can be used in dark for 80.0 minutes. All results are potted in Figure 10.
 |
Figure 10: Variation of Power with Time for mixed photosensitizer cell system |
Current-Potential (I-V) characteristics of photogalvanic solar cell
The short circuit photo-current/current (Isc) and open circuit photo-voltage (Voc) or potential of the photogalvanic solar cells were observed with the assistance of a multimeter (keeping the circuit closed). The current-voltage characteristics of the photogalvanic solar cells including “Erythrosin B + Tartrazine–EDTA- NaLS” cell system is graphically revealed in figure 11.
 |
Figure 11: Current – Voltage (i-V) physical characteristics of the Photogalvanic solar cell Click here to View figure |
It was experiential that photo-current verses photo-potential curve deviated from their consistent rectangular shapes. A point (cross sign in graph) in i-V curve, called power point (PP) was determined where the product of photo-current and photo-potential is highest and the fill-factor was calculated was 0.3174.
Conversion performance of photogalvanic solar cells
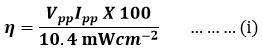
With the use of current and potential values at power point and the incident power of radiations, the photo-current conversion efficiency(η) of the photogalvanic cell was resolute as 0.6963% using the equation (i).
Conclusion
Role of Single and mixed dyes in DSSC
On analysis of the data, it can be concluded that the “Dye-sensitized solar cells” (DSSCs) containing mixed photosensitizer dyes are the most efficient cells among all the dye-sensitized solar cells fabricated under study. Erythrosin B+ Tartrazine Y has the highest Voc in distilled water as a solvent (420 mV); also, in single dye systems, Erythrosin B and Tartrazine Y individually, has the highest Voc in distilled water as well, 380 mV and 380 mV, respectively. Moreover, the highest results for Isc were obtained in double distilled water for a mixture of photosensitizing dyes at 0.409mA. Erythrosin B and Tartrazine Y obtained Isc (single dye system) are 0.301 mA and 0.350 mA, respectively. We conclude that a decent combination of photosensitizer mixing showed the highest Isc. Concluding to that, the highest conversion efficiency in DSSCs was obtained for systems containing a mixture of photosensitizers (η=0.11%) in double distilled (dd) water and the FF was 0.65; the individual dyes-Erythrosin B (η=0.07%; FF = 0.63) and Tartrazine Y (η = 0.09%; FF = 0.72) have their highest photo-current conversion efficiency in double distilled water.
Role of Single and mixed dyes in Photogalvanic Cell
On the basis of fill factor calculated, it was found that the most effective system is the Erythrosin Tartrazine-EDTA-NaLS system, showing better photo-electrical conversion results than dye-sensitized (DSSC) modules, which were sensitized with the same dyes in this solar cell data (Table 4).
Table 4: Current-potential characteristics of the solar cell for mixed photosensitizer systems.
|
System |
Voc (mV) |
Isc (mA) |
Vpp (mV) |
ipp (mA) |
h |
|
Erythrosin B + Tartrazine –EDTA-NaLS system |
1040 |
270 |
426 |
170 |
0.31 |
Performance of the photogalvanic solar cells in dark
When Photogalvanic solar cell was experimental in dark, the mixed photosensitizers (dye) system “Erythrosin B + Tartrazine –EDTA-NaLS system” showed power 72.42µW and half-life of 80.0 min in dark condition, which is quiet, advantageous over DSSC.
On the foundation of the power point and t1/2, it is measured that the “Erythrosin B + Tartrazine-EDTA-NaLS” cell system gives an 80.00 min half-life, which is better for solar cell fabrication purposes. In DSSC systems, the notable value of photo-current conversion efficiency is 0.11% for Erythrosin B + Tartrazine (D. Distilled Water Solvent) systems. Electrical parameters obtained for photogalvanic solar cell systems are quite stable for “Erythrosin B-Tartrazine-EDTA-NaLS” systems from a photo-energy conversion and performance viewpoint.
The value of photo-current conversion efficiency for the “Erythrosin B-Tartrazine-EDTA-NaLS” system is 0.31%. Similarly, the efficient cell system was a mixture of Erythrosin B and Tartrazine in dye-sensitized solar cells and photogalvanic solar cell techniques. “Mixture of Erythrosin B and Tartrazine” systems in DSSC as well as Photo-galvanic cell systems can be used for better photo-energy conversion and storage. In the existing effort, it was distinguished that mixed dye system shows the good parameters in both DSSC and photogalvanic system rather than single dye in solar cell systems due to wider solar radiation absorption; however, on comparing both DSSC and PG cell, PG cell are found to be more efficient.
Acknowledgement
Financially supported by the University Grant Commission under scheme-UGC-Junior Research Fellowship (Ref. No. 22/12/2013 (ii) EU-V. Dated-01/07/2014. Sr. No. 2121310375) to author Virendra Soni and RGNF (Ref. No. – F1-17.1/2015-2016/RGNF-2015-17-SC-RAJ-3012/SA-III/Website) to another author, Chanchal Mahavar, is highly acknowledged. The authors would also like to thank Defence Laboratory (D.R.D.O) Jodhpur for their generous support and characterization facility.
Conflict of Interest
The authors don’t dispute or have any conflicts of interest.
References
- Ellabban, Omar; Abu-Rub, Haitham; Blaabjerg, Frede; J. Renewable and Sustainable Energy Reviews. 2014, 39,748–764.
CrossRef - Li Q.; Cherian J.; Shabbir MS.; Sial MS.; Li J.; Mester I.; Badulescu A. Energies, 2021, 20;14(3),520.
CrossRef - Nagy K.; Körmendi K.; Applied Energy, 2012 ,96, 393-9.
CrossRef - Jurasz J.; Canales F.A.; Kies A.; Guezgouz M.; Beluco A.; Solar Energy, 2020, 19,703-24.
CrossRef - Ferreira A.C.; Silva J.; Teixeira S.; Teixeira J.C.; Nebra S.A.; Renewable Energy, 2020, 154, 581-97.
CrossRef - Trevor, J.; and Price,2005, 29 (3),191–200.
CrossRef - Sullivan I.; Zoellner B.; Maggard P.; Chemistry of Materials, 2016, 28(17),5999-6016.
CrossRef - Zheng X.; Zhang L.; Energy & Environmental Science, 2016, 9(8), 2511-32.
CrossRef - International Energy Agency. Solar Energy Perspectives: Executive Summary. Accessed May 2017 http://www.iea.org/Textbase/ npsum/solar2011SUM.pdf.
- Royal Society of Chemistry. Accessed May 2017 http://www.rsc.org/ campaigning out reach/global challenges/energy/.
- Becquerel, A.E.; J. Compt. Rend. Acad. Sci. Paris. 1839a 9,14.
- Becquerel, A.E.; J. Comptes Rendus de L’Academie des Sciences. 1839b, 9, 561- 567.
- Danuta Wróbel, Andrzej Boguta, Rodica M. Ion, Journal of Photochemistry and Photobiology A: Chemistry, 2001,138, (1), 7-22.
CrossRef - Chepelianskii A.; Entin M.; Magarill L.; et al. Eur. Phys. J. B, 2007,56, 323–333.
CrossRef - Henk J. Bolink, Luca Cappelli, Eugenio Coronado, Michael Grätzel, Enrique Ortí, Rubén D. Costa, Pedro M. Viruela, and Md. K. Nazeeruddin, Journal of the American Chemical Society, 2006, 128 (46), 14786-14787.
CrossRef - Tachibana Y.; Muramoto R.; Matsumoto H.; et al., Res Chem Intermed, 2006, 32, 575–583.
CrossRef - Chepelianskii A.D.; Entin M.V.; Magarill L.I.; Shepelyansky D.L.; Physica E: Low-dimensional Systems and Nanostructures, 2008, 40(5),1264-1266
CrossRef - , E. J.; Xie, H.-Y.; Pesin, D. A.; and Levchenko A.; Phys. Rev. B, 2017, 96, 075123.
CrossRef - S.; Kumar S.; Genwa M.; Meena P. L.; Mater. Res. Express, 2021, 8, 115507
CrossRef - O.; Yadav S.; Central Asian Journal of Theoretical & Applied Sciences, 2022, 11;3(7), 78-83.
- Yadav, S.; and Lal, C.; J. Proceedings of the Institution of Mechanical Engineers, Part A: Journal of Power and Energy. 2010, 224, 985
CrossRef - Gangotri, Bhimwal and Mahesh. J. International Journal of Energy Research. 2010, 35, 545 – 552.
CrossRef - Koli, P.; Sharma, U.; and Gangotri, K. M.; J. Renewable Energy. 2012, 37(1), 250-258.
CrossRef - Genwa, K.R.; and Arun, K.; J. Int. J. of Renewable Energy Technology. 2012, 3(2), 174 – 188.
CrossRef - Mall C.; Solanki P.P.; Energy Reports, 2018, 4, 23-30.
CrossRef - Yadav S.K.; Kumari R.; Gunsaria R.K.; Journal of Advanced Scientific Research, 2022, 13(04), 12-8.
- Koli P.; Arabian journal of chemistry, 2017, 10(8), 1077-83.
CrossRef - Genwa, K.R.; and Sagar C. P.; Journal of Chemical Engineering and Materials Science, 2011,2:9,140-148.
- Yum, J.H.; Jin, M. S.; Baker, Robin, H.; Karlsson, K. M.; Hagberg, D. P.; Marinado, T.; Hagfeldt, A.; Sun, Licheng.; Grätzel, M.; and Nazeeruddin, Md. K.; The Journal of Physical Chemistry C. 2009, 113 (38), 16816-16820.
CrossRef - Bisquert, J.; Santiago, F. F.; Cevey, L.; Chen, P.; Wang, M. K.; Zakeeruddin, S.M.; and Grätzel, M.; J. Am. Chem. Soc. 2009, 131(2),558.
CrossRef - Naik P; Su R; Elmorsy M.R.; Babu D.D; El-Shafei A; Adhikari A.V; Journal of Photochemistry and Photobiology A: Chemistry, 2017, 345,63-73.
CrossRef - Carella A.; Borbone F.; Centore R.; Frontiers in chemistry, 2018, 6,481.
CrossRef - Abdellah I.M.; Koraiem A.I.; El-Shafei A.; Dyes and Pigments, 2019, 164, 244-56.
CrossRef - Amogne N.Y.; Ayele D.W.; Tsigie Y.A.; Materials for Renewable and Sustainable Energy, 2020, 9(4), 1-6.
CrossRef - Chan Y.F.; Wang C.C.; Chen C.Y.; Journal of Materials Chemistry A, 2013, 1(18), 5479-86.
CrossRef - Abu Talip R.A.; Yahya W.Z.; Bustam M.A.; Sustainability, 2020, 12(18), 7598.
CrossRef - Bose S.; and Genwa K. R.; Mater. Sci. Pol., 2018, 36(3), 1-10.
CrossRef - Grätzel, M.; J. Photochem. Photobiol. A, 2004, 164,3-14.
- Ammar A.M.; Mohamed H.S.; Yousef M.M.; Abdel-Hafez G.M.; Hassanien A.S.; Khalil A.S.; Journal of Nanomaterials, 2019, 2019,1-10.
CrossRef - Shalini S.; Prasanna S.; Mallick T.K.; Senthilarasu S.; Renewable and Sustainable Energy Reviews, 2015; 51,1306-1325.
CrossRef - Genwa, K.R.; Mahavar, C.; and Soni, V.; i-manager’s journal on material science. 2019, 6, 45-58.
- Richhariya G.; Kumar A.; Optical Materials, 2018, 79, 296-301.
CrossRef - Koli, P.; J. Power Sources. 2015, 285, 310-317.
CrossRef - Genwa, K.R.; Singh S.P.; J. Asian J. Chem. 2017, 29(6), 1215-1219.
CrossRef - Chouhan A.; Genwa K.R.; Energy, 2011, 2(1), 18-24.
CrossRef - Koli P.; Dayma Y.; Pareek R.K.; RSC advances, 2019, 9(13), 7560-7574.
CrossRef - Huynh T.P.; Hoang T.T.; Nguyen P.H.; Tran T.N.; Nguyen T.V.; 34th IEEE Photovoltaic Specialists Conference (PVSC), 2009, Jun 7 (pp. 002168-002171).
CrossRef - Gunasekaran M.; Ichimura M.; Solar Energy Materials and Solar Cells, 2007,91(9),774-778.
CrossRef

This work is licensed under a Creative Commons Attribution 4.0 International License.
About The Author
![]()
A New Edition of Web of Science
Journal Impact Factor
2022: 0.5
Five Year: 0.8
Journal is Indexed in

Cabells Whitelist
![]()


