Synthesis, Spectral Characterization on Bioactive Complexes Containing Schiff Base Ligand.
Suman Banoth, Suryasri Erukala and Sunkari Jyothi*
Department of Chemistry, Kakatiya University, Warangal-506009,India.
Corresponding Author E-mail: sumanbanoth2020@gmail.com
DOI : http://dx.doi.org/10.13005/ojc/380424
Article Received on : 27 Jul 2022
Article Accepted on :
Article Published : 18 Aug 2022
Reviewed by: Dr. Likaa Khalid
Second Review by: Dr. Md. Shadab Rizvi
Final Approval by: Dr. Vandana Magarde
Synthesis of metal complexes has been made possible by the Schiff base ligand (2,2'-diphenylenebis(1,2-phenylenebis(azanylylidene)) bis(methanylylidene))diphenyl. The ligand was synthesised by condensing 3-hydroxythiophene-2-carbaldehyde and benzene-1,2-diamine. UV-Visible, FT-IR, and certain physiochemical studies validated the structural and spectral features of the ligand and metals. For Schiff bases, it was found that the N and O atoms have been identified as ligand binding sites for metal ions. Evidence from molar conductance measurements suggests that the complexes are not electrolytic. TLC analysis was used to check the total responses. In addition to the tetrahedral geometry predicted by magnetic susceptibility data, electronic spectra for the [ZnC16H10O2N2S2], [SnC16H10O2N2S2], [VOC16H10O2N2S], [MgC16H10O2N2S] complexes indicated a square planar geometry, And their activity tested for using a disc diffusion technique.
KEYWORDS:Antibacterial activity; In Vitro; Metal complex; Spectral analysis
Download this article as:| Copy the following to cite this article: Banoth S, Erukala S, Jyothi S. Synthesis, Spectral Characterization on Bioactive Complexes Containing Schiff Base Ligand. Orient J Chem 2022;38(4). |
| Copy the following to cite this URL: Banoth S, Erukala S, Jyothi S. Synthesis, Spectral Characterization on Bioactive Complexes Containing Schiff Base Ligand. Orient J Chem 2022;38(4). Available from: https://bit.ly/3Axf5BP |
Introduction
When primary amines combine with carbonyl compounds, schiff bases are produced. Because of their potential as physiological, analytical, and antibacterial reagents, schiff bases have attracted a lot of attention.1 Schiff bases have been utilized, and they may be made from a wide variety of carbonyl compounds and amines2-3. Schiff base oxygen and nitrogen donor transition metal complexes have a unique configuration, structural liability, and sensitivity to their molecular environment4-7. The lanthanides, often known as lanthanos, constitute the longest series in the periodic table8. In 4f, there is a series of internal transitions9. Enormous lanthanide (III) ions are useful for stable complexes with high coordination numbers because of their large sizes10. Only a few studies have been done on Schiff base complexes containing lanthanides11.
Drug-binding sites are provided by the complex’s metal ions in the centre. Several compounds showed antibacterial, antitumor, anticancer, antifungal properties adding to the growing body of evidence that these compounds represent a significant class of molecules with important medical and pharmaceutical applications12-17. Schiff bases biological action derives from the azomethine bond. Only a few number of N, O donor Schiff bases and associated metals have been synthesised by our group recently18. Schiff base-ligand containing compounds generated from 3-hydroxythiophene-2-carbaldehyde and o-phenylenediamine are described here19.
Materials and Methods
They all have to be Analar or chemically pure. A wide variety of metal (II) nitrates and chlorides were utilised. Distillation was used to remove impurities from solvents such as petroleum ether, acetonitrile, chloroform, diethyl ether, DMSO, acetone, ethanol, methanol, and DMSO.
Synthesis of Schiff base Ligand C16H12O2N2S2
In a clean, round-bottomed flask, 20 mmole of 3-hydroxythiophene-2-carbaldehyde (2.1 ml) was condensed with 10 mmole (1.08 gm) of o-phenylenediamine to make the ligand. We used hot ethanol to dissolve the o-phenylenediamine and 20ml of ethanol to dissolve the 3-hydroxythiophene-2-carbaldehyde. The solutions were combined and allowed to reflux for around 3-4 hrs. To extract moisture, the resultant yellowish substance was dried in vacuum autoclave over anhydrous CaCl2 before being rinsed with alcohol, acetone, and diethyl ether.TLC was used using a variety of solvents to determine the ligand purity. In addition to methanol and chloroform, DMSO was also shown to be effective in dissolving the product. In fact, at 3400C, it yielded 87%. (Scheme-1).
Synthesis of Metals with Schiff base ligand C16H12O2N2S2.
Synthetic complex are written as [M(SB),] where M is one of the metal ions Zn(II), VO(II), Sn(II), or Mg(II) and SB is the synthesised Schiff base ligand C16H12O2N2S2. To accelerate the functionalization action, a 15ml methanol extract sample solution Zn(II) nitrate hexahydrate (0.2975g, 1mmol), Sn(II) chloride tetrahydrate (0.261g, 1mmol), VO(II) sulphate tetrahydrate (0.235g, 1mmol), and Mg(II) chloride hydrate (0.203g, 1mmol) was stirred On cooling, a colourful solid was produced, then rinsed in methanol, acetone, as well as ether before drying in a vacuum over anhydrous CaCl2. Different solvents were employed for TLC analysis. Target Schiff bases and metal complexes are presented in (Scheme-2).
Result
Thermal characteristics, colour, pH, conductivity, and activation energy of compounds are listed below. Above 3000C, the complexes become a luminous powder. Low molecular conductance values (7-9 S/cm) in water and DMSO (10-3M) demonstrate the complexes are non-electrolytes (Table-2).
 |
Scheme 1: Synthesis of Schiff base ligand C16H12O2N2S2. |
 |
Scheme 2: Synthetic route of metals, M= Zn(II), Sn(II), VO(II), and Mg(II) ion. |
Table 1: Physical and Analytical complex, ligand characteristics.
|
Compound |
Colour |
Molecular Weight |
Yield(%) |
Melting Point
|
Activation Energy, E kj/mol |
Conductivity μS/cm |
|
Ligand C16H12O2N2S2 |
Yellow |
328.70 |
80 % |
1550C – 1650C |
20.78 |
– |
|
[Zn C16H10O2N2S2] |
Lemon |
393.43 |
75 % |
2100C – 2150C |
25.20 |
2 |
|
[Sn C16H10O2N2S2] |
Metallic gold |
446.27 |
61 % |
above 3000C |
16.74 |
5 |
|
[VO C16H10O2N2S] |
Olive |
394.02 |
82 % |
above 3000C |
18.56 |
3 |
|
[Mg C16H10O2N2S] |
Lemon |
352.02 |
78 % |
above 3000C |
17.20 |
6 |
Table 2: FTIR spectral information of the ligand and metals.
|
Ligand/Metals
|
IR/cm-1 |
||||||
|
υ(O-H) |
υ(C=N) |
υ(C-O) |
υ(M-O) |
υ(M-N) |
|||
|
C16H12O2N2S2 |
3466 |
1614 |
1193 |
– |
– |
||
|
[Zn C16H10O2N2S2] |
3435 |
1607 |
1180 |
533 |
448 |
||
|
[Sn C16H10O2N2S2] |
3434 |
1605 |
1188 |
538 |
490 |
||
|
[VO C16H10O2N2S] |
3435 |
1606 |
1192 |
542 |
486 |
||
|
[Mg C16H10O2N2S] |
3434 |
1609 |
1181 |
538 |
466 |
||
Spectral data of Schiff Base ligand [C16H12O2N2S2]
Condensation between the CHO moiety of 3-hydroxythiophene-2-carbaldehyde and the –NH2 moiety of O-phenylenediamine was derived from the strong absorption band at 1614 cm-1 in ligand spectra. The hydroxyl group (O-H) was assigned to the 3466 cm-1 . A sharp band at 1193 cm-1 for (C-O) indicates the existence of a C-O bond in Schiff base ligand (Fig-1). Data for FTIR spectra of Schiff base and metal complexes are shown in table 2. The electronic absorption spectra and magnetic moments of ligands bound to transition metals are shown here (Table-3). It was revealed in the 1H NMR spectrum of complexes 1–5 that the complexation process was confirmed. The complexes lacked the prominent peak, (OH) at 8.25 ppm, in their 1H NMR spectra that was present in the ligand HL spectra. That is, they were not present in any of the other spectra. 328.70 is the molecular weight of the Schiff base ligand.
 |
Figure 1: Mass spectra of Schiff base ligand. |
 |
Figure 2: IR spectra of Schiff base ligand. |
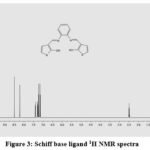 |
Figure 3: Schiff base ligand 1H NMR spectra. |
Table 3: ligands and metals electronic spectra and magnetic moments.
|
Compound |
λ max n.m |
Wave Number cm-1 |
μ eff /B.M |
Assignment |
|
C16H12O2N2S2 |
277 339 |
36101 25062 |
– |
π→π* n→π* |
|
[VO C16H10O2N2S] |
265 323 400 |
37735 30959 24691 |
1.40 |
π→π* n→π* C.T (M→L) |
|
[Mg C16H10O2N2S] |
269 297 338 395 |
29585 37174 33670 24691 |
0.48 |
n→π* π→π* π→π* C.T (M→L) |
|
[Zn C16H10O2N2S2] |
265 296 321 395 |
31152 37735 33783 24691 |
0.86 |
n→π* π→π* π→π* C.T (M→L) |
|
[Sn C16H10O2N2S2] |
267 325 394 |
37453 30769 25380 |
0.60 |
π→π* n→π* C.T (M→L) |
Spectral data of [Zn C16H10O2N2S2] complex
Free ligand’s azomethine υ(C=N) stretching frequency caused a significant absorption maxima at 1614 cm-1.The Zn(II) UV–Vis spectra show three absorption peaks at 265, 296 and 321 nm. When bound to Zn(II), the ligand UV spectra at 277 nm and 339 nm are changed. The 265nm and 296nm peaks are πgπ* transitions, whereas the 321nm peak is ngπ*. The 1H NMR spectra of the –N=CH– is identified at 8.51 (s) and Aromatic is identified at 7.01–7.45 (m).
 |
Figure 4: Electronic spectra of Zn Complex. Click here to View figure |
 |
Figure 5: Mass spectra of Zn Complex. |
Spectral data of [Sn C16H10O2N2S2] complex
The stretching frequency of the azomethine υ(C=N) in Sn complexes decreases from 1614cm-1 to 1605cm-1 There is no (O-H)-induced 3466 cm-1 band. In the unbound ligand, the υ(C-O) stretching vibration has a frequency of 1193 cm-1, although in the coordinated complex, it has a frequency of 1188 cm-1. There is a intensity band at 538 cm-1 due to M-O bonding, while the M-N bonds are responsible for the bands at 490 cm-1.The [SnH10O2N2S2] complex’s UV–Vis spectra show three prominent absorption bands at 267, 325, and 394 nm. Both peaks, which exhibit themselves at 267 nm and 325 nm, respectively, the compound exhibited a strong band at 394 nm of the azomethine chromophore, and a second band at 330 nm. The –N=CH– signal can be seen in the 1H NMR spectrum at 8.52(s), and the aromatic signal can be found in the range of 7.01–7.45 (m).
 |
Figure 6: Electronic spectra of Sn Complex |
 |
Figure 7: Mass spectra of compound Sn Complex. |
Spectral data of [VO C16H10O2N2S] complex
The band that was previously located at 1614 cm-1 in VO(II) complexes shifted to 1606 cm-1 as a result of azomethine υ(C=N) stretching. For ligands in complex spectra, an increase in υ(C-O) stretching vibration from 1193 cm-1 to 1192 cm-1 shows that VO(II) has been coordinated by de protonated phenolic oxygen. M-O bonds produce the 542 cm-1 medium-intensity bands, where as M-N bonds generate the 486 cm-1 bands. Among other bands, the vanadyl complex exhibits the characteristic 980 cm-1. The compound’s UV–Vis spectra reveal strong absorption bands at 265, 323 and 400 nm. There are two peaks in the absorption spectrum of azomethine nitrogen due to the single electron pair in its anti-bonding p orbital one at 265 nm, There is a 400 nm absorption band for a charge transfer ligand.The –N=CH– signal can be seen in the 1H NMR spectrum at 8.52(s), and the aromatic signal can be found in the range of 7.01–7.45 (m).
Spectral data of [Mg C16H10O2N2S] complex
In the spectra of the Mg(II) complex, the azomethine υ(C=N) stretching frequency shifted from 1614 cm-1 to 1609 cm-1, pointing to the fact that coordination occurs via N atoms. Protonation of a phenolic oxygen in the free ligand is indicated by the change in the υ(C-O) stretching vibration from a 1193 cm-1 to 1181 cm-1 in the spectra of the coordinated complex, which indicates the synthesis of weaker C-O(Mg) bonds. The medium-intensity bands at 538cm-1 and 466cm-1 are like wise attributed to M-O and M-N bonds. Three prominent absorption bands, at 269, 297, and 338 nm, may be seen in UV–Vis spectra of the [MgH10O2N2S] complex. The 269 nm ,πgπ* transition peak is caused by the azomethine nitrogen lone pair of electrons in its antibonding p orbital, whereas the 297 nm and 338 nm peaks are attributed to the ngπ* transition. An absorption band at 395 nm was identified in the case of a ligand-to-metal charge transfer molecule.The –N=CH– signal can be seen in the 1H NMR spectrum at 8.20(s), and the aromatic signal can be found in the range of 7.01–7.45 (m).
Antibacterial activity
Antibacterial susceptibility testing’s primary aim is to discover pathogens that are resistant to commonly used antibiotics. Various species of Bacillus cereus, Shigella boydii, Escherichia coli Enterobacter, and Shigella sonnei, Salmonella typhimurium , used to test the antibacterial activities of free Schiff base ligands and their metal complexes. The paper disc diffusion technique was used to evaluate the compounds in DMSO solution at a level of 50 g/0.01 ml. Table 4 shows the diameter (in millimetres) of the zones of susceptibility. Susceptibility zones are disc penetration zones that are poisonous to microorganisms. Schiff base and metals inhibited the growth of all of the bacterial species studied (Table-4).
Table 4: Schiff base and metal complex antibacterial screening activities.
|
Tested Bacteria |
Compounds’ zone inhibition (mm) |
Kanamycin (30μg/disc) |
||||
|
C16H12O2N2S2 |
[ZnH10O2N2S2] |
[SnH10O2N2S2] |
[VOH10O2N2S] |
[MgH10O2N2S] |
|
|
|
Salmonella typhinium |
12 |
13 |
10 |
12 |
12 |
25 |
|
Bacillus subtilis |
10 |
10 |
12 |
10 |
12 |
25 |
|
Shigellaboydii
|
10 |
11 |
13 |
14 |
10 |
22 |
|
Shigellasonnei
|
8 |
11 |
– |
12 |
12 |
22 |
|
E.coli |
11 |
9 |
11 |
13 |
10 |
25 |
|
Enerobacter |
10 |
9 |
12 |
10 |
10 |
24 |
|
Bacillus cereus |
13 |
14 |
11 |
12 |
13 |
20 |
|
DMSO control |
– |
– |
– |
– |
– |
30 |
Conclusion
In this study, we report the Schiff base ligand and metals of Zn(II), Sn(II), VO(II), Mg(II), ions were synthesised and characterised in this work.. IR spectroscopy revealed that the core metal atom is coordinated to N and O atoms. The tetrahedral-shaped complexes of [Zn C16H10O2N2S2], [Mg C16H10O2N2S] [Sn C16H10O2N2S2], were suggested because of their high magnetic moments, UV-Vis absorption, and synthesis. Square planar geometry characterises the [VOC16H10O2N2S]. A comparison of the ligand and its metal complexes to a conventional antibiotic revealed mild to substantial antibacterial activity (Kanamycin). Metal complexes inhibited better than Schiff base ligand.
Acknowledgement
The authors thank the Director of the Indian Institute of Chemical Technology, Hyderabad. As well as Kakatiya University’s Department of Chemistry. And Director of Center for Cellular and Molecular Biology Hyderabad, For delivering spectral data and biological activity.
Conflict of Interest
There are no competing interests between the authors and the publication in this work.
References
- Yousif, E., Adil, H., Farina, Y., 2010. J. Appl.Sci. Res. 6 (7), 879–882.
- Ahmad, A., Rafatullah, M., Sulaiman, O., Ibrahim, M.H., Hashim,R., 2009. J. Hazard. Mater. 170,357–365.
CrossRef - Ajmal, M., Khan, A.H., Ahmad, S., Ahmad, A., 1998. Water Res. 32,3085–3091.
CrossRef - Md. Saddam Hossain, C.M. Zakaria, M.M. Haque, and Md. Kudrat-E- Zahan. International Journal of Chemical Studies 2016; 4(6): 01-04.
- M.F. Ali Ahmed , V.M. Yunus, Orient J Chem. 2014; 30: 111-117.
CrossRef - Yousif, E., Adil, H., Farina, Y., 2010a. J. Appl.Sci. Res. 6 (7), 879–882.
- Barakat, M.A., 2011. Arabian J. Chem. 4, 361–377.
CrossRef - Annapoorani, S., Krishnan, C., 2013. international. J.ChemTech Res. 5 (1), 180–185.
- G. Kumari, D. Kumar, C.P. Singh, A. Kumar, V.B. Rana, J Serb Chem Soc, 2010; 75: 629-663.
CrossRef - Shayma A. Shaker. E-Journal of Chemistry; 2010, 7(S1), 580-586.
- Sunita Bhanuka and Har Lal Singh, Rasayan J. Chem., 2017, 10(2), 673-68.
- Neelofar, Nauman Ali, Shabir Ahmad, NaserM. Abdel-Salam, RiazUllah, Robila Nawaz and Sohail Ahmad, Tropical Journal of Pharmaceutical Research. 2016, 15(12): 2693-2700.
CrossRef - Elzahany, E., Hegab, K., Khalil, S., Youssef, N., 2008. Aust. J. Basic Appl. Sci. 2 (2), 210–220.
- Zhou, Y., Wang, S.X., Zhang, K., Jiang, X.Y, 2008. Angew. Chem. 120, 7564–7566.
CrossRef - N. K. Gondia,J. Priya,S. K. Sharma, Res Chem Intermed, 2017, 43:1165–11783.
CrossRef - Pallavee Guptha, Dhananjay Dwivewdi and Vijay R. Chourey Orient. J. Chem 2021, Vol. 37, No.(1): Pg. 25-32.
CrossRef - Karthik Somasundaram , Gomathi Thulasimani and Vedanayaki Subramaniam Orient. J. Chem 2021, Vol. 37, No.(1).
CrossRef - D. G. Anuse, V. J. Desale , B. R. Thorat , D. D. Anuse, S. G. Jagadhani, K. George Abraham and R. S.Yamagar Orient. J. Chem 2021, Vol. 37, No.(1).
CrossRef - G. Pandimuthu P. Muthukrishnan , S. Rameshkumar , K.
Paramasivaganesh and A. Sanka Orient. J. Chem 2021, Vol. 37, No.(4).
CrossRef - K. P. Srivastava, U. S. Yadav ,Pragya Singh Orient. J. Chem 2021, Vol. 37, No.(4)
CrossRef

This work is licensed under a Creative Commons Attribution 4.0 International License.
About The Author
![]()
A New Edition of Web of Science
Journal Impact Factor
2022: 0.5
Five Year: 0.8
Journal is Indexed in

Cabells Whitelist
![]()


