Spatial Distribution of Selected Trace Metals at Tropical Riverine System
Li Qing Ng , Khairul Nizam Mohamed* and Nazerita Lasumin
Department of Environmental Sciences, Faculty of Forestry and Environment, Universiti Putra Malaysia, 43400 UPM Serdang, Selangor, Malaysia.
Corresponding Author E-mail: k_nizam@upm.edu.my
DOI : http://dx.doi.org/10.13005/ojc/380416
Article Received on : 19 Mar 2022
Article Accepted on :
Article Published : 26 Aug 2022
Reviewed by: Dr. Ashutosh Pal
Second Review by: Dr. FASIULLA
Final Approval by: Dr. Luigi Campanella
This study determined the distribution of selected trace metals (Cu, Cd, Zn and Pb) in the dissolved and particulate samples at Sungai Buloh river, Malaysia. The dissolved Zn, Cd, Cu and Pb concentration along the river was in the safety range. The dissolved and particulate Zn, Pb, Cu and Cd concentration was measured and recorded. We found that most of the metals exist in the particulate form and a consistent distribution coefficient (KD) value indicated a low metals deposition occurred along the river. Therefore, it could suggest that most of the anthropogenic input in the upper stream was transported along the river and it might deposited at the estuarine of the river, which could affect the safety level of these metals at the surface sediment and in the aquatic organisms in the study area.
KEYWORDS:Chelex-100 Resin; Dissolved Metals; Particulate Metals; Riverine; Spatial Distribution
Download this article as:| Copy the following to cite this article: Ng L. Q, Mohamed K. N, Lasumin N. Spatial Distribution of Selected Trace Metals at Tropical Riverine System. Orient J Chem 2022;38(4). |
| Copy the following to cite this URL: Ng L. Q, Mohamed K. N, Lasumin N. Spatial Distribution of Selected Trace Metals at Tropical Riverine System. Orient J Chem 2022;38(4). Available from: https://bit.ly/3e0P4lz |
Introduction
Estuarine and coastal areas, being the interaction zone between fresh and marine waters, are highly complex due to tidal currents and waves 1. Unlike the comparatively steady-state situation of open ocean water, the estuarine system is a point where a free-flowing river meets the ocean in a dynamically variable condition. Consequently, it is one of the pathways where heavy metals discharge from the river into the ocean 2.
Heavy metals are among the most common and significant environmental pollutants 3. The presence of these heavy metals in the environment, especially aquatic ecosystems, could lead to health problems if being consumed by living organisms such as cockles over a long period of time. Exposure to a high level of metal contaminants over a long time may lead to adverse effects on organisms, the aquatic environment, and human health 4. Heavy metals remain in the environment as highly toxic micropollutants and might cause adverse effects to living organisms. All the metals will be uptake by the phytoplankton and marina biota, which are eventually consumed by humans 5. The dissolved metals will enter the food web, which can cause biomagnification.
River of Sungai Buloh is located on the West Coast of Peninsular Malaysia. The main economic activities in the Sungai Buloh River are cockles farming, especially at the river mouth. This is the largest cockles producing area in Malaysia and Southeast Asia 6. It is vital to have more knowledge of estuarine systems since this is the primary economic source of cockles, and it will be supplied to markets where humans will be the final consumers. From a previous study conducted by 7, the concentration of Cadmium (Cd), Copper (Cu), Lead (Pb) and Zinc (Zn) in cockles was under the safe level set by the Malaysian Food Act (1983) and Regulations (1985). However, the anthropogenic activities in this area are getting higher, which might affect the habitat of the cockles. No recent related study of the distribution of dissolved metals was found in this area. Furthermore, the metals in the aquatic biota, such as cockles, are in direct interaction with the metals in the surface water, suspended matter, sediment and interstitial water 7. The concentration of metals in this area is crucial to understand the distribution of heavy metals.
Most of the studies conducted at Sungai Buloh was related to the water quality index, which includes the parameter of dissolved oxygen (DO), biochemical oxygen demand (BOD), chemical oxygen demand (COD), total suspended solids (TSS), ammonia nitrogen (AN) and pH 8-10. There is a limited study being conducted on the concentration of dissolved metals in the Sungai Buloh river. The Water Quality Index (WQI) in Sungai Buloh river was studied by 9, who stated that contamination of water is below the standard of DOE Class I (drinking) and Class II (industrial) water standard. However, there is no data on the concentration of dissolved metals have been reported during their study. Besides, a few studies related to the trace metals distribution in the area were determined in the fresh water and sediment samples 11-15. Less study was conducted to identify the concentration of dissolved metals in the estuaries water due to the high chloride ion in the water sample. The analysis of trace metals in the seawater sample is challenging due to the seawater matrix issue. The uniqueness of seawater matric elements such as Na, K, Ca, Mg and Cl require complicated analytical methodology 16. The interference of other elements in seawater raises the problem of analysis of metals concentration. In this present study, the pre-concentrated method by using chelex-100 resin was applied to separate the selected elements from the seawater sample 17-20. The Chelex-100 resin cation exchange (Na form) can overcome the problem of interference of salt matrix 20. Inductively Coupled Plasma Mass Spectrometry (ICP-MS) was used for concentration determinations 21. Data of the dissolved metal concentration in the seawater is scarce in Malaysia due to their trace level existence and the complex analytical technique. This fact triggered the need for this research to obtain the data of dissolved metals in the Sungai Buloh river. This study aims to determine the spatial distribution of the trace metals at the Sungai Buloh river.
Material and Methods
Study area and sampling
Sungai Buloh is located in the northern quarter of the Petaling region, Selangor. Sampling was conducted in early May 2018 at Sungai Buloh river. An 8 sampling point was selected from upstream to the downstream of the river. The coordination point for each station was recorded by using Garmin GPSMAP 64s (Table 1), and the map was plotted using ArcGIS (Figure1). The sampling points are marked as SB1 to SB8, indicating Station 1 to Station 8, respectively (Figure 1). The depth of each station was recorded by using a depth finder. The water samples were collected by using a Van dorn water sampler at the middle layer of each station. 1 L of water sample was collected in each sampling point into 1 L polytetrafluoroethylene (PTFE) (Nalgene) bottle then stored in an ice box. In-situ parameters measurement such as temperature, pH, DO, and salinity were determined directly in each sample point using a calibrated YSI Professional Plus Multi-Parameters (603190 Pro Plus multi-prop).
 |
Figure 1: The map of Peninsular Malaysia and the sampling point location. Point of SBS indicate the surface sediment sampling point by 11which SBS 1, SBS2 and SBS3 have the similar sampling point as SB 1, SB2 and SB7. |
Sample Pre-treatment
All glassware and bottle samples were pre-cleaned and soaked for at least 24 hours in 5% HNO3, then rinsed with MilliQ water to minimise the mineral contamination 22. All the clean apparatus were used only when it was fully dried. All chemicals are prepared by the gravimetric method to increase accuracy as the temperature of the solvent can be ignored.
A 1.0 L water sample in each sampling point was filtered through a 0.45µm pore size cartridge cellulose acetate filter paper (Whatman) immediately after sampling. The filter paper was dried until constant weight under room temperature. The filtered water sample was acidified to pH < 2 by 65% nitric acid (Merck) and stored in the refrigerator (4°C )to stabilise the metal ions in the water samples for further analysis.
Metal Concentration Analysis
Water samples were pre-concentrated by using Chelex-100 resin following the method suggested by 23-24. This Chelex-100 is applied for the separation of trace elements in various samples such as seawater and urine samples 25. The separation of trace metals by using the Chelex-100 resin requires the least chemicals and low analytical blanks compared to other isolation methods 17. The major advantage of this method is that the seawater samples can be transferred directly to the plastic bottle used in the pre-concentration on Chelex-100. A 100 mL of water samples was pre-concentrated at pH 5.0 to 5.5. A 4 mL of 1.0 M ammonium acetate was added to the column for activation. A 100 mL of samples were added into the column slowly. Next, 40 mL of 1.0 M ammonium acetate was added, followed by 10 mL of 2.5 M HNO3 for eluting the sample. The First 3 mL of sample was discharged, and another 7 mL of samples were collected into a centrifuge tube 23. The volume of the sample was increased to 30 mL by adding MilliQ water. Determination of dissolved metals in seawater was performed using the Inductively Coupled Plasma Mass Spectrometry (ICP-MS) (Perkin Elmer, model Elan DRC-e).
Acid digestion suggested by 26 was applied to extract the metals from the particulate sample. The particulate metals (size > 0.45 µm) retained on the cellulose acetate filter paper were analysed by using ICP-MS after acid digestion to obtain the concentration of particulate metals 26.
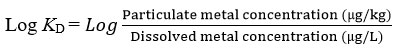
The distribution coefficient of heavy metal
The distribution coefficient (KD) of heavy metal between the dissolved (< 0.45 µm) and particulate (> 0.45 µm) phase were measured. It is calculated to determine the distribution of the selected metals in the environment 27-28. The equation for the log KD was shown below 26,29:
Results and Discussion
Physical-chemical Properties
During our sampling activity, we have recorded in-situ parameters in each sampling point. All the in-situ parameters are listed in Table 1 below.
SB 8 has the highest salinity, which was 20.67 ppt (Table 1). Salinity at SB 1 to SB7 was considered as fresh water and SB 8 as brackish water (estuaries system) as seawater mix with the freshwater at this area 30. The salinity at SB 7 was 0.14 ppt as this sampling point is located near the estuaries system (Figure 1). SB 8 was the highest total dissolved solid compared to the other stations, 22398.83 mg/L (Table 1). 31 reported that the salinity is approximately the same as the total dissolved solids. Thus, our study area includes two different water type: freshwater station (SB1 – SB7) and brackish water station (SB8).
In the study area, the pH of the water was in the acidic range (5.84-6.89) (Table 1). SB 8 was the highest pH, 6.89 (Table 1), among all the stations. This might be due to the sampling point of SB1 to SB7 were located in the river system, while SB8 was in the estuary system. The estuary system has a higher pH due to the mixing of seawater. According to 32, most natural freshwater has a pH value range from 6.5 to 8.0, while the pH of marine water is close to 8.2. The range of pH from 6.5 to 9.0 is mainly appropriate for aquatic life 33. However, SB 7 showed a slightly acidic, 5.8 (Table 1) compared to the class IIA in National Water Quality Standard, which is in the range of 6-9. It might be due to the runoff of agricultural waste into the river water. The nitrification of NH3, which is mainly found in fertiliser, can cause acidification of soil 34. The main activities around SB 7 are agriculture activities.
Dissolved oxygen in water at Sungai Buloh river ranged between 0.27-3.48 mg/L (Table 1). SB 8 was recorded the highest dissolved oxygen (3.48 mg/L) (Table 2), and SB6 had the lowest dissolved oxygen (0.27 mg/L) (Table 1). Dissolved oxygen in all stations at Sungai Buloh river was lower than the National Water Quality Standard (5-7 mg/L). This might be due to the presence of several industries along with the river discharge industrial effluent into the river system 9. Temperature is in the range of 30.20 – 32.30°C (Table 1). The lowest temperature was found in SB1 while the highest temperature was found in SB8.
Table 1: In-situ parameter in Sg Buloh river, Selangor was taken on 12 May 2018 during our sampling.
|
Station |
Latitute |
Longitude |
Depth (m) |
Salinity (ppt) |
pH |
DO (mg/L) |
TDS (mg/L) |
Temp. (°C) |
|
SB 1 |
3° 17′ 26.52″ |
101° 21′ 57.96″ |
1.20 |
0.11 |
6.40 |
1.57 |
158.60 |
30.20 |
|
SB 2 |
3° 17′ 26.87″ |
101° 21′ 33.12″ |
1.33 |
0.11 |
6.52 |
1.67 |
157.95 |
30.50 |
|
SB 3 |
3° 17′ 12.84″ |
101° 21′ 8.64″ |
0.90 |
0.11 |
6.47 |
2.26 |
157.95 |
30.60 |
|
SB 4 |
3° 16′ 55.20″ |
101° 20′ 35.16″ |
1.50 |
0.11 |
6.46 |
1.80 |
156.65 |
31.10 |
|
SB 5 |
3° 16′ 33.59″ |
101° 19′ 40.80″ |
1.50 |
0.11 |
6.39 |
1.81 |
154.05 |
30.90 |
|
SB 6 |
3° 16′ 11.63″ |
101° 19′ 33.24″ |
1.60 |
0.11 |
6.19 |
0.27 |
155.35 |
31.00 |
|
SB 7 |
3° 15′ 50.04″ |
101° 18′ 38.51″ |
2.60 |
0.14 |
5.84 |
2.41 |
189.15 |
31.10 |
|
SB 8 |
3° 15′ 21.24″ |
101° 18′ 2.87″ |
1.80 |
20.67 |
6.89 |
3.48 |
22398.83 |
32.30 |
Dissolved Metals’ Concentration
Among the selected dissolved metals, Zn has the highest concentration at 0.06±0.63 ppm to 0.64±0.67ppm, while Cd has the least concentration at 0.00±0.02 ppm to 0.02±0.04 ppm in Sungai Buloh (Table 2). Dissolved Cu and Pb have a concentration of 0.00±0.10 ppm to 0.02±0.16 ppm and 0.01±0.10 ppm to 0.06±0.03 ppm (Table 2), respectively. The order of dissolved concentration was [Cd]<[Cu]<{Pb]<[Zn]. This order was in line with the metals’ concentration in the core sediment 11.
The highest concentration of dissolved Pb (0.06±0.03 ppm, Table 2) and Cd (0.02±0.04 ppm, Table 2) was determined at SB 3. The concentration of dissolved Pb at SB 1 (0.06 mg/L), SB 3 (0.06 mg/L) and SB 5 (0.06 mg/L) have exceeded the standard of class IIA/IIB in INWQS, which is not more than 0.05 mg/L. The concentration of Cd at SB 3 (0.02 mg/L) was exceeded the standard, which is 0.01 mg/L. The sources of Pb and Cd in SB 3 might come from the waste effluent from industrial activities. As the sampling point is near the industrial area 9, crude oil used in industries released and runoff into the river caused high concentration in the river. According to the study of 35, the high concentration of Cd and Pb in Sungai Buloh river was due to the production of metallic industries. This industry released the waste effluent into the river and caused the contamination.
The highest concentration of Zn was determined at the first station, SB 1 (0.64±0.67 ppm, Table 2), while the lowest was at the last station, which is SB 8 (0.06±0.63 ppm, Table 2). The acceptance limit for Zn is 5.0 mg/L, according to the INWQS. So, the concentration of dissolved Zn in the Sungai Buloh river is considered safe.
The highest concentration of dissolved Cu was determined at SB 5 (0.02±0.16 ppb) and SB 7 (0.02±0.05 ppb) (Table 2). These might be sources from the agriculture activities near SB 7, as suggested by (12). The concentration of dissolved Cu is still under the standard of INWQS.
The lowest concentration of dissolved Pb, Cu, Cd, and Zn was found at SB 8, located at the estuaries system. The concentration of dissolved metals in the river system was higher than in the estuarine system, especially upstream of the Sungai Buloh river. The concentration of dissolved metals in both river and estuaries systems was still considered in a safe range according to the INWQS. During the mixing of fresh water and seawater in estuarine, the flocculation process occurred might bring the soluble phase and dissolved load decrease 36-37. However, the dissolved metals might adsorb onto the particles due to the density of electrons on the surface of particles. In the aquatic ecosystem, the heavy metals can be exits as dissolved and particulate form 38. Heavy metals in different phases are able to interact with each other by adsorption, flocculation, deposition and resuspension 29. The particulate metals could settle down to the surface sediment against time, and they can be released back to the water column due to the changes of pH and resuspension 39.
Table 2: The concentration of dissolved (Diss.) and particulate (Part.) metals in river of Sungai Buloh.
|
Station |
Concentration of heavy metal in dissolved and particulate phase, ppm |
|||||||
|
Cu |
Zn |
Pb |
Cd |
|||||
|
Diss. |
Part. |
Diss. |
Part. |
Diss. |
Part. |
Diss. |
Part. |
|
|
SB 1 |
0.01±0.17 |
2.408±0.08 |
0.64±0.67 |
30.91±2.23 |
0.06±0.12 |
2.82±0.11 |
0.01±0.02 |
0.81±0.05 |
|
SB 2 |
0.01±0.03 |
1.472±0.09 |
0.15±2.10 |
8.34±0.43 |
0.03±0.44 |
1.83±0.14 |
BDL/±0.05 |
0.42±0.04 |
|
SB 3 |
0.01±0.01 |
2.007±0.10 |
0.45±0.66 |
14.15±0.91 |
0.06±0.03 |
2.64±0.07 |
0.02±0.04 |
1.45±0.04 |
|
SB 4 |
0.00±0.08 |
0.974±0.23 |
0.21±0.99 |
3.86±1.21 |
0.04±0.26 |
1.47±0.21 |
0.00±0.03 |
0.36±0.07 |
|
SB 5 |
0.02±0.16 |
0.921±0.07 |
0.30±3.14 |
3.53±0.66 |
0.06±0.63 |
1.38±0.59 |
0.01±0.11 |
0.24±0.09 |
|
SB 6 |
0.00±0.01 |
1.194±0.27 |
0.17±0.62 |
4.31±1.59 |
0.03±0.22 |
1.67±0.63 |
0.00±0.03 |
0.25±0.09 |
|
SB 7 |
0.02±0.05 |
1.036±0.12 |
0.34±3.55 |
2.68±0.65 |
0.05±0.32 |
2.00±0.44 |
0.01±0.04 |
0.51±0.14 |
|
SB 8 |
0.00±0.10 |
0.210±0.10 |
0.06±0.63 |
1.10±2.50 |
0.01±0.10 |
0.39±0.46 |
0.00±0.02 |
0.03±0.07 |
Particulate Metals’ Concentration
The concentration of the particulate metals was analysed by using ICP-MS after the acid digestion procedure 11. Zn was the most abundant element in all the stations, followed by Pb, Cu and Cd. Particulate Zn has the highest concentration with a range between 1.09±2.50 ppm (SB8) – 14.15±0.91 ppm (SB3); follow by Pb 0.39±0.40 ppm (SB8) – 2.82±0.11 ppm (SB1); Cu 0.21±0.10 ppm (SB8) – 2.4±0.08 ppm (SB1); Cd 0.034±0.07 ppm (SB8) – 1.45±0.44 ppm (SB3) ppm (Table 2).
The highest concentration of Zn, Pb, Cd was found at SB 1 (Zn: 30.91±2.23 ppm, Pb: 2.82±0.11 ppm, Cd: 1.45±0.04 ppm, Table 2) while the lowest can be found at SB 8 (1.10±2.50 ppm, 0.39±0.46 ppm, 0.03±0.07 ppm, Table 2). The concentration of particulate Zn is high in upstream. It has a similar distribution pattern as in the dissolved metals’ concentration. Particulate Cd found the least concentration among the four elements. The highest concentration of Cu was at SB1 2.408±0.08 ppm, while the lowest concentration of particulate Cu was found at SB 8 (0.210±0.10 ppm, Table 2).
From Table 3 above, selected metals in the particulate phase had been exceeded to the level of standards of INWQS. This might be due to the metals enter to the water column in the aqueous and particulate phase 40. As the process of flocculation, the dissolved metals turn into particulate metals and increase the level of particulate metals in the water column. Once the dissolved metals enter to the estuarine system, it turns into flocs due to the flocculation process. Hence, it could increase the concentration of the particulate metal. A higher concentration of particulate metals was found in the upper stream. These particulate metals might be attributed to the industrial effluent as most of the industrial is located upstream. The municipal wastewater discharge from the metal industry near the Sungai Buloh river upstream contributes to river pollution 35. The concentration of dissolved metals reduced after the process of flocculation in the freshwater and seawater 37. During this process, the dissolved metals change into floc form and reduce the dissolved load. Hence, the least dissolved metals were found in the estuarine system.
In general, most of the metal concentrations in both dissolved and particulate phases remain consistent. All the dissolved and particulate metals’ concentrations have small changes across the Sungai Buloh river. The determination of metals was predominantly in the particulate phase along the river, and concentrations are all within the INWQS limits.
The Distribution Coefficient of Metals in the Sungai Buloh River
The partitioning of metal between the particulate (>0.45 um) and dissolved (<0.45 um) phases is commonly quantified in terms of the distribution coefficient KD (26, 41-42). The KD is a measure of the tendency of an element to be associated and transported with the particulate phase 43. High particle reactivity for metal would tend to increase that metal’s KD value.
Partitioning coefficients in the Sungai Buloh river is shown in Table 4 above. The range of Log KD ratio of Cu was between 1.73 (SB 7) and 2.84 (SB 8). For Zn, the KD ratio value was between 0.90 (SB 7) and 1.74 (SB 2). The range of KD ratio of Pb was between 1.38 (SB 5) and 1.73 (SB 2), while for Cd was between 1.23 (SB 8) and 2.02 (SB 1) (Table 4). The higher the KD value, the higher affinity of metal adsorption in the particulate phase 44. This suggested that Cu has the highest affinity bound in the particulate form. All metals studied in the river exist more in the particulate phase than the dissolved phase.
For Zn, Pb and Cd, the higher KD value was determined at SB 1 and SB 2, located upstream of Sungai Buloh. In contrast, the lower KD value was determined at SB 7 and SB 8 for Cu, Zn, Fe, and Cd near the estuary system. Therefore, the decrease of the tendency of heavy metals associate with the particulate phase might be due to the mixing of fresh water and seawater, as suggested by 22.
From the result, it can be seen that all the metals were found exist in the particulate phase as the Log KD value was higher than 1. Different metals have a different affinity towards the particulate phase. Dissolved metals can easily enter the food chain when uptake by the fish and consumed by humans as a source of daily protein intake 45. No major changes in the element concentrations from upstream to downstream. Particulate phase dominated the physical speciation of Zn, Pb, Cd and Cu in the river with a trend of partition coefficients of (Cu(1.73-2.84)>Cd(1.23-2.02)>Pb (1.38-1.73)>Zn(0.90-1.74)). This indicated that the distribution of metals remains the same from the upstream to the downstream and suggested possibly low deposition of particulate metals into surface sediment occurred along the river.
The concentration of heavy metal in sediment
Sediment is the ultimate sink of heavy metals in the environment. The result of the concentration of heavy metal in sediment was obtained from 11. A similar concentration order of Zn, Cd, Pb and Cu was found in dissolved, particulate and sediment phases. The highest concentration of Cu in the sediment was determined at SBS 2 (28.61 ppm) (Table 5), while the lowest was at SBS 3. On the other hand, SBS 1 and SBS 4 have a concentration of Cu at 10.82 ppm and 11.85 ppm (Table 5), respectively. Moreover, SBS 2 has the highest concentration of Pb, which was 28.46 mg/kg (Table 5), and SBS 3 was the lowest concentration which was 8.53 ppm (Table 5). The concentration of Cd in the sediment was 0.099, 0.17, 0.060 and 0.19 ppm (Table 5) in SBS 1, SBS 2, SBS 3 and SBS 4, respectively. For the metals of Zn in sediment, SB 2 was the highest concentration which was 124.75 ppm (Table 5), among the four stations. SB 3 has the lowest concentration of Zn, which was 43.46 ppm (Table 5).
Among the four metals concentration in sediment, SBS 2 has the highest concentration of metals in sediment while SBS 7 has the lowest concentration of metals in sediment. However, when compared to the concentration of dissolved and particulate metals, the concentration of the metals has higher in sediments. From Table 2 and Table 5, the concentration of metals is higher in sediment than dissolved form. It might be due to the flocculation of dissolved form into the particulate due to the flushing of water from the irrigation canal (located nearby SB2) into the river. The mixing of water from an irrigation canal and upstream water caused the dissolved metals to turn into particulate and be deposited in the SB2 46. Hence, it has been suggested that the sources of dissolved metals at SB 2 came from the discharge of the irrigation canal. Among all the different phases of metals (dissolved, particulate and sediment), a similar order was found, which is the Cd < Cu < Pb < Zn. It can suggest that all these metals are originated from similar sources.
To identify their biogeochemistry cycle at Sg, we have studied the distribution pattern of Zn, Cd, Pb and Cu in dissolved, particulate and sediment phases across the Sungai Buloh river. The concentration of metals in the particulate phase in this river has exceeded the Standards of Class IIA/B according to INWQS (Table 3). However, its concentration was decreased from the upstream to the downstream along this river, similar to the dissolved phase. The distribution coefficient indicated that these metals are present more in the particulate phase along the river, especially for Cu and Cd. A slightly consistent ratio of Log KD was determined between both dissolved and particulate phases along the river. It indicated a possibility of low deposition of particulate metals into the surface sediment along the river. Furthermore, the distribution of these metals in the surface sediment shown a low concentration of metals, and their concentrations were below the safety level, as reported by 11. The result of Log KD suggested that the heavy metals in the river of Sungai Buloh do not vary significantly. This could be an explanation for the less deposition of particulate metals that occurs along with the Sungai Buloh river system.
Table 3: Concentration of particulate metals determined during this study were exceeded the standards of INWQS. Sources: DOE, 2019.
|
Metals |
Standards of Class IIA/B according INWQS (ppm) |
Concentration of Particulate metals in Study Area (ppm) |
|
Cu |
0.02 |
0.21 – 2.41 |
|
Zn |
5.00 |
1.10 – 30.91 |
|
Pb |
0.05 |
0.39 – 2.82 |
|
Cd |
0.01 |
0.03 – 1.45 |
Table 4: KD and Log Kd value of metals in Sungai Buloh in May 2018.
|
Station |
KD |
Log KD |
||||||
|
|
Cu |
Zn |
Pb |
Cd |
Cu |
Zn |
Pb |
Cd |
|
SB 1 |
207.06 |
48.67 |
50.75 |
105.53 |
2.32 |
1.69 |
1.71 |
2.02 |
|
SB 2 |
253.28 |
54.46 |
53.78 |
105.74 |
2.40 |
1.74 |
1.73 |
2.02 |
|
SB 3 |
156.55 |
31.36 |
42.76 |
79.69 |
2.19 |
1.50 |
1.63 |
1.90 |
|
SB 4 |
219.25 |
18.02 |
38.01 |
91.49 |
2.34 |
1.26 |
1.58 |
1.96 |
|
SB 5 |
55.54 |
11.79 |
23.88 |
40.69 |
1.74 |
1.07 |
1.38 |
1.61 |
|
SB 6 |
250.27 |
24.86 |
51.56 |
61.09 |
2.40 |
1.40 |
1.71 |
1.79 |
|
SB 7 |
53.90 |
8.00 |
39.06 |
73.02 |
1.73 |
0.90 |
1.59 |
1.86 |
|
SB 8 |
691.09 |
17.56 |
29.74 |
16.89 |
2.84 |
1.24 |
1.47 |
1.23 |
Table 5: Concentration of metals in sediment in study area. Sources: 11
|
Station |
Sediment (ppm) |
|||
|
Cu |
Zn |
Pb |
Cd |
|
|
SBS 1 |
10.82 |
73.94 |
23.84 |
0.10 |
|
SBS 2 |
28.61 |
124.75 |
28.46 |
0.17 |
|
SBS 7 |
5.96 |
43.46 |
8.53 |
0.10 |
|
SBS 8 |
11.85 |
77.69 |
17.33 |
0.19 |
Conclusions
This study investigated the concentration and distribution of Cd, Cu, Pb and Zn in the water body and surface sediments along the Sungai Buloh river, Selangor. Our results indicated that dissolved and particulate metals are higher in upper stream compared to downstream of the river due to the anthropogenic input. Most of the metals are transported in the particulate form along the river. This study revealed that a low deposition of metal occurred in this river according to the consistent Log KD value from upper stream to downstream.
Acknowledgment
Special thanks to all the crew and laboratory staff of Faculty of Forestry and Environment, Universiti Putra Malaysia for assistance during the sampling and analysis. This study was funded by Universiti Putra Malaysia grant (GP/2018/9608500).
Conflict of Interest
The authors declare no conflict of interest
Funding Sources
There is no funding source.
References
- Khan, M. B., Masiol, M., Hofer, A., & Pavoni, B. In PHEs, Environment and Human Health: Potentially Harmful Elements in the Environment and the Impact on Human Health. 2014, 37–83
CrossRef - Karbassi, A. R., & Heidari, M. Global Journal of Environmental Science and Management. 2015,1(1), 41–46.
- Davutluoglu, O. I., Seckin, G., Ersu, C. B., Yilmaz, T., & Sari, B. Journal of Environmental Management. 2011, 92(9), 2250–2259.
CrossRef - Palma, P., Ledo, L., & Alvarenga, P. Catena, 2015, 128, 174–184.
CrossRef - McComb, J., Alexander, T. C., Han, F. X., & Tchounwou, P. B. Journal of Bioremediation & Biodegradation. 2014, 5(03). https://doi.org/10.4172/2155-6199.1000E148
CrossRef - Saffian, N. S., Peng, C. T. C., Ilias, N., & Hwai, A. T. S. IOP Conference Series: Earth and Environmental Science. 2020, 414(1).
CrossRef - Yunus, S. M., Hamzah, Z., Ariffin, N. A. N., & Muslim, M. B. In The Malaysian Journal of Analytical Sciences. 2014, 18.
- Azrina, M. Z., Yap, C. K., Rahim Ismail, A., Ismail, A., & Tan, S. G. Ecotoxicology and Environmental Safety. 2006, 64(3), 337–347.
CrossRef - Rowshon, M. K., Mbaruk, M. M., Marriott, M. J., Amin, M. S. M., Ahsan, A., Loh, E. W. K., Marriott, M. M., Ahsan, M. J., & Loh, A. In Int. J. Water. 2014, 8, 4.
CrossRef - Chowdhury, M. S. U., Othman, F., Jaafar, W. Z. W., Mood, N. C., & Adham, M. I. Sains Malaysiana. 2018, 47(3), 457–469.
CrossRef - Lasumin, N. Vertical Distributions of Zinc, Cadmium, Lead, and Copper in Sediments of Selected Coastal Areas Inwest Coast of Peninsular Malaysia. 2020
- Al-Badaii, F. Iranica Journal of Energy & Environment. 2014
- Ahmad, A. K., Mushrifah, I., & Shuhaimi-Othman, M. In Sains Malaysiana. 2009, 38, 4.
- Manap, N., Sandirasegaran, K., Syahrom, N. S., & Amir, A. MATEC Web of Conferences. 2019, 266, 04003.
CrossRef - Yap, C. K., Ismail, A., Tan, S. G., & Omar, H. Environment International. 2002, 28(6), 467–479.
CrossRef - Søndergaard, J., Asmund, G., & Larsen, M. M. MethodsX,.2015, 2, 323–330.
CrossRef - Kingston, H. M., Barnes, I. L., Brady, T. J., Rains, T. C., & Champ, M. A. Analytical Chemistry. 1978, 50(14), 2064–2070.
CrossRef - Lin, T. S., & Nriagu, J. O. Analytica Chimica Acta. 1999, 395(3), 301–307.
CrossRef - Scoullos, M. J., Sakellari, A., Giannopoulou, K., Paraskevopoulou, V., & Dassenakis, M. Desalination. 2007, 210(1–3), 98–109.
CrossRef - Pai, S. C., Fang, T. H., Chen, C. T. A., & Jeng, K. L. In Marine Chemistry. 1990, 29.
CrossRef - Bulska, E., & Ruszczyńska, A. Physical Sciences Reviews. 2017, 2(5).
CrossRef - Yang, X., & Wang, Z. Journal of Coastal Research. 2017, 33(5), 1189-1195
CrossRef - Godon, E., & Mohamed, K. N. In-House Seminar of The Chemical Oceanography Laboratory, I. 2016
- Adiana, G., Shazili, N. A. M., Marinah, M. A., & Bidai, J. Environmental Monitoring and Assessment. 2014, 186(1), 421–431.
CrossRef - Maithreepala, R. A., & Doong, R. Journal of the University of Ruhuna. 2014,1(2), 23.
CrossRef - Kamel, S. S. M., Mohamed, K. N., (Ferdius) Yusuff, F. M., & Amiruddin, A. M. Pertanika J. Sci. & Technol. 2019, 27(4), 2317–2331.
- Vandenhove, H., Gil-García, C., Rigol, A., & Vidal, M. Journal of Environmental Radioactivity. 2009, 100(9), 697–703.
CrossRef - Gil-García, C., Rigol, A., & Vidal, M. Journal of Environmental Radioactivity, 2009, 100(9), 690–696.
CrossRef - Zhang, J., Zhou, F., Chen, C., Sun, X., Shi, Y., Zhao, H., & Chen, F. PLOS ONE. 2018,13(8), e0201414.
CrossRef - Nthunya, L. N., Maifadi, S., Mamba, B. B., Verliefde, A. R., & Mhlanga, S. D. Water. 2018, 10(8), 990.
CrossRef - Thompson, K., Christofferson, W., & Dan Robinette, J. C. American Journal of Ophthalmology. 2006, 49(3), 594–605.
- Radke, & Lynda. (2016). pH of coastal waterways – OzCoasts. https://ozcoasts.org.au/indicators/biophysical-indicators/ph_coastal_waterways/
- Al-Badaii, F., Shuhaimi-Othman, M., & Gasim, M. B. Journal of Chemistry. 2013
CrossRef - Hunter, K. A., Liss, P. S., Surapipith, V., Dentener, F., Duce, R., Kanakidou, M., Kubilay, N., Mahowald, N., Okin, G., Sarin, M., & Uematsu, M. 2011,38(13).
CrossRef - Nemati, K., Bakar, N. K. A., Abas, M. R., & Sobhanzadeh, E. Journal of Hazardous Materials. 2011, 192(1), 402–410.
- John, B. IWA Publishing. 2016, 538.
CrossRef - Hassani, S., Karbassi, A. R., & Ardestani, M. Global Journal of Environmental Science and Management, 2017,3(2), 187–196.
- TUNA, A. L., YILMAZ, F., DEMIRAK, A., & OZDEMIR, N. Environmental Monitoring and Assessment. 2007, 125(1–3), 47–57.
CrossRef - Hill, N. A., Simpson, S. L., & Johnston, E. L. Environmental Pollution. 2013, 173, 182–191.
CrossRef - Lim, W. Y., Aris, A. Z., & Zakaria, N. P. The Scientific World Journal, 2012.
CrossRef - Benoit, G., Oktay-Marshall, S. D., Cantu, A., Hood, E. M., Coleman, C. H., Corapcioglu, M. O., & Santschi, P. H. Marine Chemistry. 1994, 45(4), 307–336.
CrossRef - Nguyen, H. L., Leermakers, M., Osán, J., Török, S., & Baeyens, W. Science of The Total Environment. 2005, 340(1–3), 213–230.
CrossRef - Adiana, G., Shazili, N. A. M., & Ariffin, M. M. Journal of Sustainability Science and Management. 2011, 6(2), 181–192.
- García-Rico, L., Tejeda-Valenzuela, L., Jara-Marini, M. E., & Gómez-Álvarez, A. Environmental Monitoring and Assessment. 2011, 176(1–4), 109–123.
CrossRef - Gheorghe, S., Stoica, C., Vasile, G. G., Nita-Lazar, M., Stanescu, E., & Lucaciu, I. E. Water Quality. 2017,
- Gaur, V. K., Gupta, S. K., Pandey, S. D., Gopal, K., & Misra, V. Environmental Monitoring and Assessment, 2005,102(1–3), 419–433.
CrossRef

This work is licensed under a Creative Commons Attribution 4.0 International License.
About The Author
![]()
A New Edition of Web of Science
Journal Impact Factor
2022: 0.5
Five Year: 0.8
Journal is Indexed in

Cabells Whitelist
![]()


