Formulation and Characterization of SNEDDS of Pandanus tectorius Fruit Extract and in vitro Antioxidant Activity
Alifa Husnun Kholieqoh1* , Tengku Sifzizul Tengku Muhammad1,2, Habsah Mohamad1, Hazem Choukaife3, Salma Seyam3, Mulham Alfatama3 and Yosie Andriani1
1Institute of Marine Biotechnology, Universiti Malaysia Terengganu, Mengabang Telipot 21030, Kuala Nerus, Terengganu, Malaysia.
2Research Management Center, Universiti Malaysia Terengganu, Mengabang Telipot 21030, Kuala Nerus, Terengganu, Malaysia.
3Faculty of Pharmacy, Universiti Sultan Zainal Abidin, Besut Campus, Besut 22200, Terengganu, Malaysia.
Corresponding Author E-mail: p5031@pps.umt.edu.my
DOI : http://dx.doi.org/10.13005/ojc/380404
Article Received on : 08 Jun 2022
Article Accepted on : 09 Aug 2022
Article Published : 12 Aug 2022
Reviewed by: Dr. Shristi Nayak
Second Review by: Dr. Malinee Sriariyanun
Final Approval by: Dr. S.A. Iqbal
Excess reactive oxygen species can cause oxidative stress and lead to the progression of cardiovascular diseases. Pandanus tectorius fruit (PTF) is a promising source of herbal medicine with antioxidant activity. However, the oral administration is hindered due to the semi-polar properties of the extract. The solubility of the extract can be potentially improved through synthesis of a self-nanoemulsifying drug delivery system (SNEDDS). This study aims to formulate nanoemulsion of the extract by means of self-nanoemulsification approach using caprylic triglycerides, kolliphor RH40, and propylene glycol. It was found that when tested in water, simulated gastric, and intestinal fluid, PTF-SNEDDS had emulsification times of 38.17, 49.44, and 45.29 sec, indicating grade A formulation. The clarity level of PTF-SNEDDS, particle size, and zeta potential was at 99.3%, 41.5 ± 1.1 nm, and -25.9 mV. The antioxidant activity of PTF-SNEDDS was 1.6 times higher than PTF extracts. It can be concluded that PTF extract can be formulated into SNEDDS and stable in gastrointestinal conditions.
KEYWORDS:Antioxidant; Oral Bioavailability; Pandanus tectorius; SNEDDS
Download this article as:| Copy the following to cite this article: Kholieqoh A. H, Muhammad T. S. T, Mohamad H, Choukaife H, Seyam S, Alfatama M, Andriani Y. Formulation and Characterization of SNEDDS of Pandanus tectorius Fruit Extract and in vitro Antioxidant Activity. Orient J Chem 2022;38(4). |
| Copy the following to cite this URL: Kholieqoh A. H, Muhammad T. S. T, Mohamad H, Choukaife H, Seyam S, Alfatama M, Andriani Y. Formulation and Characterization of SNEDDS of Pandanus tectorius Fruit Extract and in vitro Antioxidant Activity. Orient J Chem 2022;38(4). Available from: https://bit.ly/3JPu1hu |
Introduction
According to the World Health Organization (WHO), 55.4 million cases of death were recorded in 20191. Cardiovascular diseases are the top global causes of death in the world. Coronary heart disease is the biggest killer and responsible for 16% cases of the total death in the world1 and 17% of death in Malaysia2. Excess production of reactive oxygen species (ROS) leads to oxidative stress that can trigger the progression of cardiovascular diseases such as metabolic disorders, cancer, diabetes, and atherosclerosis3. Nowadays, medicinal plants may be used as sources of drugs as they have been scientifically proven to be useful for health4,5 and also related to the objectives of the WHO traditional medicine strategy 2014-20236.
Naturally formulated drugs including those from plants have gained consideration as an alternative because, compared to synthetic drugs, their side effects are minimal. Plant-based drugs are used by about 80% of the world’s population7. A medicinal plant with potential but still underutilized is Pandanus tectorius, a coastal plant. Its fruit contains secondary metabolites, such as phenolic, flavonoid, and steroid8. Two compounds from the fruit, which aretangeretin and ethyl trans-caffeate can be used as an alternative natural HMGCR inhibitor9–11. The fractions of Pandanus tectorius fruit have high antioxidant activity8. However, these activities have not yielded maximum effect because the active extracts and their bioactive compounds have low solubility in aqueous medium. To enhance the capability of P. tectorius extract in preventing diseases, it is important to design an effective formulation for oral administration.
Solubility and bioavailability of P. tectorius extracts can be improved when lipid-based systems are used. Self-nanoemulsifying drug delivery system (SNEDDS) consist of an isotropic mixture of oils, surfactant, and co-surfactant. SNEDDS has been proven to overcome the limitations related to oral administration of several plant extracts and compounds12. Following the administration and a mild agitation in the gastrointestinal tract, SNEDDS disperses to develop fine oil-in-water nanoemulsion to enhance the dissolution and absorption and subsequently enhance the bioavailability of the active ingredients13.
Based on previous studies, SNEDDS formulations of plant extracts have been proven to be more effective than crude extracts14,15. In addition, the formulation can be scaled-up because the process is simple and cost-effective as SNEDDS provides a stable lipid solution without high-energy emulsification process16. The purpose of this research is to increase P. tectorius fruit (PTF) extracts’ effectiveness as an antioxidant agent in the form SNEDDS formulation. In this study, PTF-SNEDDS were also tested for emulsification ability in simulated intestinal and gastric fluid to determine their properties in gastrointestinal tract for oral administration.
Materials and Methods
Sample Collection and Extraction
Fruits of Pandanus tectorius were obtained from Teluk Ketapang area, Terengganu, Malaysia. After they were washed with running water, the fruits were chopped into tiny chunks, then placed in a freeze dryer at -80oC to freeze dry. The dried fruits were grinded to powder, then extracted by cold extraction using hexane and methanol successively with 1:4 ratio between sample and solvent. The extraction was done 7-10 days for each solvent. The solvent was evaporated by rotary evaporator to obtain crude hexane and methanol extracts.
Observation of solubility
Methanol extracts of P. tectorius fruit were tested for solubility according to previous study with minor modifications17. During the test, various oils (corn oil, olive oil, oleic acid, and caprylic triglycerides), surfactants (kolliphor RH40 and tween 80), and co-surfactants (propylene glycol, PEG 400, and DMSO) were used. Each sample was added into 2 mL microtube (Tarson-500020) containing 1 mL vehicle. Then, the mixture was vortexed and sonicated for 1 hour at 35oC in sonicator bath. The solubility of each sample was observed by visual assessment.
Initial surfactant screening for emulsification ability
To determine their emulsification property, different surfactants were screened using the method reported by Date et al., (2010)16. The surfactant (300 mg) was briefly added to 300 mg of selected oily phase. The mixtures were homogenized and heated at 45-50oC, followed by adding 50 ml distilled water to dilute 50 mg of each mixture to produce fine emulsion. The emulsions were assessed in term of ease of formation by determining the number of flask inversions necessary to obtain uniform emulsion. Then the emulsion was kept for 2 hours before subjecting them to UV-spectrophotometer analysis at wavelength of 638 nm. The phase separation was determined by visually inspection.
Initial co-surfactant screening for emulsification ability
To determine the best co-surfactant for improving the surfactants’ nanoemulsification ability and thus their oral delivery, co-surfactants were screened as the method that Date et al., (2010) have reported16. Two hundred mg of surfactant was mixed with 100 mg of co-surfactants and then this mixture was added to 300 mg of oil phase. The next step involved homogenizing the mixture through gentle heating (45-50oC). This step was followed by using 50 ml distilled water to dilute 50 mg of each mixture to obtain fine emulsion. The emulsion was assessed for its ease of formation based on the required number of flask inversions to obtain uniform emulsion. Afterward, the emulsion was left to stand for 2 hours. Then, the emulsions were measured spectrophotometrically for their percentage of transmittance, at 638 nm with distilled water used as a blank. To determine phase separation, the emulsions were visually observed.
Pseudo-ternary phase diagram construction
For understanding the phase behavior as well for observing the formation of SNEDDS, plotting of ternary phase diagrams of oils, surfactants, and co-surfactants were carried out. For diagram construction, aqueous titration method was used, where oil, Smix (surfactant and co-surfactant mixture), and water denoted a triangle’s apex. In the self-emulsification area, the point yielded spontaneous emulsion with droplet size 200 nm or lesser16.
For each phase diagram, surfactant and co-surfactant were mixed (Smix) with different weight ratios (2:1, 3:1, and 3:2). Specific Smix ratios were mixed with oil in glass vials, with different ratios ranging from 1:9 to 9:1, and these were homogenized. Distilled water was used to titrate each mixture, drop by drop. After each addition, the mixtures were vortexed at room temperature. These mixtures were then visually observed for any turbidity or phase changes. For each addition, the water weight was recorded to be used later when measuring the concentration for constructing the ternary phase diagram. The ternary phase diagram for each Smix ratio was designed with CHEMIX School software (Chemix Version 10.0).
Formulation of PTF-SNEDDS
Following the identification of self-emulsifying region, the selections of SNEDDS with desired component ratios were made and these were further optimized for drug incorporation. One hundred mg of P. tectorius fruit methanol extracts were mixed with 3 g of SNEDDS, and the mixtures were homogenized using vortex mixer. Then, the mixture was sonicated for 1 hour at 35oC in sonicator bath. The prepared PTF-SNEDDSs were placed in a tightly lidded bottle at room temperature.
Characterization of formulations
Robustness to dilution
To study the selected formulation of PTF-SNEDDS, all of the formulations were diluted to 50, 100 and 1000 times with simulated gastric fluid pH 1.2, simulated intestinal fluid pH 7.4, and distilled water. Following this process, the diluted samples needed to be kept for 24 h to allow any signs of physical changes, phase separation or drug precipitation to be observed18,19.
Self-emulsification efficiency and time
To determine self-emulsification efficiency and time, dispersibility studies were conducted. The studies involved adding 500 µl of each formulation to 150 ml of distilled water, followed by introducing a gentle agitation at 100 rpm and adjusting the temperature to 37±0.5oC. The time for the SNEDDS to completely dissolve was recorded. To visually assess the efficiency, a five-grade system was constructed20.
Grade A denoted to nanoemulsion with bluish appearance formed rapidly (within 1 min).
Grade B denoted to nanoemulsion with bluish-white appearance formed rapidly (within 2 min).
Grade C denoted to nanoemulsion with milky appearance formed within 2 min.
Grade D denoted to nanoemulsion with grayish white and slightly oily appearance formed slowly (more than 2 min).
Grade E denoted to large oil globules on its surface formed extremely slowly (more than 3 min), indicating poor or minimal emulsification.
Grade A and Grade B formulations were regarded as meeting the requirements and therefore selected for further study.
Emulsification time deforming
Emulsification time deformation was conducted in simulated gastric fluid (SGF) and simulated intestinal fluid (SIF)17-18. To prepare SGF medium, 1 g NaCl was added to 33% HCl at pH 1.2, then add distilled water till 500 ml. Whereas, 4 g KH2PO4 were added to 0.2 N NaOH at pH 7.4 and toped up to 500 ml with distilled water to prepare SIF fluid.
The emulsification time determination was visually observed. Briefly, 500 µl of each formulation was placed into 150 ml of distilled water with gentle agitation at 100 rpm (37±0.5oC). The time it took for the SNEDDS to disappear was recorded. Homogenous emulsions were observed every 60 min for 4 h (stable or unstable).
Optical clarity
Transmission percentage of PTF-SNEDDS that has undergone emulsification 50 times in distilled water was measured to determine the clarity level. The measurement used UV-Vis spectrophotometer at 638 nm, while distilled water functioned as blank23.
FTIR
FTIR analysis of P. tectorius methanol extract, PTF-SNEDDS, and SNEDDS carrier were carried out to assess the possible interaction between formulation components23. Recording of the spectra was completed using Fourier transform infrared spectrophotometer in the range of 4000-650 cm-1 using ATR method.
Particle size and zeta potential
Particle size (PS), polydispersity index (PDI), and zeta potential (ZP) were determined by dynamic light scattering technique (DLS) using particles sizer (Litesizer 500 Anton Paar, Austria). The nanoemulsion was reconstituted in filtered deionized water and sonicated for 10 min. After suitable dilution, measurements were performed in triplicates at 25oC at a scattering angle of 15o, 90o, 175o and results were represented as mean value ± standard deviation (SD).
Antioxidant activity
To determine the antioxidant activity of the samples. DPPH assay was employed. To conduct the assay, crude extracts were prepared in various concentrations (0-60 ppm). Then, 0.1mM DPPH solutions were mixed with samples and the mixtures were subjected to 30 min of dark-environment incubation at room temperature. Spectrophotometer UV-1800 (Shimadzu) was used to measure the absorbance at 517 nm wavelength. Free radical scavenging activities were determined using standard equation (1), as follows:

Where Acis the negative control absorbance, and Asis the sample absorbance.
Results and Discussions
Observation of solubility
The solubility was observed to determine the suitability of oil phase and surfactants for development of PTF-SNEDDS to optimize drug loading. As shown in Table 1, methanol extract of P. tectorius is insoluble in corn oil and olive oil. Both are natural edible oil that demonstrate fairly poor drug loading capacity as well as substandard emulsification efficiency12. In the formulation, drug solubility may be enhanced by employing medium chain and long chain tryglycerides/fatty acid.
Table 1: Observation of the extract solubility in oils, surfactants, and co-surfactants.
|
Extract |
Oils |
Surfactant |
Co-surfactant |
||||||
|
Corn oil |
Olive oil |
Oleic acid |
Caprylic TG |
Kolliphor RH40 |
Tween 80 |
Propylene glycol |
PEG 400 |
DMSO |
|
|
PTF -Methanol |
v |
v |
v |
v |
v |
v |
v |
||
Note. v = miscible
Initial surfactant screening for emulsification ability
Surfactants and co-surfactants are vital to improve thermodynamic stability of oil in water nanoemulsion. Surfactants can enhance penetration and absorption by disrupting lipid bilayer, and this can be accomplished by dividing the bilayer into gastrointestinal membrane24,25. The affinity of lipid-surfactant and surfactant’s hydrophilic-lipophilic balance (HLB) value control the process plus the emulsification efficiency, as does viscoelasticity of the emulsion base. Surfactants with HLB value >10 may be used to form of oil-water nanoemulsions. All surfactants that underwent screening have HLB>1025. Surfactants with non-ionic property are suitable to be used in formulations and in pharmaceuticals because they are less toxic26. In addition, they are minimally affected by ionic strength changes and pH27, and they can be administered orally28. In the current study, the emulsification efficiencies of the selected surfactants, which are kolliphor RH-40 and tween 80, were compared using oleic acid and caprylic triglycerides as oily phases. The results include of flask inversions and transmittance values for different mixtures (Table 2).
Based on the results, it appears that the surfactant with highest emulsification efficiency (denoted by % transmittance) was the surfactant that had a higher HLB value for every oil phase, which is kolliphor RH-40 (14-16). Higher HLB value enabled more stable nanoemulsion to be formed when exposed to water26,29. Besides that, there are some effects from the oils. Caprylic triglyceride is a medium chain triglyceride (MCT), hence it has better solubilizing ability and self-emulsification capacity12. Kolliphor RH-40 showed the highest solubility and emulsification, thus, surfactant was chosen to be studied further.
Table 2: Emulsification ability of selected surfactants.
|
Oil |
Surfactant |
HLB value |
No. of inversions |
%T |
|
|
Trade name |
Chemical name |
||||
|
Oleic Acid |
Kolliphor RH-40 |
Polyoxyl 40 hydrogenated castor oil |
14-16 |
10 |
66.5 |
|
Tween 80 |
Polyoxyethylene sorbitan monooleate |
15 |
8 |
51.5 |
|
|
Caprylic Triglycerides |
Kolliphor RH-40 |
Polyoxyl 40 hydrogenated castor oil |
14-16 |
4 |
92.4 |
|
Tween 80 |
Polyoxyethylene sorbitan monooleate |
15 |
3 |
56.2 |
|
Initial co-surfactant screening for emulsification ability
Co-surfactants can enter the interphase and create gaps that allow water to penetrate, then increase interfacial fluidity, causing spontaneous emulsification30. Due to the presence of co-surfactants, the interface’s bending stress diminishes, making the interface more flexible, thus causing it to contort around each droplet and assume various curves required to allow emulsion to be formed29. The surfactant showing the highest emulsification efficiency amongst different co-surfactants was propylene glycol, but it is harder to emulsify than PEG 400. Adding co-surfactants to water decreases its surface tension, and this helps surfactants from experiencing too much stress in water. The results, which include the number of flask inversions and transmittance of different mixtures are presented in Table 3.
Table 3: Emulsification ability of selected co-surfactants.
|
Oil |
Surfactant |
Co-surfactants |
No. of inversions |
%T |
|
Caprylic Triglycerides |
Kolliphor RH-40 |
PEG 400 |
3 |
34.8 |
|
Propylene glyco |
7 |
56.3 |
||
|
DMSO |
6 |
43.7 |
Pseudo-ternary phase diagram construction
To select a suitable concentration of oil, surfactant, and co-surfactant, construction of ternary phase diagrams was undertaken without including extracts and pure compounds. The other objective concerned is the identification of the region self-nanoemulsifying activity. These diagrams have a significant role in the study of nanoemulsion phase behaviour16.
Based on the results from preliminary surfactant and co-surfactant screening, the oil phase selected was caprylic triglycerides, the surfactant selected was kolliphor RH-40, and the co-surfactant selected was propylene glycol. As shown in Figure 1, the nanoemulsion area in the pseudo-ternary phase diagrams is presented in grey color. Additionally, emulsification region exhibited by the system with Smix ratio (3:2) was higher than the other systems; thus, the system was chosen to be studied in greater detail. Based on the present results, oil content of 0-25% led to a clear and transparent system. This system enables nanoemulsion to be formed more favorably23. The surfactant develops a layer around oil globule, with non-polar part pulling out oil and polar part lying towards aqueous solution, thus reducing surface tension between oil and aqueous phase31. After the surfactant concentration is raised, the self-emulsification process begins spontaneously32.
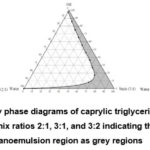 |
Figure 1: Pseudo-ternary phase diagrams of caprylic triglycerides, kolliphor RH-40, propylene glycol at Smix ratios 2:1, 3:1, and 3:2 indicating clear oil in water nanoemulsion region as grey regions. |
PTF-SNEDDS formulation
PTF-SNEDDS were formulated according to the outcome of pseudo-ternary phase diagrams, whereby caprylic triglycerides became the oil phase, kolliphor RH-40 as the surfactant, and propylene glycol as the co-surfactant, with Smix 3:2 as the composition. The formula’s composition is as presented in Table 4. Then, all of the formulations were characterized with and without drug (extracts and pure compounds) loaded.
Table 4: Formulations of PTF-SNEDDS
|
Formulations |
SNEDDS Compositions |
||
|
Oil (%wt) |
Surfactant (%wt) |
Co-surfactant (%wt) |
|
|
A |
16.70 |
49.98 |
33.32 |
|
B |
11.80 |
52.92 |
35.28 |
|
C |
28.57 |
42.86 |
28.57 |
|
D |
10.07 |
53.96 |
35.97 |
|
E |
14.03 |
51.58 |
34.39 |
|
F |
18.08 |
49.15 |
32.77 |
|
G |
20.07 |
47.96 |
31.97 |
|
H |
22.02 |
46.79 |
31.19 |
|
I |
24.01 |
45.59 |
30.40 |
|
J |
26.01 |
44.39 |
29.59 |
Optimization of formulations
Robustness of dilution
SNEDDS is used as a drug carrier because it has the ability to create dispersion without phase separation and drug precipitation33. Robustness of dilution of SNEDDS formulation is shown by in Table 5. Based on visual observations, A-B and D-E SNEDDS formulations were clear and transparent, while not showing evidence of phase separation or cloudiness past the 24 hr period when diluted with distilled water, 0.1 N HCl, and phosphate buffer for 50, 100, and 1000 times. Therefore, SNEDDS formulations were considered suitable and stable for oral administration, and as such the prospect of uniform drug release profile in vivo wil be ensured 18,23. The pH 1.2 and 7.4 of the dilution did not have an effect on nanodispersion properties, but with phase separation being absent at intraluminal pH, the oil globules would travel along gastrointestinal (GI) tract18.
Table 5: Robustness of dilution of SNEDDS formulation.
|
Code |
|
|
Observation |
|
|||||||
|
Distilled water |
Simulated gastric fluid |
Simulated intestinal fluid |
|||||||||
|
50x |
100x |
1000x |
50x |
100x |
1000x |
50x |
100x |
1000X |
|||
|
A |
T, S |
T, S |
T, S |
T, S |
T, S |
T, S |
T, S |
T, S |
T, S |
||
|
B |
T, S |
T, S |
T, S |
T, S |
T, S |
T, S |
T, S |
T, S |
T, S |
||
|
C |
M, S |
M, S |
H, S |
M, US |
M, US |
H, US |
M, US |
M, US |
H, US |
||
|
D |
T, S |
T, S |
T, S |
T, S |
T, S |
T, S |
T, S |
T, S |
T, S |
||
|
E |
T, S |
T, S |
T, S |
T, S |
T, S |
T, S |
T, S |
T, S |
T, S |
||
|
F |
T, S |
T, S |
T, S |
LT, S |
LT, S |
T, S |
LT, S |
LT, S |
T, S |
||
|
G |
LT, S |
LT, S |
T, S |
LT, S |
LT, S |
T, S |
LT, S |
LT, S |
T, S |
||
|
H |
LT, S |
LT, S |
T, S |
LT, S |
LT, S |
T, S |
LT, S |
LT, S |
T, S |
||
|
I |
LT, S |
LT, S |
T, S |
LT, S |
LT, S |
T, S |
LT, S |
LT, S |
T, S |
||
|
J |
LT, S |
LT, S |
T, S |
LT, S |
LT, S |
T, S |
LT, S |
LT, S |
T, S |
||
Notes. T = transparent; LT = less transparent; H = hazy; M = milky; S = stable; US = unstable
Dispersibility study
From the dispersibility study, the time taken by SNEDDS formulation to form nanoemulsion was obtained (Table 6). To determine the grade of the emulsion, distilled water was used. Based on the results, all the formulations except C obtained either grade A or B, indicating that they passed the dispersibility test. These dispersions gave clear-yellowish or slightly less clear nanoemulsions, which formed rapidly (less than one minute). From these findings, the prospect of drug release profile in vivo will be ensured 18,23. Formulation C was categorized as grade C because it took longer (within 2 min) to form nanoemulsion and showed milky appearance.
Table 6: Self-emulsification time of PTF-SNEDDS formulations.
|
Code |
Observation |
Emulsification time (sec) |
Grade |
|
A |
Clear-yellowish |
38.17 |
A |
|
B |
Clear-yellowish |
41.58 |
A |
|
C |
White emulsion |
94.29 |
C |
|
D |
Clear-yellowish |
30.77 |
A |
|
E |
Clear-yellowish |
33.78 |
A |
|
F |
Clear-yellowish |
42.59 |
A |
|
G |
Less clear, bluish-white |
47.34 |
B |
|
H |
Less clear, bluish-white |
49.54 |
B |
|
I |
Less clear, bluish-white |
57.41 |
B |
|
J |
Less clear, bluish-white |
59.37 |
B |
Emulsification time deforming
The purpose of observing emulsification time deforming was to determine the speed of SNEDDS nanoemulsion formation both in simulated gastric fluid and in simulated intestinal fluid through mild agitation21,22. In normal circumstances, SNEDDS will be dispersed in less than one minute in simulated gastric and intestinal fluid. The results of emulsification time deforming of PTF-SNEDDS formulations as presented in Table 7.
A, B, D, and E SNEDDS formulations were clear, per the data in Table 8. So, these formulations are suitable for developing PTF-SNEDDS. Besides that, the systems are stable with no aggregation or precipitation for 4 h at 37oC. This denotes that the formulation can maintain its nanoemulsion form for 4 h in gastrointestinal (GI) tract and when it is absorbed in the intestine21. Hence, the A, B, D, and E formulations were chosen for further study.
Table 7: Emulsification time deforming of PTF-SNEDDS formulations.
|
Code |
Observation |
Emulsification time (sec) |
|
|
In SIF |
In SGF |
||
|
A |
Clear-yellowish |
45.29 |
49.44 |
|
B |
Clear-yellowish |
47.09 |
50.06 |
|
C |
White emulsion |
112.16 |
99.36 |
|
D |
Clear-yellowish |
35.12 |
43.58 |
|
E |
Clear-yellowish |
43,22 |
44.34 |
|
F |
Less clear, bluish-white |
63.91 |
80.50 |
|
G |
Less clear, bluish-white |
64.21 |
81.10 |
|
H |
Less clear, bluish-white |
71.32 |
84.02 |
|
I |
Less clear, bluish-white |
82.79 |
91.55 |
|
J |
Less clear, bluish-white |
87.99 |
94.26 |
Characterization of formulation
Optical clarity
The clarity level of nanoemulsion is determined by the percentage of transmittance. As presented in Table 8, the percentage of transmission for formulations was high (>90%), indicating that all the formulations have great clarity level (>90%), thus confirming its transparency. This can reduce the chance of drug precipitation and improve solubilization limit34. This result allows the formulation variables like globule size and uniformity to be predicted.
Table 8: Clarity level of PTF-SNEDDS formulation.
|
Code |
Percentage of transmittance (%) |
|
A |
99.3 |
|
B |
98.2 |
|
D |
98.2 |
|
E |
98.6 |
All four formulations exhibited great clarity level (>90%) upon dilution 50 times with distilled water. The formulation chosen as the best among the four was formulation A, due to its higher content of oil. High oil content with adequate surfactant enables formation of more rapid and stable nanonemulsion35.
FTIR
In FT-IR spectra of P. tectorius extract (Figure 2), 3379.29 cm-1 was stretching vibration peak of O-H phenolic, and 2924.09 and 2862.36 cm-1 C-H (methylene group). 1373.32 cm-1 was symmetrical bending and 1458.18 cm-1 was asymmetrical bending vibration peak of C-H (methyl group, aromatic ring), 1249.87 cm-1 was a band from C-O stretching vibration in phenols. These are the characteristics of phenolic compound due to P. tectorius fruit has high content of phenolic8,9.
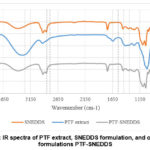 |
Figure 2: IR spectra of PTF extract, SNEDDS formulation, and optimized formulations PTF-SNEDDS. |
The main peaks of extracts were shown in optimized PTF-SNEDDS
formulation and there was no chemical interaction that occurred among P. tectorius extract, oil, surfactant,
and co-surfactant. These results suggest that the excipients were compatible
with P. tectorius extract, and its
performance characteristics was not altered.
Determination of particle size and polydispersity index
Nanoemulsion’s particle size is very important, as the size determines the drug’s stability and bioavailability36,37. Smaller particle size results in higher drug absorption and improved bioavailability38. The size of particle in optimized formulation is as presented in Table 9. PTF-SNEDDS’s optimized formulations have nanometric particle size (<100 nm). The nano range size increases bioavailability as it provides a wider interfacial surface zone for the drug to be absorbed. Polydispersity index (PDI) was below 50%, which indicates that globule size distribution is unfiorm36,39.
Zeta potential measurement
Zeta potential refers to the potential difference that may exist between the surface of firmly joined layer at the solution’s shear plane and electroneutral region. Its value may denote colloidal dispersions’ solubility. For small particles, a high zeta potential indicates that the solution or dispersion is stable and can resist aggregation38,39. From the results, the optimized formulations were negative charged with a value of -25.9 mV, which means that the system is stable and emulsion globules are separated40. Negative charged interface was produced by non-ionic surfactants at neutral pH because of the differential adsorption of the hydroxyl ion (OH–) and oxonium ion (H3O+)41.
Table 9: Characterization of particle size, zeta potential, and polydispersity index of PTF-SNEDDS.
|
Code |
Particle size (nm) |
Zeta potential (mV) |
Polydispersity index (%) |
|
A |
41.5 ± 1.1 |
-25.9 ± 1.2 |
25.35 ± 1.2 |
In vitro antioxidant study
The in vitro research intended to determine whether SNEDDS formulation influenced the antioxidant activity of PTF extracts. The antioxidant activity of PTF extract and PTF-SNEDDS were assessed by DPPH scavenging activity. There were differences between the antioxidant activity of PTF extracts loaded to SNEDDS and that of PTF crude extracts.
It has been demonstrated that all samples were able to inhibit DPPH mean oxidation. The results (Figure 3) showed that PTF-SNEDDS in every concentration from 10-60 µg/mL have greater DPPH scavenging activity than P. tectorius fruit crude extracts. SNEDDS formulation improved solubility of crude extracts in aqueous solution, so it resulted in higher antioxidant activity.
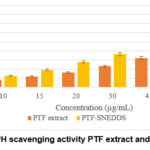 |
Figure 3: DPPH scavenging activity PTF extract and PTF-SNEDDS |
Conclusion
The results of the present study suggest that the optimized Pandanus tectorius extract SNEDDS formulation is composed of caprylic triglycerides as oil phase, Kolliphor RH40 as surfactant, and Propylene glycol as co-surfactant. This optimized formulation was robust to dilution in various media, and it exhibited no signs of separation or precipitation. The size of the particles was in nanometric measurement (41.5 ± 1.1 nm), while the zeta potential was at -25.9 ± 1.2 mV, indicating good stability. The emulsification study in simulated gastric and intestinal fluid showed no aggregation or precipitation for 4 h at 37oC. This implies that the formulation can maintain its nanoemulsion form for 4 h in gastrointestinal tract. In vitro antioxidant activity of extracts and PTF-SNEDDS formulations showed that SNEDDS formulation can increase PTF extracts’ antioxidant activity as the solubility odf the extracts’ in aqueous solution was improved improved.
Acknowledgement
The authors wish to thank the Ministry of Higher Education (MOHE) Malaysia for research funding under the Fundamental Research Grant Scheme (FRGS) Fasa I 2020/2021 (Vote No. 59639).
Conflict of Interest
The corresponding authors declare that there is no conflict of interest.
References
- World Health Organization (WHO), World Heal Organ., 2020, 1.
- Mahidin DSDMU. Press Release Statistics on Causes of Death, Published online 2021,1-8.
- Taniyama, Y.; Griendling, KK., Hypertension, 2003, 42(6), 1075-1081.
CrossRef - Shang., A.; Gan, R.; Xu, X.; Mao, Q.; Zhang, P.; Li, H-BL., Crit. Rev. Food Sci. Nutr., Published online 2020,1-17.
- Liu, Z.; Niu, F.; Xie, Y.; Xie, S.; Liu, Y.; Yang, Y.; Zhou, C.; Wan, X., Biomed. Pharmacother., 2020, 129, 1-21.
CrossRef - Uritu, C. M.; Mihai, C. T.; Stanciu, G.; Dodi, G.; Alexa-stratulat, T.; Luca, A.; Stefanescu, R.; Bild, V.; Melnic, S.; Tamba, B. I., Pain Res. Manag., 2018, 1-44.
CrossRef - Andriani, Y.; Ramli, N. M.; Syamsumir, D. F.; Kassim, M. N. I.; Jaafar, J.; Aziz, N. A.; Marlina, L.; Musa, N. S.; Mohamad, H., Arab. J. Chem., 2019, 12(8), 3555-3564.
CrossRef - Zhang, X.; Guo, P.; Sun, G.; Chen, S.; Yang, M.; Fu, N.; Wu, H.; Xu, X., J. Med. Plant Res., 2012, 6(13), 2622-2626.
- Liu, H.; Zhang, X.; Wu, C.; Wu, H.; Guo, P.; Xu, X., J. Appl. Pharm. Sci., 2013, 3(8), 16-19.
- Pangestika, I.; Oksal, E.; Tengku Muhammad, T. S.; Amir, H.; Syamsumir, D. F.; Wahid, M. E. A.; Andriani, Y., Saudi J. Biol. Sci., 2020, 27(8), 1947-1960.
CrossRef - Buya, A.B.; Beloqui. A; Memvanga, P.B.; Préat, V., Pharmaceutics. 2020, 12(12), 1-52.
CrossRef - Nazzal. S; Nutan, M.; Palamakula, A.; Shah, R.; Zaghloul, A. A.; Khan, M.A. Int. J. Pharm., 2002, 240(1-2), 103-114.
CrossRef - Prihapsara, F.; Wijayanti, I. I.; Budiharjo, A.; Pangastuti, A.; Artanti, A. N. Pharm. Sci. Asia., 2021, 48(1), 90-98.
CrossRef - Mukubwa, G. K.; Nkanga, C.I.; Buya, A.B.; Mbinze, J.K.; Krause, R. W. M.; Memvanga, P.B. J. Pharm. Pharmacogn. Res., 2020, 8(3), 177-190.
- Date, A. A.; Dixit, R.; Nagarsenker, M., Nanomedicine, 2010, 5(10), 1595-1616.
CrossRef - Nugroho, B. H.; Syifaudin, M. R.; Fauzi, L. R.; Anggraini, E.; Ritonga, H. O., J. Phys. Conf. Ser., 2020, 1445(1), 1-6.
CrossRef - Bhagwat, D. A.; Swami, P. A.; Nadaf, S. J.; Choudhari, P. B.; Kumbar, V. M.; More, H. N.; Killedar, S. G.; Kawtikwar, P. S., J. Pharm. Sci., 2021, 110(1), 280-291.
CrossRef - Abd-Elhakeem, E.; Teaima, M. H.; Abdelbary, G. A.; El Mahrouk, G. M., J. Drug Deliv. Sci. Technol., 2019, 49, 603-614.
CrossRef - Sakloetsakun, D.; Dünnhaupt, S.; Barthelmes, J.; Perera, G.; Bernkop-Schnürch, A., Int. J. Biol. Macromol., 2013, 61, 363-372.
CrossRef - Wulandari, E.; Alverina, A.; Martien. R., Int. J. Adv. Res. 2016, 4(11), 1031-1043.
CrossRef - Suryani; Zubaydah, W. O. S.; Sahumena, M. H.; Adawia, S.; Wahyuni, R.; Adjeng, A. N. T.; Nisa, M.; Kasmawati, H.; Ihsan, S.; Ruslin; Aswan, M., AIP Conf. Proc., 2019, 2199, 070011-8.
CrossRef - Kassem, A. A.; Mohsen, A. M.; Ahmed, R. S.; Essam, T. M., J. Mol. Liq., 2016, 218, 219-232.
CrossRef - Akhtartavan. S.; Karimi, M.; Karimian, K.; Azarpira, N.; Khatami, M.; Heli, H., Biomed. Pharmacother., 2019, 109, 2427-2433.
CrossRef - Kommuru, T. R.; Gurley, B.; Khan, M. A.; Reddy, I.K., Int. J. Pharm., 2001, 212(2), 233-246.
CrossRef - Elnaggar, Y. S. R.; El-Massik, M. A.; Abdallah, O. Y., Int. J. Pharm. 2009, 380(1-2), 133-141.
CrossRef - Constantinides, P. P., Pharm. Res. An. Off. J. Am. Assoc. Pharm. Sci. 1995, 12(11), 1561-1572.
CrossRef - Pouton, C. W.; Porter, C. J. H., Adv. Drug Deliv. Rev., 2008, 60(6), 625-637.
CrossRef - Wang, L.; Dong, J.; Chen, J.; Eastoe, J.; Li, X., J. Colloid Interface Sci. 2009, 330(2), 443-448.
CrossRef - Dash, R. N.; Mohammed, H.; Humaira, T.; Ramesh, D., Saudi Pharm. J. 2015, 23(5), 528-540.
CrossRef - Lawrence, M. J.; Rees, G.D., Adv. Drug Deliv. Rev., 2000, 45(1), 89-121.
CrossRef - Beg, S.; Swain, S.; Singh, H. P.; Patra, C. N.; Rao, M. B., AAPS Pharm. Sci. Tech., 2012, 13(4), 1416-1427.
CrossRef - Nasr, A.; Gardouh, A.; Ghorab, M., Pharmaceutics. 2016, 8(20), 1-29.
CrossRef - Alwadei, M.; Kazi, M.; Alanazi, F. K., Saudi Pharm. J. 2019, 27(6), 866-876.
CrossRef - Ali, H. H.; Hussein, A. A., AAPS Open. 2017, 3(6), 1-17.
CrossRef - Xi, J.; Chang, Q.; Chan, C. K.; Meng, Z. Y.; Wang, G. N.; Sun, J. B.; Wang, Y. T.; Tong, H. H. Y.; Zheng, Y., AAPS Pharm. Sci. Tech. 2009, 10(1), 172-182.
CrossRef - Shakeel, F.; Haq, N.; Alanazi, F. K.; Alsarra, I. A., Powder Technol., 2014, 256, 352-360.
CrossRef - Balakumar, K.; Raghavan, C. V.; Selvan, N. T.; Prasad, R. H.; Abdu, S., Colloids Surfaces B. Biointerfaces., 2013, 112, 337-343.
CrossRef - Parmar, N.; Singla, N.; Amin, S.; Kohli, K., Colloids Surfaces B. Biointerfaces. 2011, 86(2), 327-338.
CrossRef - Agrawal, A. G.; Kumar, A.; Gide, P. S., Drug Dev. Ind. Pharm., 2015, 41(4), 594-604.
CrossRef - Choi, K. O.; Aditya, N. P.; Ko, S., Food Chem., 2014, 147, 239-244.
CrossRef

This work is licensed under a Creative Commons Attribution 4.0 International License.
About The Author
![]()
A New Edition of Web of Science
Journal Impact Factor
2022: 0.5
Five Year: 0.8
Journal is Indexed in

Cabells Whitelist
![]()


