Development and Validation of a Green UPLC Analytical Procedure for Glibenclamide Determination in Pharmaceutical Product Using Response Surface Methodology
Mohamed Abbas Ibrahim1,2, Doaa Hasan Alshora1*, Malak Ahmed Alowayid1, Nouf Ayed Alanazi1 and Rayan Ali Almutari1
1Kayyali Chair for Pharmaceutical Industries, Department of Pharmaceutics, College of Pharmacy, King Saud University, Riyadh, KSA.
2Department of Pharmaceutics, College of Pharmacy, Al Azhar University, Assiut, Egypt
Corresponding Author E-mail: dalahora@ksu.edu.sa
DOI : http://dx.doi.org/10.13005/ojc/380405
Article Received on : 27 Jun 2022
Article Accepted on : 28 Jul 2022
Article Published : 08 Aug 2022
Reviewed by: Dr. Faiz Bin Arith
Second Review by: Dr T Veeraiah
Final Approval by: Dr Sama Jayapal Reddy
Glibenclamide (GB) is one of the drugs that is used in the first line for the management of the diabetes mellitus. The aim of this work is to develop a unique green UPLC analytical procedure to analyze GB in pharmaceutical products by implementing QbD (Quality by Design) approach. 32 full factorial design was applied to study the effect of three levels of formic acid (X1; 0.05-0.5%) and temperatures (X2; 25-55oC), for their effects on retention time (Y1), peak area (Y2), peak height (Y3), and HPLC-EAT; environmental assessment tool (Y4). A green mobile phase, which is composed of Methanol 70% and water 30% containing different concentrations of formic acid, was pumped in Isocratic elution mode at a flow rate of 0.2 ml/min, with a total run time of 3.0 min with UV detection at 225 nm. Subsequently, this method was successfully validated using several validation parameters according to ICH guidelines. The results showed that temperature had a significant indirect effect on retention time (P value = 0.001), while formic acid concentration had a significant indirect impact on Peak Area (P value = 0.0101). The peak height was highly affected with formic acid concentration as well as the temperature with 0.005. Furthermore, HPLC-EAT was highly affected by column temperature in an indirect way. The optimized green method was discovered to be acceptable in terms of selectivity, precision, accuracy, robustness, sensitivity, and specificity. Moreover, the method efficaciously separated GB peak in the presence of its degradation products in different harsh conditions, revealing stability-indicating property.
KEYWORDS:Factorial design; Formic acid; Glibenclamide; HPLC-EAT; UPLC
Download this article as:| Copy the following to cite this article: Ibrahim M. A, Alshora D. H, Alowayid M. A, Alanazi N. A, Almutari R. A. Development and Validation of a Green UPLC Analytical Procedure for Glibenclamide Determination in Pharmaceutical Product Using Response Surface Methodology. Orient J Chem 2022;38(3). |
| Copy the following to cite this URL: Ibrahim M. A, Alshora D. H, Alowayid M. A, Alanazi N. A, Almutari R. A. Development and Validation of a Green UPLC Analytical Procedure for Glibenclamide Determination in Pharmaceutical Product Using Response Surface Methodology. Orient J Chem 2022;38(3). Available from: https://bit.ly/3P71jK6 |
Introduction
The term Green Analytical Chemistry (GAC) is defined as the design and development of analytical methods for the determination of specific compounds in a given sample, aimed at reducing the use and generation of hazardous substances without compromising the efficiency of the analytical process. This could be achieved by minimizing or avoiding waste generation, using renewable or less toxic chemicals, and minimizing sample volume of sample to be injected [1, 2].
There are several strategies to render the traditional liquid chromatographic method greenness. This could be achieved by reducing the consumption of the mobile phase by using a short column or by increasing the temperature or by using environmentally friendly solvents such as water, ethanol, acetone, and other solvents or by using a liquid mixture with improved flowability by mixing the mobile phase with liquefied gas such as carbon dioxide.
The ideal HPLC solvents for green analysis should have high selectivity, solubility, low environmental impact and toxicity, be recyclable, and be derived from renewable resources [3]. The safest and most environmentally friendly solvents are water, ethanol, acetone, ethyl acetate, and methanol [4] and they are recommended in the GlaxoSmithKline (GSK) Solvent Guide.
To evaluate the environmental friendliness of the solvent, various HPLC Environmental Assessment Tools (HPLC-EAT) can be used. This is a simple, efficient and specific tool that assesses the greenness of the method according to the mobile phase solvents used [5]. This tool scores the solvents based on their environmental, health and safety impacts. The total score of HPLC-EAT can be calculated by summing the scores of each factor according to the equation [6]:

Where S, H, and E represent the safety, health and environmental factors, respectively, for number of solvents (n), and m represent the mass of the solvents.
Analytical Quality by Design (AQbD) is a branch of QbD applied to analytical procedures. In general, quality is a built-in system rather than a result. In the case of AQbD, it is based on target measurement known as analytical target profile (ATP) and critical quality attributes (CQA). The main advantage of QbD is the reduction in the number of out-of-trend (OOT) and out-of-specification (OOS) results [7].
The chemical name of Glibenclamide is 5-chloro-N-[2-[4 – (cyclohexylcarbamoyl sulfamoyl) phenyl]ethyl] – 2 -methoxybenzamide (Fig. 1). Glibenclamide or glyburide (GB) is an oral antihyperglycemic drug from the second-generation sulfonylurea group. It is used to treat type II non-insulin-dependent diabetes mellitus (type II DM) by stimulating the release of insulin through the closure of ATP-sensitive potassium channels on beta cells in pancreatic islets, thereby increasing intracellular potassium and calcium ion concentrations [8].
 |
Figure 1: Structure of Glibenclamide. |
Several techniques have been described for the determination of GB either in pure drugs, commercially available products or biological fluids., including spectrophotometry [9], high-performance liquid chromatography (HPLC) [10,11], and ultra-performance liquid chromatography (UPLC) [12-15]. Although UPLC has been used to determine GB, it should be noted that in previous UPLC studies, neither method relies on green analytical chemistry.
Among all the literature studies on GB analysis, there is only one method based on green chemistry, and that is the reversed-phase HPLC method (RP-HPLC) developed by Haq et al. in which ethanol: methanol (50:50 v/v) was used as the mobile phase [10]. However, the solvent flowed at a rate of 1 mL/min and the drug was separated at a retention time of 2.5 min, which means a higher consumption of mobile phase and time. Moreover, the effect of analytical parameters on analytical reactions was not specified.
The aim of the present method was to develop a green, simple and sensitive analytical UPLC procedure for the determination of GB as a pure drug and in pharmaceutical dosage form. A design of experiments was used to investigate the effects of different concentrations of formic acid and different column temperatures on the analytical responses, including retention time (X1), peak area (X2), peak height (X3), and HPLC-EAT.
Materials and Methods
Materials
Glibenclamide (GB) was supplied by SPIMACO Pharmaceutical company (Qassim, KSA). Formic acid ≥ 98% was obtained from Sigma-Aldrich (Steinheim, Germany). HPLC grade methanol (Riedelde Haën Laboratory Chemicals, Selzer, Germany). Deionized water was obtained from a Milli-Q water purification system (Millipore, USA).
Methods
Design of Experiment (DoE)
A 32 full factorial experimental design was used to characterize the effect of two independent factors, formic acid concentration (X1) and column temperature (X2), on the analytical attributes of the Glibenclamaide. These attributes (responses) were GB chromatogram retention time, Peak area, Peak height and HPLC-EAT. Using Design Expert® Software, the low, medium and high levels of each factor were specified as shown in Table 1. A set of nine experiments were performed as shown in design matrix in Table 2.
System and Conditions
The study was carried out with a highly sensitive UPLC system (Ultimate 3000®️ binary solvent manager) equipped with automatic sampler and a Photodiode Array (PDA) detector. The separation was achieved by reverse-phase isocratic elution using a mobile phase consisting of 70% Methanol and 30% Water containing different concentrations of formic acid delivered at 0.2ml/min flow rate through an Acquity®️ UPLC column HSS C18 (2.1×50 mm, 1.7μm). The total run time is 3.0 min, and recognition was performed at 225 nm studied at different temperature. A working solution of 50 ppm of GB in methanol was used in the QbD analytical procedures.
Table 1: Matrix of 32 Statistical design for analytical procedure of Glibenclamide using UPLC.
|
Independent factors |
Run |
X1 Formic acid (%) |
X2 Temperature (°C ) |
Dependent factors (Response) |
|
X1: Formic acid (%)
X2: Temperature (°C)
|
1 |
0.275 |
40 |
Retention time (min); Y1 Peak area (mAU/min); Y2 Peak height (mAU); Y3 HPLC-EAT; Y4 |
|
2 |
0.275 |
25 |
||
|
3 |
0.05 |
55 |
||
|
4 |
0.5 |
25 |
||
|
5 |
0.275 |
55 |
||
|
6 |
0.5 |
55 |
||
|
7 |
0.05 |
25 |
||
|
8 |
0.5 |
40 |
||
|
9 |
0.05 |
40 |
Preparation of Standard Stock Solution, Calibration and Quality control samples
Stock solution containing 100 ppm was prepared by dissolving 0.01 g of GB in 100 ml of methanol. A serial dilution (1-100 ppm) from previous stock was prepared in methanol. Triplicate injections of each concentration were performed. Quality control samples have been selected within the range (1-100 ppm) as a low, intermediate and high concentrations: 2, 50 and 75 ppm.
UPLC Analytical Validation
The analytical procedure was validated according to Guidelines of USFDA for Bioanalytical methods [16] and European Medicines Agency [17]. It was evaluated in terms of linearity, sensitivity, precision, accuracy, limit of detection and limit of quantitation. All the tests and measurements were carried out in triplicate to calculate the mean and the SD.
Linearity LOD and LOQ
A stock solution (100 µg/ ml) of GB was prepared in methanol and used to prepare eight standard concentrations. An exact volume was taken from the stock solution and diluted with methanol to obtain concentrations range of 1-100 ppm. Linearity was estimated by calculating the correlation coefficient (R).
The LOD and LOQ were calculated using the following equations [10]:
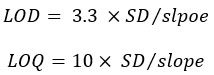
Accuracy and Precision
Accuracy was assessed by determining the percentage of drug recovered. Three concentrations (2, 50, and 75 PPm) were injected in triplicate. For intraday precision, freshly prepared standard solution containing the same concentrations was injected on one day; for interday precision (as intermediate precision), it was injected on three different days. The overall precision of the method was expressed as relative standard deviation (% RSD) and the accuracy of the method was expressed as percentage of recovered drug. The experiment was performed in triplicate.
Robustness
Robustness explains how the analytical procedure can tolerate any small changes in the conditions such as flow rate, column age, column temperature, detection wavelength, etc. and other environmental factors like room temperature, humidity, etc. In the present study two parameters: flow rate (0.20, 0.22 and 0.18 ml/min) and wavelength (220, 225 and 230 nm) were changed.
Forced degradation studies
To determine the stability-indicating properties and the specificity of this developed method, a target concentration of 50 ppm was exposed to different harsh conditions such as 0.1 N HCl for acidic stress, 0.1 N NaOH for basic stress and 30% H2O2 for oxidative reaction as well as thermal stress. One part of the selected concentrations (50 ppm) of freshly prepared GB was mixed with 4 parts of 0.1 M HCl, 0.1 M NaOH and 30% hydrogen peroxide (H2O2) separately. Whereas in the case of thermal stress, 5 ml of the same target concentration was placed in a hot air oven for 2 days at 50°C.
Results and Discussion
Design of Experiment (DoE)
Table 2 represents the observed measurement of the dependent parameters in term of peak height, peak area, retention time and HPLC-EAT.
Table 2: The Observed responses for analytical procedure of GB using UPLC.
|
Run |
X1 Formic acid (%) |
X2 Temperature (oC) |
Retention Time (min) |
Peak Area (mAU/min) |
Peak Height (mAU) |
HPLC-EAT |
|
1 |
0.275 |
40 |
1.58±0.00 |
50.31±0.11 |
201.48±0.23 |
3.82±0.00 |
|
2 |
0.275 |
25 |
1.90±0.01 |
50.42±0.03 |
184.09±0.39 |
4.60±0.02 |
|
3 |
0.05 |
55 |
1.38±0.00 |
46.72±0.12 |
198.41±0.71 |
3.34±0.00 |
|
4 |
0.5 |
25 |
1.94±0.00 |
43.51±0.28 |
158.33±0.47 |
4.70±0.01 |
|
5 |
0.275 |
55 |
1.36±0.00 |
49.64±0.25 |
216.26±1.48 |
3.29±0.00 |
|
6 |
0.5 |
55 |
1.37±0.00 |
44.12±0.09 |
190.36±0.62 |
3.31±0.00 |
|
7 |
0.05 |
25 |
2.23±0.03 |
56.56±0.94 |
174.52±1.20 |
5.41±0.07 |
|
8 |
0.5 |
40 |
1.61±0.00 |
43.57±0.14 |
172.91±0.41 |
3.89±0.00 |
|
9 |
0.05 |
40 |
1.70±0.02 |
49.54±0.62 |
183.98±0.94 |
4.11±0.04 |
Effect of independent analytical parameters on GB chromatogram retention time (RT).
As shown in the ANOVA table (Table 3), the temperature has a significant antagonistic effect on retention time (P value = 0.001) of GB chromatogram. In contrast, on the concentration of formic acid, quadratic effects as well as interactive effects (X1X2) on retention time were found insignificant (P value was higher than 0.05). The individual effects plot in Figure 2 and the 3D response surface plot (Figure 3a) illustrate that increasing column temperature resulted in shortening the retention time of GB chromatogram, while the formic acid concentration and interactive effects (X1X2) have no effect on retention time.
Several studies showed that the retention time is highly affected by the column temperature. Increasing the column temperature may decrease the mobile phase solvent viscosity and thus lowering the backpressure [18,19]. The effects of formic acid concentration may not affect the retention time, in most cases the acidic concentration affects the ionization status of the drug which may affect its elution efficiency and resolution but not the retention time [20].
Effect of independent analytical parameters on GB chromatogram Peak Area
The results of ANOVA analysis showed that the individual effect of formic acid concentration and the interactive effect of formic acid temperature (X1X2) had a significant impact on the peak area of the GB chromatogram with a P value of 0.0101 and 0.0414, respectively (Table 3). The effect of temperature and the quadratic effect of the two independent factors showed no significant effect on the peak area. The analysis showed that the formic acid concentration had an antagonistic effect on the peak area of the GB chromatogram. An increase in acid concentration resulted in a decrease in area (Figure 2). This could be attributed to the nature of the analyte. Since GB is an acidic drug and elution depends on ionization, an increase in formic acid concentration converts the drug into unionized form and thereby the elution efficiency decreases [20].
The 3D response surface plot in Figure 3b shows that the peak area of the GB chromatogram reached its highest value (56.56±0.94 mAU/min; Table 2) at the lowest formic acid concentration (0.05%), while there is no significant effect of temperature was observed as seen in run 9 and 3. In more details, at a constant formic acid concentration (0.05%) and an increase in temperature from 40 to 55oC, the peak areas were 49.54±0.62 and 46.72±0.12 mAU/min, respectively (Table 2).
Effect of independent analytical parameters on GB chromatogram peak height
The ANOVA analysis clarifies that the concentration of formic acid and the quadratic effects, as well as the individual effect of column temperature, exerted a significant impact on the peak height of the GB chromatogram, while the interactive effect influenced the response (Table 3).
Figure 2 revealed that increasing the formic acid concentration up to a certain limit of 0.05 to 0.275% resulted in a significant increase in peak height from 198.41±0.71 mAU (run 3) to 216.26±1.48 mAU (run 5) (Table 2). An antagonistic effect on peak height was associated with a higher concentration of formic acid, as seen in run 5 and 6. Peak height decreased from 216.26±1.48 to 190.36±0.62 mAU with an increase in concentration from 0.275 to 0.5% (Table 3). This is also somewhat related to the ionization status, by increasing the pH of formic acid to 0.5%, the mobile phase becomes acidic and the drug appears in the ionized form, resulting in lower resolution, which is reflected in the peak height [20].
At constant formic acid concentration (0.275%), the peak height increased dramatically by increasing the temperature from 25 to 55°C, reaching the extreme height of 216.26±1.48 mAU. Moreover, the 3D response surface in Figure 3c showed that the highest peak height was reached at the highest temperature with an intermediate formic acid concentration.
Yang et al. showed that the retention time and peak area of chromatograms of analytes decrease with increasing column temperature. However, the column efficiency is either improved or remains almost unchanged with increasing temperature in the low temperature range [21].
Effect of independent analytical parameters on HPLC Environmental Assessment Tool (HPLC-EAT)
Table 3 shows that the HPLC-EAT is affected antagonistically and significantly by temperature with P value of 0.001. Figure 2 indicates that increasing column temperature led to dramatic reduction in the HPLC-EAT score. The 3D response plot shows (Figure 3d) that the HPLC-EAT reached its highest value of 5.41±0.07 with lowest temperature of 25oC, and when column temperature increased to 55oC the HPLC-EAT score decreased to lowest value of 3.29±0.00(Table 2).
Table 3: ANOVA for the effects of independent analytical parameters on GB chromatogram attributes.
|
Response |
Source |
Sum of Squares |
p-value |
|
Retention Time |
A-Formic acid concentration |
0.0241 |
0.0887 |
|
B-Temperature |
0.6403 |
0.0010 |
|
|
AB |
0.0196 |
0.1104 |
|
|
A² |
0.0162 |
0.1339 |
|
|
B² |
0.0098 |
0.2106 |
|
|
Peak Area |
A-Formic acid concentration |
78.48 |
0.0101 |
|
B-Temperature |
16.70 |
0.0746 |
|
|
AB |
27.30 |
0.0414 |
|
|
A² |
15.68 |
0.0802 |
|
|
B² |
1.02 |
0.5538 |
|
|
Peak Height |
A-Formic acid concentration |
207.21 |
0.0050 |
|
B-Temperature |
1293.31 |
0.0003 |
|
|
AB |
16.56 |
0.1249 |
|
|
A² |
870.84 |
0.0006 |
|
|
B² |
1.58 |
0.5606 |
|
|
HPLC-EAT |
A-Formic acid concentration |
0.1536 |
0.0804 |
|
B-Temperature |
3.79 |
0.0010 |
|
|
AB |
0.1156 |
0.1094 |
|
|
A² |
0.0998 |
0.1272 |
|
|
B² |
0.0567 |
0.2124 |
 |
Figure 2: Effects of individual analytical parameters on GB chromatogram attributes. |
 |
Figure 3: Plot of 3D response surface for temperature and formic acid concentrations on a) retention time, b) peak area, c) peak height and d) HPLC-EAT |
Optimization of UPLC conditions for GB analysis
After the statistical analysis of each dependent factors, the optimization was based on several desirability. Those are minimum GB chromatogram retention time, maximum peak area, maximum peak height and minimum HPLC-EAT.
Based on the modeling performed by the statistical software, the following conditions were suggested by the software for the optimal UPLC analysis procedure for GB analysis: temperature (X1) = 40oC and formic acid (X2) = 0.231% (Table 4). The predicted and observed values of responses are also shown in Table 4. The observed values were close to the predicted optimized values for GB UPLC analysis conditions. The observed retention time of the GB chromatogram was 1.56±0.01 min (predicted retention time was 1.5 min). The observed peak area was 51.65±0.23 mAU/min compared with the predicted value (50.26 mAU/min). In addition, the peak height was 206.09±0.67 mAU (predicted value is 200.36 mAU) and the HPLC-EAT value was 3.77±0.01 (predicted is 3.83).
Figure 4 shows the UPLC chromatogram of GB obtained with the optimized analytical conditions. The peak of the drug appeared at 1.56 min unlike other HPLC methods used to analyze GBThe developed UPLC method analyzes the drug with good sensitivity and at short retention time (1.56 min). Haq et al. used a green HPLC method using methanol: ethanol (50: 50) as the mobile phase to analyze GB [10]. The peak was observed at 2.5 min, while in Al-Adl et al [11], who used a non-green method, the drug was eluted at 5.1 min by using acetonitrile: water (60:40) as the mobile phase. Shortening the elution time can bring several advantages, including shortening the overall run time and reducing the solvent consumption, which in turn can extend the column lifetime.
The tailing and asymmetry factors for the drug chromatogram of the optimized conditions were evaluated for according to the following equations [22]:
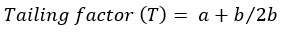
where b is the peak width after the peak center at 20% peak height; and a is the peak width at before the peak center
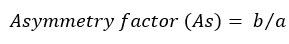
where b is the peak width after the peak center at 10% peak height; and a is the peak width at before the peak center.
The chromatogram has a tailing factor of 0.833 and asymmetry factor of 1.16. The results showed an acceptable peak shape according to the FDA guidelines [22]. In addition, the peak has a good resolution with a symmetry factor less than 2.
All these make the developed UPLC method an environmentally friendly and sensitive method.
 |
Figure 4: UPLC chromatogram of optimized conditions for GB analysis using UPLC. |
Table 4: The predicted and observed value of optimum condition of GB analytical procedure using UPLC.
|
Optimized independent parameters |
Response |
|||
|
Type |
Desirability |
Predicted |
Observed |
|
|
Temperature (A) = 40 oC
Formic acid (B) = 0.231 % |
Y1: Retention time (min) |
Minimum |
1.58 |
1.56±0.01 |
|
Y2: Peak area (mAU/min) |
Maximum |
50.26 |
51.65±0.23 |
|
|
Y3: Peak height (mAU) |
Maximum |
200.36 |
206.09±0.67 |
|
|
Y4: HPLC-EAT |
Minimum |
3.83 |
3.77±0.01 |
|
Validation procedures
Calibration of GB using the optimized UPLC green analytical procedure
The standard calibration curve of GB using UPLC optimized analytical procedures at λmax 225 nm is shown in Figure 5. It is clearly evident that Beer Lambert Law can be applied only in concentration range of 1-100 ppm, which is linear over the determined concentrations (R = 0.9996). The drug concentration can be calculated from the equation:
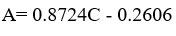
Where A is the peak area of the sample at 225 nm and C is the concentration (ppm).
 |
Figure 5: The calibration curve of GB using optimized UPLC analytical conditions (n= 3). |
Linearity
The calibration curve was linear in the range of 1-100 ppm with a high correlation coefficient (R²) value of 0.9993 and the linear regression equation was Y = 0.8724 X – 0.2606 (Table 5). The results showed a direct proportion between the concentration and the peak area. The smallest value of the slope indicates that this method is sensitive and can detect a very small change on the peak area as a reflection of concentration changes.
Limit of Detection and Limit of Quantitation
Based on the standard deviation of the axis intercept and the slope of the calibration curve equation, LOD and LOQ were determined (Table 6). The results showed that the smallest detectable amount (LOD) was 0.193 μg/mL and the smallest accurately and precisely detectable amount was 0.58 μg/mL. The results show the sensitivity of the developed method compared with other HPLC methods, which can detect 0.32 μg/mL and 0.96 μg/mLfor LOD and LOQ, respectively [11].
Accuracy
The accuracy of the developed UPLC analytical procedure was evaluated by analyzing three samples of GB reference drug of 2, 50, and 75 μg/mL. Table 6 shows that the percentage recovery was very high and ranged from 97.29 to 106.19%, which indicated the accuracy of the developed method.
Precision
The precision data were presented in Table 8. The calculated RSD% for intra-day and inter-day was less than 2% (Table 7). The RSD% values were in the range of 0.31-2.06 and 0.15-2.06 for intraday and intermediate precision, respectively. Low value of RSD% indicated the precision of the proposed analytical method.
Robustness
The robustness study was performed by changing the flow rate and wavelength. The values obtained for the statistical parameters of chromatographic responses (retention time, peak area and peak height) for all variations of detection wavelength and flow rate at the target concentration of 50 ppm are shown in Table 8. The calculated RSD % are significantly low and range from 0.11- 0.757 %, indicating the robustness of the developed UPLC method.
Table 5: Linear regression data of GB analysis using the optimized UPLC green analytical procedure (n= 3).
|
Parameters |
Value |
|
Linearity range |
0- 100 ppm |
|
Correlation coefficient |
R² = 0.9993 |
|
Intercept ± SD |
0.262±0.051 |
|
Slope± SD |
0.87±0.003 |
|
Regression equation |
Y = 0.8724 X – 0.2606 |
|
LOD |
0.19372 |
|
LOQ |
0.587031 |
Table 6: Accuracy of the optimized UPLC green analytical procedure for GB (% recovery, n = 3).
|
Concentration (ppm ) |
Area |
% Recovery |
RSD % |
|
2 |
1.85±0.04 |
106.19 |
2.06 |
|
50 |
42.31±0.13 |
97.29 |
0.31 |
|
75 |
67.69±0.61 |
103.76 |
0.61 |
Table 7: Precision of the optimized UPLC green analytical procedure for GB (n = 3).
|
Concentration (ppm ) |
Intra-day |
Inter-day |
||||||
|
Day 1 |
Day 2 |
Day 3 |
||||||
|
Area (mAU) |
RSD% |
Area (mAU) |
RSD |
Area (mAU) |
RSD% |
Area (mAU) |
RSD% |
|
|
2 |
1.85±0.04 |
2.06 |
1.85±0.04 |
2.06 |
1.87±0.04 |
2.15 |
1.87±0.02 |
0.84 |
|
50 |
42.31±0.13 |
0.31 |
42.31±0.13 |
0.31 |
42.50±0.07 |
0.16 |
42.62±0.06 |
0.15 |
|
75 |
67.69±0.61 |
0.61 |
67.69±0.61 |
0.61 |
68.19±0.15 |
0.23 |
68.35±0.16 |
0.23 |
Table 8: Robustness of the optimized UPLC green analytical procedure for GB (n = 3).
|
Parameters |
Responses |
|||||
|
Flow rate (ml/min) |
Ret. time |
RSD% |
Peak Area |
RSD% |
Peak Height |
RSD% |
|
0.18 |
1.748±0.005 |
0.288 |
49.601±0.375 |
0.757 |
174.331±0.739 |
0.424 |
|
0.2 |
1.58±0.00 |
0.11 |
42.50±0.07 |
0.156 |
168.43±0.19 |
0.112 |
|
0.22 |
1.441±0.002 |
0.12 |
38.757±0.079 |
0.203 |
167.192±0.409 |
0.244 |
|
Wavelength (nm) |
||||||
|
220 |
1.582±0.002 |
0.109 |
39.406±0.179 |
0.455 |
156.861±0.174 |
0.111 |
|
225 |
1.580±0.003 |
0.190 |
42.665±0.144 |
0.337 |
169.678±0.234 |
0.138 |
|
230 |
1.579±0.002 |
0.110 |
43.872±0.085 |
0.195 |
174.447±0.281 |
0.161 |
Forced degradation studies
The stability chromatograms of GB in the presence of various stresses are shown in Figure 6. The results of the stability study show that the alkaline stress condition was tolerated by GB and 95% of the drug was obtained with negligible peak area of the degradation product (0.271±0.006). In the case of hydrogen peroxide, most of the GB sample was degraded, leaving a small amount of GB (9%) with a peak area of 3.971±0.025. In the case of acid and thermal loading, almost 60% of the drug remained. Figure 6a shows the degradation of GB in presence of 0.1 M HCl, a breakdown of the carbonyl group could be occurred resulting in a degradation product with a peak appeared before the GB peak [23]. In addition, exposing the drug to harsh thermal condition is represented in Figure 6d, which reveals that a degradation peak appeared also before the GB peak. This degradation could be attributed to high system energy resulted from increasing the temperature. This high energy could be sufficient to breakdown the chemical bond in the GB molecule [24].
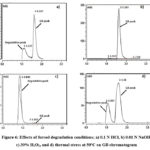 |
Figure 6: Effects of forced degradation conditions; a) 0.1 N HCl, b) 0.01 N NaOH, c) 30% H2O2, and d) thermal stress at 50oC on GB chromatogram |
Conclusion
The optimized green UPLC analysis procedure was found to be acceptable in terms of selectivity, precision, accuracy, robustness, sensitivity, and specificity. Moreover, the method effectively separated the GB peak in the presence of its degradation products under various harsh conditions, indicating a stability-indicating property. Therefore, the developed UPLC method can be used for routine analysis of GB in pure drugs and pharmaceutical dosage forms as an environmentally friendly alternative to the most hazardous substances in the field of pharmaceutical analysis.
Acknowledgement
This project was financially supported by King Saud University, Vice Deanship of Research Chairs, Kayyali Chair for Pharmaceutical Industries, through grant number MN-2022.
Conflict of Interest
All authors declare no conflict of interest.
Funding Sources
There is no funding source.
References
- Anastas, P. T.; Warner, J. C. Green Chemistry: Theory and Practice, Oxford University Press, Oxford, 1998.
- Zuin, V. G.; Segatto, M. L.; Ramin, L. Z. Green Chemistry in analytical chemistry. In: Han, B., Wu, T. (eds) Green Chemistry and Chemical Engineering. Encyclopedia of Sustainability Science and Technology Series. Springer, New York, NY, 2019, 613–636.
CrossRef - Claux, O.; Santerre, C.; Abert-Vian, M.,; Touboul, D.;Vallet, N.; Chemat, F. Curr. Opin. Green Sustain. Chem. 2021, 31, 2452-2236.
CrossRef - Tobiszewski, M.; Namiesnik, J. 2017. Curr. Opin. J. 2017, 5, 1-4.
- Gaber, Y.; Tornvall, U.; Kumar, M. A.; Amin, M. A.; Kaul, R. H. Green Chem. 2011, 13, 2021-2025.
CrossRef - Koller, G.; Fischer, U.; Hungerb¨uhler, K. Ind. Eng. Chem. Res. 2000, 39, 960–972.
CrossRef - Reid, G. L.; Ward, H.; Palm, S. A.; Muteki, K. American Pharmaceutical Review. 2012, 15 (4), 24-28.
- Sweetman, S.C. Ed. Martindale, the Complete Drug Reference, 33rd ed.; Pharmaceutical Press: London, 2002.
- Tawfeek, H. M.; Roberts, M.; El Hamd, M. A.; Abdellatif, A. A. H.; Younis, M. A. AAPS PharmSciTech. 2018, 19, 2948-2960.
CrossRef - Haq, N.; Alanazi, F. K.; Alsarra, I. A.; Shakeel, F. IraNn. J. Pharm. Res. 2014, 13, 863-872.
- El-Adl S. M.; El-Sadek, M. E.; Hasan, M. H. J. Appl. Pharm. 2017, 9, 1-6
CrossRef - Alam, M. A.; Al-Jenoobi, F. I.; Al-Mohizea, A. M. Int. J. Analyt. Chem. 2018, 2018, 1-8.
CrossRef - Chen, M.; Song, W.; Wang, S.; Chen, Q.; Pan, P.; Xu, T.; Hu, G.; Zheng, Z. J. Chromatogr. Sci. 2016, 54,1159-1165.
CrossRef - Fachi, M. M.; Cerqueira, L. B.; Leonart, L. P.; de Francisco, T. M.; Pontarolo, R. PLoS One. 2016, 11, 1-17.
CrossRef - Kim, N. S.; Kim, K. Y.; Yoo, G. J.; Lee, J. H.; Park, H. N.; Park, S. K.; Baek, S. Y. Food Addit. Contam. 2017, 35, 387-394.
CrossRef - U.S. Department of Health and Human Services Food and Drug Administration. Bioanalytical Method Validation Guidance for Industry. 2018
- European Medicines Agency. Guideline on bioanalytical method validation. 2011.
- Li, J. B.; Waters Corporation, Milford, M. A. Chromeextension://efaidnbmnnnibpcajpcglclefindmkaj/https://www.waters.com/webassets/cms/library/docs/watersamd30.pdf. Access date 22/06/2022.
- Waterlot, C.; Goulas, A. J. Chem, 2016, 2016, 1-12
CrossRef - Malenović, A.; Ivanović, D.; Medenica, M.; and Jančić, B. Acta Chim. Slov. 2004, 51, 559−566.
- Yang, Y.; Lamm, L. J.; He1, P.; Kondo T. J Chromat Sci. 2002, 40, 107-112.
CrossRef - Center for Drug Evaluation and Research, Validation of Chromatographic Methods, 1994.
- Bansal, G.; Singh, M.; Jindal, K. C.; Singh, S. J. AOAC Int. 2008, 91, 1-12.
CrossRef - Osma, N. S. H. Master dissertation. University of Gizera, 2007.

This work is licensed under a Creative Commons Attribution 4.0 International License.
About The Author
![]()
A New Edition of Web of Science
Journal Impact Factor
2022: 0.5
Five Year: 0.8
Journal is Indexed in

Cabells Whitelist
![]()


