Characterization of Blended Polymer Electrolyte Thin Films Based on PVDF + PEG Doped with Nano SiO2
K. Venkata Ramana1,2* , M. Chandra Shekar2 and V. Madhusudhana Reddy3
1Department of Applied Sciences, Maturi Venkata Subba Rao Engineering College, Hyderabad, Telangana, India.
2Department of Physics, JNT University, Hyderabad, Telangana, India.
3Department of S and H, Malla Reddy college of Engineering and Technology, Hyderabad, Telangana, India.
Corresponding Author E-mail: kotharamana@gmail.com
DOI : http://dx.doi.org/10.13005/ojc/380412
Article Received on : 13 Jun 2022
Article Accepted on : 07 Jul 2022
Article Published : 20 Jul 2022
Reviewed by: Dr. Maged Alfakeh
Second Review by: Dr. Ioana Stanciu
Final Approval by: Dr. Charanjit Kaur
Solution Casting Technique (SCT) is used to prepare the films of poly vinylidene difluoride (PVDF) + poly ethylene glycol (PEG) + nano silicon dioxide (SiO2.). Modifications in structure, thermal stability and energy band gap values of all prepared thin films have been studied using XRD, SEM, DSC and UV-Vis. The disappearance of a small dip at higher concentrations of DSC plots of nano SiO2 in PVDF+PEG indicates that the decrease in the crystallinity which also supported by XRD results. From the SEM results it is observed that, at 10 wt.% of nano SiO2 of concentration amorphous nature is more which leads increase in thermal stability of the material. FTIR results show strong growth in the CF2 stretching with increasing concentratration of nano SiO2 in PVDF+PEG and also the intensity of the aliphatic C-H scattering vibrational bands are observed in spectra of PVDF+PEG and PVDF+PEG+nano SiO2. The direct band gap values of PVDF+PEG+nano SiO2 polymer electrolyte indicates the influence of nano SiO2 on PVDF+PEG for better conducting properties.
KEYWORDS:Fourier Transform Infra-Red Spectrometer; Poly Vinylidene Difluoride; Poly Ethylene Glycol; Silicon Dioxide
Download this article as:| Copy the following to cite this article: Ramana K. V, Shekar M. C, Reddy V. M. Characterization of Blended Polymer Electrolyte Thin Films Based on PVDF + PEG Doped with Nano SiO2. Orient J Chem 2022;38(4). |
| Copy the following to cite this URL: Ramana K. V, Shekar M. C, Reddy V. M. Characterization of Blended Polymer Electrolyte Thin Films Based on PVDF + PEG Doped with Nano SiO2. Orient J Chem 2022;38(4). Available from: https://bit.ly/3cveo2l |
Introduction
The wide spread usage of polymers virtually all materials to made advances in science and technology. The nature of crystallinity and thermal stability of these polymer electrolytes for applications are of current interest [1-3]. Blending of polymers is outstanding method to get require properties such as increasing thermal stability, mechanical strength and conductivity, polymers have been doped with some salts (LiClO4, NaClO4, some nano fillers) and futher these are used in electrochemical devices such as batteries, Sensors, electric vechiles; Smartphone’s and laptops . Characterization of PVDF solid polymer electrolyte mixed with LiClO4 using XRD, DSC, SEM, FTIRandUVwas reported by us[4].Some studies on polyvinylidene fluoride (PVDF and polyethylene glycol (PEG) complexation of lithium perchlotate (LiClO4) are recently reported [5].In this paper, we present the preparation and characterization of a new solid polymer electrolyte system consisting of PVDF + PEG +nano silicon dioxide (SiO2). The prepared samples are characterized using the techniques DSC, XRD, SEM, FTIR and UV. The results are compared and discussed to explain the crystalline nature, thermal stability and optical absorption of the polymer electrolyte samples PDVF+PEG + Nano SiO2.
Experimental
Solid polymer blend films based on PVDF + PEG)+ nano SiO2 have been prepared by using solution casting procedure. Pure PVDF (320000MW from Merck), PEG(6000MW from Merck) and nano SiO2 are added with various percentages i.e., (70:30), (70:30:2), (70:30:4), (70:30:6), (70:30:8), (70:30:10)by wt% ratio by Solution Casting Technique. The blend polymer electrolytes are dissolved in DMF by using ultrasonicator[6] the homogeneous solutions are obtained by stirring the solutions about 10-12 hours These solutions are allowed to get evaporated in dishes and after 48 hours, thin films are obtained. These films are separated from the dish surface and are stored in Desiccators.
XRD patterns of the above polymers are recorded using PHILIPS PW 3710. Fourier Transform Infrared (FTIR) spectroscopic studies are carried out using JASCOFTIR-5300 Spectrometer. Surface properties of these polymers are studied using Scanning Electron Microscope (SEM). Optical absorption spectra are recorded at room temperature in the range of 200-1000nm using UV Optical Spectrometer. Thermal properties are studied using Differential Scanning Calorimetry (DSC) in the temperature range 500C – 2500C.
Results and Discussion
DSC
As shown in Fig. 1, in DSC plots, there is a small endothermic dip at 174.340C, for zero concentration of nano SiO2 in PVDF + PEG [Fig 1 (A)]. As in Fig. 1(B) the endothermic peak is found at 188.40C for 2% [Fig. 1 (B). For 4%, as in Fig, 1(C),the endothermic peak is found around1870C.Increase of concentration of nano SiO2 as in Figs. 1(C) to 1(F), the endothermic peak is not prominent.
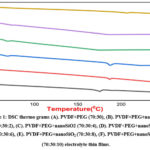 |
Figure 1: DSC thermo grams (A). PVDF+PEG (70:30), (B). PVDF+PEG+nanoSiO2 (70:30:2), (C). PVDF+PEG+nanoSiO2 (70:30:4). |
The disappearance of a small dip at higher concentrations of DSC plots indicates the decrease in the crystallinity. It is also observed in 1(D)&1(E)shifting of glass transition temperature(Tg) towards lower Temperature indicates Involved of PEG, nano SiO2 [7].
XRD
From Fig.2, it is clear that there is a sharp peak around 2θ=20.20 (110),(200) indicates β-phase PVDF[8,9,10]with small peaks18.590 (020) indicates α-Phase crystal of pvdf from the literature[8,9]which is the Characteristic Peak of Pure PVDF, present in all the concentrations of nano SiO2 in PVDF+PEG [Figs.2(A) to 2(F)] which represents a crystalline phase in the amorphous matrix of the samples. From Figs. 2(A) to 2(F), the sharp peak persists continuously where the small peaks disappear with increase of concentration. In Fig.2, it is also clear that the magnitude of crystallinity decreases with increase the concentration of nano SiO2 in PVDF+PEG. In the pure PVDF+PEG sample, the small peaks in addition to the sharp peak indicate the partial crystalline nature of the sample [Fig.2(A)].
 |
Figure 2: XRD spectra of (A). PVDF+PEG(70:30), (B). PVDF+PEG+nanoSiO2 (70:30:2), (C). PVDF+PEG+nanoSiO2(70:30:4), |
SEM
The surface morphology of PVDF+PEG and PVDF+PEG+nano SiO2 polymer systems is observed using SEM. Thus, Fig. 3 shows the surface structure of PVDF + PEG and PVDF+PEG+ nanoSiO2polymer systems with different concentrations of nano SiO2 in PVDF+PEG. From Fig.3, it is clear that the surface of PVDF+PEG film appears to be crystalline for 0% nano SiO2which is also confirmed by XRD studies on these films. As the concentration increases, the crystalline nature decreases due to disappearance of crystalline phases and increase of amorphous nature. This occurs due random positioning of molecules. For 10% concentration, the amorphous nature is more which also increases the thermal stability of the material. Fig. 3 shows the SEM pictures of PVDF + PEG membranes with increasing nano SiO2 concentration representing the decrease crystallinity from Fig. 1(A) to Fig. (F). At lower nano SiO2 concentration, nano SiO2 particles homogeneously dispersed in PVDF + PEG matrix and led to an improvement of mechanical and thermal properties.
 |
Figure 3: SEM images of (A) PVDF+PEG (70:30),(B) PVDF+PEG+nanoSiO2 (70:30:2), ( C) PVDF+PEG+nanoSiO2(70:30:4). Click here to View figure |
Fig. 4 shows strong growth in the CF2 stretching in FTIR with increasing concentratration of nano SiO2 in PVDF+PEG.In Fig.4, the intensity of the aliphatic C-H scattering irrational bands are observed in FTIR spectra of PVDF+PEG and PVDF+PEG+nano SiO2. Using these polymer blend electrolytes electrochemical cells can be fabricated and their discharge characteristics can be studied. The FTIR pattern in Fig. 4 remains almost same with minor changes in the positions and widths of the peaks with increase of the concentrationnanoSiO2 in PVDF+PEG The peaks observed at 840 and 1174 cm1 are indicates β-phase crystals, similarly the bands exist at874, 960, 1074, and 1403 cm1 indicates the α-phase crystals of the PVDF[8,9,10,11].
 |
Figure 4: FTIR spectra of of (A) PVDF+PEG (70:30),(B) PVDF+PEG+nanoSiO2 (70:30:2), |
Optical Properties
 |
Figure 5: UV absorption spectra of membranes of PVDF+PEG (70:30)with different concentrations of nano SiO2 |
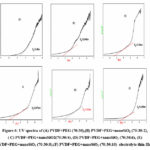 |
Figure 6: UV spectra of (A) PVDF+PEG (70:30),(B) PVDF+PEG+nanoSiO2 (70:30:2), (C) PVDF+PEG+nanoSiO2(70:30:4). |
Figure 5 shows the optical absorption spectra recorded at room temperature in the range 150 nm – 1200 nm using Optical Spectrometer. Near fundamental band edge, direct band transitions may occur[12,13].Thus, considering α as absorption coefficient, h as Planck’s constant, υ as frequency of incident light and hυ as the photon energy, (αhυ)2 versus hυ can be plotted as shown in Fig. 6. The direct band gap values of PVDF+PEG, PVDF+PEG+different concentrations of nano SiO2are tabulated in Table1.From Table 1, the band gap of pure PVDF+PEG polymer electrolyte is2.420eV. The direct optical band gap values have been modified by the addition of nano SiO2 to PVDF+PEG blend thin film which supports the conductivity levels of PVDF+PEG+nano SiO2 thin films.Thus, the direct band gap values of PVDF+PEG+ nano SiO2 polymer electrolyte indicates the influence of nano SiO2 on PVDF+PEG for better conducting properties. Table1 also shows that the direct band gap of 10% of nano SiO2 in PVDF+PEG is 3.290 eV.
Table 1: The direct band gap values of PVDF+PEG+ nano SiO2 electrolytes for different concentrations.
|
Sample code |
Wt% |
Direct band gap(eV) |
||
|
PVDF |
PEG |
Nano SiO2 salt |
||
|
(a) |
70 |
30 |
0 |
2.42 |
|
(b) |
70 |
30 |
2 |
2.846 |
|
(c) |
70 |
30 |
4 |
2.736 |
|
(d) |
70 |
30 |
6 |
2.570 |
|
(e) |
70 |
30 |
8 |
2.610 |
|
(f) |
70 |
30 |
10 |
3.290 |
Conclusions
DSC studies on nano SiO2 doped on PVDF+PEG blend films revealed that the decrease in the crystallinity which leads good thermal stability and the same also supported with XRD and SEM results. FTIR results show strong growth in the CF2 stretching with increasing concentration of nano SiO2 in PVDF+PEG and also confirmed that, intensity of the aliphatic C-H scattering vibrational bands decreases. The increase in direct band gap values of PVDF + PEG + nano SiO2 polymer electrolyte indicated that the influence of nano SiO2 on PVDF+PEG for better conducting properties.
Acknowledgement
This research work was encouraged and supported by Maturi Venkata Subba Rao Engineering College and JNTU-Hyderabad the authors are express gratitude to these organizations for the same.
Conflict of Interest
There is no conflict of interest.
Funding Sources
There is no funding Source.
References
- T. D. Kusworo, Wibowo, A. I. Budiyono, G. D. Harjanto, A. D. Yudisthira and F. B Iswanto, J. Appl. Sci. Eng. Technol. 7 (2013) 3852.
CrossRef - A. P. E. Velez, C. Torras, J. Pagan and A. Ibarz, Food Engg. Rev. 3 (2011) 136.
CrossRef - C. A. Fuenmayor, S. M. Lemma, S. Mannino, T. Mimmo and M. Scampicchio, J. Food Engg. 122 (2014) 110
CrossRef - K.Venkata Ramana, M. Chandra Shekar, A.R.Subrahmanyam, M.Ravindar Reddy and V. Madhusudhana Reddy, Int. J. Emer. Tech. Adv. Engg. 7 (2017) 484 and references therein
- K. Venkata Ramana, A.R.Subrahmanyam, B. Bhanu Prasad, M. Ravinder Reddy, V. Madhusudana Reddy and M. Chandra Shekar, Int. J. Sci. & Tech. Res. 9 (2020) 2607.
- Yixin Wu, Yu Li, Yang Wang, Qian Liu, Qingguo Chen, Minghua Chen Journalof Energy Chemistry 64 (2022) 62–8
CrossRef - Blonsky, P.M.; Shriver, D.F.; Austin, P.; Allock, H.R. Solid State Ionics. 1986, 258, 18-19
CrossRef - P. Martins, A.C. Lopes, S. Lanceros-Mendez, Electroactive phases of poly(- vinylidene fluoride): determination, processing and applications, Prog. Polym. Sci. 39 (2014) 683e706.
CrossRef - P. Xu, W. Fu, Z. Cui, Y. Ding, Enhancement of polar phase and conductivity relaxation in PIL-modified GO/PVDF composites, Appl. Phys. Lett. 112 (2018), 063904
CrossRef - P. Dhatarwal, R.J. Sengwa, Polymers compositional ratio dependent morphology, crystallinity, dielectric dispersion, structural dynamics, and electrical conductivity of PVDF/PEO blend films, Macromol. Res. 27 (2019) 1009e1023.
CrossRef - X. Cai, T. Lei, D. Sun, L. Lin, A critical analysis of the a, b and g phases in poly(vinylidene fluoride) using FTIR, RSC Adv. 7 (2017) 15382e15389.
CrossRef - D.S. Davis and T.S. Shalliday, Phys.Rev.118 (1960) 1020.
CrossRef - G.M. Thutupalli and J. Tomlin, J. Phy. D: Appl. Phy. 9 (1976) 1639.
CrossRef

This work is licensed under a Creative Commons Attribution 4.0 International License.
About The Author
![]()
A New Edition of Web of Science
Journal Impact Factor
2022: 0.5
Five Year: 0.8
Journal is Indexed in

Cabells Whitelist
![]()


