Antioxidant Activity of Ethanolic Onion Skin Extracts Produced by Microwave Assisted and Conventional Extraction Methods
Anjali Parmar* and Genitha Immanuel
Department of Processing Food and Engineering, Sam Higginbottom University of Agriculture, Technology and Sciences, Prayagraj, Uttar Pradesh, India.
Corresponding Author E-mail: aanjaliparmar.0808@gmail.com
DOI : http://dx.doi.org/10.13005/ojc/380430
Article Received on : 05 Jul 2022
Article Accepted on :
Article Published : 12 Aug 2022
Reviewed by: Dr. Raied M. Shakir Al-Sayab
Second Review by: Dr. Javed Ali
Final Approval by: Prof. Dr. Ammar A.Razzak Mahmood
This experiment focused on determination of antioxidant activity of onion skin (OS), extracted by three techniques i.e. Microwave Assisted Extraction (MAE), Soxhlet and Maceration with three different ethanol (EtOH) concentrations. Total Phenolic Content (TPC) and Total Flavonoid Content (TFC) were estimated by Folin-ciocaltteu method and Aluminium Chloride method respectively. Antioxidant activity (AOA) was assessed by Diphenyl Picryl Hydrazyl (DPPH) method and Half-maximal inhibitory concentration (IC50) value was recoded. The maximum TPC and TFC were found as 519.25 mg/g gallic acid equivalent (GAE) and 120.975 mg/g Quercetin equivalent (QE) respectively, using 90% EtOH concentration with microwave at 300W. EtOH (90%) OS extracts showed the highest free radical scavenging activity with power of 400W of 86.980% with an IC50 value of 38.516µg/ml. In all of assay, 90% EtOH OS extracts with MAE showed higher TPC, TFC and antioxidant activity, suggesting that MAE is a suitable method for extraction of antioxidant component from OS.
KEYWORDS:Antioxidant; MAE; Onion Skin; Total Flavonoid Content; Total Phenolic Content
Download this article as:| Copy the following to cite this article: Parmar A, Immanuel G. Antioxidant Activity of Ethanolic Onion Skin Extracts Produced by Microwave Assisted and Conventional Extraction Methods. Orient J Chem 2022;38(4). |
| Copy the following to cite this URL: Parmar A, Immanuel G. Antioxidant Activity of Ethanolic Onion Skin Extracts Produced by Microwave Assisted and Conventional Extraction Methods. Orient J Chem 2022;38(4). Available from: https://bit.ly/3zMtMiG |
Introduction
The interest in natural food antioxidant has increased to replace synthetic food antioxidants. Moure et al.,1 studied the identification of significant antioxidants through the removal of antioxidant chemicals from commercial trash (groundnut shell, tomato peel, lemon peel, grape seed, etc.). Manufacturers and researchers have recently become interested in using the trash out from fruit and vegetable businesses, due to its inexpensive and high amount of potent bioactive substances2. In this context, it has been shown by previous researchers that onion trash is a good source of phytonutrients and other substances that help to fend off the enzymatic reactions that lead to the oxidation of foods3.
Onion pharmacologically known as Allium cepa, is considered as a major source of dietary flavonoid around the globe4. The output of onions, the second-largest crop in the earth, has climbed by more than twenty five percent over the previous ten years and is now predicted to be between 66 and 85.7 million tons annually5. Due to increased consumption of onions, there is a spike in wastage that included undersized, deformed, sick or injured bulbs along with onion husk or shell, two lateral fleshy layers and roots produced during commercial peeling6. Onion husk extract had a higher antioxidant activity than that of flesh and garlic according to research by Nuutila et al.,7.
Antioxidants can be extracted from plants using a variety of techniques. Organic solvents (such as water, ethanol, ether, and methanol) are used in one of the most classic procedures (soxhlet, maceration, etc.) to increase effectiveness, purity of the extract, duration for extraction, and the solvent utilization. MAE is one of the most progressed extraction techniques that has the potential to play a significant part in extraction and analytical quantification of flavonoid. The aim of this study was to prepare extracts from onion skin by using MAE and conventional (soxhlet and maceration) and test their antioxidant activity and phytochemical analysis.
Materials and Methods
The experiment was conducted in Department of Processing and Food Engineering, Vaugh Institute of Agricultural Engineering and Technology, SHUATS, Prayagraj, India.
Materials
Onion skins were purchased from local vegetable vendor. Outer skins were dried in tray dryer at 50 to 60°C and pulverized in grinder. Powdered onion skins were stored in polyethylene pouches at 4°C in refrigerator.
Ethanol, Methnol, Ascorbic acid, Querctin, Gallic acid, Sodium Carbonate, Aluminium Chloride, Potassium Acetate, DPPH, Folin-ciocaltue reagent were used for various extraction and analysis purpose. All chemicals used were of analytical grade.
Extraction Procedure
Three different extraction methods were followed to prepare extracts of onion skin. Moisture content of skin was determined by hot air oven method which was 5.6% on dry basis before extraction. Three different concentration of ethanol was used to prepare extract i.e. 30%, 60%, 90%.
Microwave Assisted Extraction
Fifteen grams of powdered sample was weighed into the conical flask and 100ml of solvent was added. Then, the solution was mixed properly with stirrer. The flask was placed in the microwave and was irradiated for 5 minutes at three different microwave powers viz: 200W, 300W and 400W. After cooling, the extract was strained and dried in water bath at 50°C. The obtained residue was stored at 4°C till further use.
Soxhlet Extraction
Fifteen grams of powdered sample was placed in a thimble made with filter paper and kept in the extractor of soxhlet apparatus. Different concentration of ethanol was added for extraction for about 8 h. After cooling, the content was strained and dried in water bath at 50°C. Dried residue obtained was stored at 4°C till further use.
Maceration Extraction
Fifteen gram of powdered sample was soaked in 100 ml of solvents at room temperature for 24 h. Rough particles were removed by strainer. Then the residue was re-extracted using filter paper. The collected extract was dried in a water bath and hot air oven at 50°C. Yield of dried extract obtained by all methods were calculated by formula shown in equation 1.
Estimation of Total Phenolic Content
TPC of the extract was estimated using the Folin and Ciocalteu reagent method with minor alterations8. A spectrophotometer (Make: Microtech Venus, Model: vis002) was used to analyze the sample and standard absorbance at 765 nm against the blank solution. 0.2 ml of OS extract was taken and the volume was made up 0.8 ml with distilled water. After that 200 µl of 50% (v/v) FC reagent was added. After five minutes, 1ml of saturated 8% (w/v) Na2CO3 solution was added, followed by 3ml of distilled water. The absorbance of various samples were analyze at 765 nm. The TPC was determined as Gallic acid equivalents GAE/g of dry powdered OS using a standard Gallic acid curve (5 –500mg/ml, Y = 0.004x+0.113, R 2 =0.9991). Every determination was made in triplicate.
Estimation of Total Flavonoid Content
TFC of extract was estimated spectrophotometrically according to Aluminium Chloride method9. 0.1 ml of extract of skin was combined with 1.9 ml of methanol. 100 µl of 10% Aluminium Chloride and 100 µl of 1 Molar CH3CO2K was mixed and volume was created up to five milliliters with distilled water. The above solution was then allowed to rest at room temperature in dark and the absorbance of the solution was calculated at 415 nm. The calibration curve was then obtained using Quercetin at concentration of 12.5 to 100 mg/g in methanol. The calibration plot (Y = 0.0055x +0.1913, R2 = 0.999) was used to determine the concentration of TFC in the test samples, which was then represented as mg QE/g of dried plant material. Every determination was conducted in triplicate.
Antioxidant Activity
AOA of onion skin was evaluated byusing the DPPH method10. Four milligrams of DPPH crystals were dissolved in hundred milliliters of methanol to produce 0.1 millimolar DPPH solution. Various extract concentrations (20-200 µg/ml) were combined with three millilitre of DPPH solution. After combining, the solution was left in the dark for thirty minutes. The optical density was analyzed at 517 nm using a spectrophotometer against a blank with DPPH, excluding extract. The antioxidant activity was calculated using the formula shown in equation 2.
The quantity of antioxidant required to reduce the initial concentration by fifty percent is known as half maximum inhibitory concentration (IC50).
Statistical Analysis
Experiments were conducted in triplicate. Data were expressed as the means of these values ± the standard deviations (SD). Analysis of variance (ANOVA)- one way ANOVA was used to assess data.
Results and Discussion
Traditional techniques to extract antioxidant compounds from onion skin need a lot of energy and take a long time to react. Low yields and compound degradation are frequent effects of these circumstances. In order to increase yields while preserving the quality of the extracted materials, it is crucial to use alternative extraction methods, particularly MAE. Because water and ethanol are readily available and have been utilized extensively in the extraction of natural antioxidants, aqueous ethanol solution was selected as the extraction solvent. The results of extraction yield of onion skin extracts were shown in Table 1. The acquired results showed that the yield extract of onion skin using MAE at 400W and 30% ethanol as solvent, was higher (18.933%) than that of soxhlet and maceration (11.784 and 11.296 % respectively).
Table 1: Percent yield of onion skin extract obtained by using different methods with different concentration of ethanol (EtOH).
|
EtOH conc. |
MAEa (yield in %) |
SEb |
Mc |
||
|
200W |
300W |
400W |
60 0C |
Room temp. |
|
|
30% EtOH |
14.06±0.80 |
16.59± 0.16 |
18.93±0.66 |
11.78±0.02 |
11.16±3.87 |
|
60% EtOH |
11.29±0.63 |
14.39± 0.47 |
17.22±0.79 |
15.09±1.10 |
8.99±3.75 |
|
90% EtOH |
7.75±0.80 |
11.77± 0.35 |
14.24±1.02 |
14.41±0.35 |
5.53±2.35 |
Data were represented as the mean value ± standard deviation
a Microwave Assisted Extraction with three different power level
b Soxhlet Extraction
c Maceration Extraction
Fajri et al.,11 found that the percent yield with water, ethanol, and methanol, respectively ranged from 12.38 percent to 15.63 percent. Ethanol produced higher yield than methanol and water which showed that the compounds in onion skin extracts have a polarity close to ethanol. MAE showed the highest yield of onion skin. Ionic conduction is used in this process to transport electromagnetic energy in the form of heat which is sufficient to rupture cells and release active chemicals12.
All the extracts of onion skin were studied for their TPC displayed in Fig.1. TPC showed wide variation from 519.25 (90% EtOH at 300W) to 109 mg GAE/g (30% EtOH with maceration). Kim and Yim,13 analyzed TPC for onion skin with 60% ethanol was 581.7 mg GAE/g which is quite similar with the result obtained. Nuutila et al.,14 observed higher TPC were detected in red onion skin extract compared to the flesh and stem. MAE was used in two prior investigation by Cacciola et al., and Fernandez et al.,15,16 to prepare extracts from outer layer of chestnut which is rich in polyphenolics. Cacciola et al.,15 obtained TPC of 247.63 mg GAE/g for aqueous CSS extracts, whereas Fernandez et al.,16 acquired TPCs of 348.9-407.5 and 333.9-338.8 mg GAE/g for ethanol and aqueous extracts, respectively. While Fernandez et al., (2014) used higher pressures, Cacciola et al., (2019) used larger irradiation powers and longer extraction durations, which may have contributed to their higher TPC results. In this study TPC was higher than previous studies due to solvent type, concentration and extraction conditions. In general, green extraction methods, like MAE, which use shorter extraction times with fewer volumes of solvent at lower temperatures, pressures, and powers, produced TPCs that were superior to or comparable to those from traditional extractions.
 |
Figure 1: TPC in onion skin extracts using different methods. |
All the extracts were further examined for their total flavonoid content by spectrophotometer to analyze the existence of flavonoid and antioxidant and results were shown in Fig.2. Microwave crude extracts in 90% ethanol solvent with 300W power showed the best result 120.975 mg QE /g and maceration showed lower value 9.036 mg QE/g with 30% ethanol. In conventional extraction method soxhlet showed moderate TPC and TFC than maceration. Singh et al.,17 used various fraction of red onion peel for extraction of flavonoid, reported 1.5-165.2 mg QE/g. they showed higher TFC because of difference in solvent and concentration. The biological matrix serves as the primary extraction matrix for flavonoids, and it is well-known that the degree of analyte isolation from its matrix has a significant impact on the quality of an extract from organic matter. The analyte’s recovery and the development of efficient isolation method increase with the analyte’s concentration in a matrix18. This principle is entirely applicable to flavonoids.
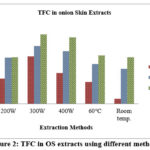 |
Figure 2: TFC in OS extracts using different methods. |
Flavonols and anthocyanins were the characteristic metabolite classes of onion skins. Quercetin, quercetin gucosides and their dimer and trimer derivatives were the most abundant bioactive compounds of onion peel19. According to Viera et al.,20 crude extracts with high TPCs and TFCs also have strong and potent antioxidant and antiradical capabilities. In this manner, DPPH assays were used to assess such activities. Regarding the DPPH experiment, the IC50 showed in Table 2, varied from 37.75 μg/ml (60% ethanol extract) to 129.91 μg/ml (30% ethanol extract). According to DPPH results, the 60% extract had the strongest antioxidant potential since the low IC50 is related to increased antioxidant potential. Among all the results 60% and 90% ethanol showed similar IC50 result with minor difference. According to Razavi and Kenari,21 DPPH radical scavenging activity was 61.11 to 84.64%, which consistent with the findings of the current investigation. It was conceivable to see that the lowest values of DPPH/IC50 for onion skin correspond to total polyphenols. This could be triggered by a number of variables, including the presence of different active substances in the skin that might alter their antioxidant capacity, experimental settings, and the mechanisms behind the techniques employed to measure the antioxidant activity. Additionally, certain chemicals have a significant response with DPPH while others react more slowly. Using Quercetin, Myricetin, and yellow onion extract, Nuutila et al.,17 assessed the linearity of the radical scavenging method and found that the response from the onion was linear. So it is proved that onion skin possess high antioxidant activity.
Table 2: IC50 value of onion skin extract obtained from DPPH.
|
EtOH conc. |
MAE (IC 50 value in µg/ml) |
SE |
M |
||
|
200W |
300W |
400W |
60 0C |
60 0C |
|
|
30% EtOH |
88.30 |
92.51 |
42.78 |
101.47 |
129.91 |
|
60% EtOH |
73.82 |
77.99 |
37.75 |
89.68 |
115.35 |
|
90% EtOH |
63.47 |
62.47 |
38.51 |
82.25 |
103.75 |
Conclusion
In the current study, the antioxidant activity of the onion peel was assessed using three different extraction techniques. Among all methods, Yield of TPC, TFC and AOA of onion skin extract decreased using the following sequence: microwave assisted extraction >soxhlet extraction >maceration. As it can be seen, microwave gave the higher yield of phytochemicals and antioxidant activity. According to recent studies, using green extraction techniques is a great option to using conventional techniques in order to lower extraction expenses, time requirements, extract quality, and human and environmental health risks.
Acknowledgement
Authors are thankful to Sam Higginbottom University of Agriculture, Technology and Sciences, Prayagraj, U.P. for help in conducting this research in their laboratory.
Conflict of Interest
There is no conflict of interest.
Funding Sources
There is no funding Source.
References
- Moure, A.; Cruz, J. M.; Franco, D.; Dominguez, J. M.; Sineiro, J.; Dominguez, H.; Núñez, M. J.; and Parajo, J. C. Food Chemistry 2001, 72(2): 145-171.
CrossRef - Kupaeva, N.V.; Kotenkova E.A. Food Syst. 2019, 2 (3), 17-19.
CrossRef - Roldán, E.; Sánchez-Moreno, C.; De Ancos, B.; and Cano M.P. Food Chemistry, 2008, 108(3): 907-916.
CrossRef - Hertog, M.G.L.; Kromhout, D.; Aravanis, C.; Blackburn, H.; Buzina, R.; Fidanza, F.; Giampaoli, S.; Jansen, A.; Menotti, A.; Nedeljkove, S.; Pekkarinen, M.; Simics, B.S.; Toshima, H.; Feskens, E.; Hollman, P.C.H.; and Katan, M.B. Archives of Internal Medicine, 1995, 155, 381-386.
CrossRef - Ren, F.; Nian, Y.; Perussello, C.A. Food Research International, 2020, 132, 108953.
CrossRef - Benitez, V.; Molla, E.; Martin-Cabrejas, M.A.; Aguilera, Y.; Lopez-Andreu, F.J.; Cools, K.; Esteban, R.M. Plant Foods Hum. Nutr. 2011, 66, 48–57.
CrossRef - Nuutila, A. M.; Kammiovirta, K.; and Oksman-caldentey, K. M. Food Chemistry, 2002, 76(4), 519-525.
CrossRef - Chandra, S.; Khan, S.; Avula, B.; Lata, H.; Yang, M.H.; ElSohly, M.A.; and Khan, I.A. Hindawi Publishing Corporation Evidence-Based Complementary and Alternative Medicine, 2014, 253875
CrossRef - Kalra S.; Midha K.; Kaur S. Indian Journal of Research in Pharmacy and Biotechnology, 2016, 4(2), 2320-3471.
- Shimada, K.; Fujikawa, K.; Yahara K.; Nakamura, T. Journal of Agri. Food Chem. 1992, 40, 945-948.
CrossRef - Fajri, F.; Montesqrit, H. Journal of Research in Agriculture and Animal Science, 2021, 8, 6, 34-39.
- Barba D.F.J.; Zhu Z.; Koubaa M.; Souza A.; Sant A.; Vibeke O. Trends Food Sci Technol. 2016, 49, 96-109.
CrossRef - Kim, K-A.; Yim, J-E. Journal of Cancer Prevention, 2015, 20, 3, 2288-3657.
CrossRef - Nuutila, A. M.; Ritta, P-P.; Aarni, M.; and Oksman-caldentey, K. M. Food Chemistry, 2003, 81, 485-489.
CrossRef - Cacciola, N. A.; Squillaci, G.; D’Apolito, M.; Petillo, O.; Veraldi, F.; La Cara, F.; Peluso, G.; Margarucci, S.; Morana, A. Molecules, 2019, 24, 3401.
CrossRef - Fernandez-Agullo, A.; Freire, M. S.; Antorrena, G.; Pereira, J. A.; Gonzalez-Alvarez, J. Sep. Sci. Technol. 2014, 49, 267−277.
CrossRef - Singh, B.N.; Singh, B.R.; Singh, R.L.; Prakash, D.; Singh, D.P.; Sarma, B.K.; Upadhyay, G.; Singh, H.B. Food and Chemical Toxicology, 2009, 47, 1161-1167
CrossRef - Wianowska, D.; Hajnos, M.; Dawidowicz, A. L.; Oniszczuk, A.; Waksmundzka-Hajnos, M.; and Gowniak, K. Journal of Liquid Chromatography and Related Technologies, 2009, 32(4), 589– 601
CrossRef - Celano, R.; Docimo, T.; Piccinalli, A. L.; Gazzerro, P.; Tucci, M.; Di Sanzo, R.; Carbetta, S.; Campone, L.; Russo, M.; and Rastrelli, L. Antioxidants, 2021, 10, 304
CrossRef - Viera, V.B.; Piovesan, N.; Rodrigues, J.B.; Mello, R. de O.; Prestes, R.C.; Santos, R.C. V dos.; Vaucher, R. de A.; Hautrive, T. P.; and Kubota, E. H. International Food Research Journal, 2017, 24(3), 990-999.
- Razavi, R.; Kenari, R.E. Iranian Food Science and Technology congress,2016, 309, 385808.

This work is licensed under a Creative Commons Attribution 4.0 International License.
About The Author
![]()
A New Edition of Web of Science
Journal Impact Factor
2022: 0.5
Five Year: 0.8
Journal is Indexed in

Cabells Whitelist
![]()


