Optically Important Transparent Syndiotactic Polystyrene/Fes Composites Grown by Low Sol-Gel Route
Jyoti Bala Kaundal, Y C Goswami* and Ranjana Sharma
Nano research lab ITM University Gwalior, Madhya Pradesh, India.
Corresponding Author E-mail: ycgoswami@gmail.com
DOI : http://dx.doi.org/10.13005/ojc/380330
Article Received on : 06 Jun 2022
Article Accepted on : 17 Jun 2022
Article Published : 28 Jun 2022
Reviewed by: Dr. Mudit
Second Review by: Dr. Reza Rasoolzadeh
Final Approval by: Dr. Umeshm Mitul
Syndiotactic Polystyrene based composites have recently shown wide applications in optoelectronic, magnetic, and memory-based devices. In the present work, we have first reported Polystyrene coated fine FeS Nanocomposites using the low-cost Sol-Gel route. These Nanocomposites were characterized for structural properties through XRD, Molecular properties through FT-IR spectroscopy, and morphology through Scanning Electron Microscope (SEM) techniques. XRD peak shows the high crystallinity in the material with the formation of FeS pyrite structure. Polystyrene (PS), which has amorphous nature, turns into crystallite composites with FeS Nanocomposites. Composites also exhibit excellent photoluminescence behavior.
KEYWORDS:Low-cost Sol-Gel route; Nanocomposites; Polystyrene; Photoluminescence
Download this article as:| Copy the following to cite this article: Kaundal J. B, Goswami Y. C, Sharma R. Optically Important Transparent Syndiotactic Polystyrene/Fes Composites Grown by Low Sol-Gel Route. Orient J Chem 2022;38(3). |
| Copy the following to cite this URL: Kaundal J. B, Goswami Y. C, Sharma R. Optically Important Transparent Syndiotactic Polystyrene/Fes Composites Grown by Low Sol-Gel Route. Orient J Chem 2022;38(3). Available from: https://bit.ly/3I0YWXd |
Introduction
Iron-based nanoparticles like iron oxide (Fe2O3), Iron Sulphide (FeS) are a new class of emerging materials. Such Materials show their significant application in superconductor, photocatalyst electric cell and also for removal of environmental pollutants due to its excellent optical-electrical properties [1-5]. The bandgap of such materials varies with tensile and compression strain in the crystals [6-8]. Recently researchers have shown great interest in reinforcing the properties of polymer nanocomposites by incorporating polymer with inorganic nanoparticles because of quantum confinement and surface effect [9]. In composites with iron-based nanoparticles, Tayyab Ali at al. reported γ-Fe2O3 nanoparticles dispersed in polystyrene polymer nanocomposite (FPSN) film through the polymerization method [10]. W. Zhong also reported the ferric oxide/polystyrene (Fe3O4/PS) nanocomposite to boost the superparamagnetic property [11]. Zhang X. J et al., and Yang T-I et al., are reported magnetic properties of oxide in polymer nanocomposites [12,13]; however, very less work is reported with FeS nanostructures which has great potential for optoelectronic, magnetic devices. FeS structures exhibits have 0.9eV indirect bandgap and 1.2 eV direct bandgap. FeS has excellent properties and is also used in lithium-ion batteries [6-7]. We have reported polystyrene/Iron sulfide nanocomposites PS/FES using the low-cost Sol-Gel method.
Experimental details
Materials
All chemicals were of analytical grade and were used as received without further purification. Ferrous chloride, Thiourea (NH2CSNH2), MEA as a complex agent, and liquid Ammonium toluene acetone and ethanol were all purchased from Aldrich. Glass vessels were cleaned by using multiple cleaning steps with acids and thoroughly washed with distilled water.
Method
The procedure is divided into the following steps.
Preparation of FeS Nanocomposites.
Synthesis of FeS/PS films.
Preparation of FeS nanoparticles using sol-gel.
0.5M molar of Fecl3 dissolved in 100 ml of distilled water and 0.5 M molar thiourea added in it, magnetically stirred for two or three hours. Then add five drops of MEA for complex formation. Three variable ratios of FeCl3 and thiourea were used for samples prepared 1:1, 1:5, and 1:8 ratios of solutions are prepared.
 |
Figure 1: Schematic diagram of synthesis process. |
Preparation of Polystyrene (PS) Solution
20g of Polystyrene were taken in the form of thermocol from packing materials. Washed it thoroughly with distilled water to remove all dust particles from it. Finally, dried at room temperature for 2to 3 hours. PS solution was prepared by using 80 ml of toluene and washed PS pieces. Polystyrene is easily dissolved in this solvent. Vigorous stirred to mix the Polystyrene in toluene, and then the solution was divided into four beakers, 20 ml each for further synthesis.
Synthesis of FeS /PS Composites films
Quartz and soda-lime glass substrates of 5cmx5cm were used to synthesize FeS /PS Composites films and dried at room temperature.
20 ml of PS solutions were taken and divided in four parts. FeS nanoparticles were added in the ratio of Add, 1:5, and 1:8 to obtain nanocomposites (Sample B1:1:1, B2: 1:5, B3: 1:8, and B4: PS only, respectively. Solutions are stirred for 15 minutes and then spread over a glass substrate and spread uniformly using the doctor blade method. Finally kept it dry at room temperature for two days. After dried, the film is etched out from the glass substrate.
Chemical equations–
FeCl3 + H2O +CH4N2S → → FeS (S) +H2 (g) +CO2 (g)+N2 (g)+3HCl (aq)
Instruments
XRD diffraction of PS and FeS/PS is carried out by XRD setup model advanced 8, in the range of 20–80° of the diffraction angle (2theta), at DAE consortium Indore. UV VIS spectra were recorded for Polystyrene, FeS/PS, and PS films in the 200-800 nm range using the UV VIS spectrophotometer Perkin Elmer Lambda25. FTIR analysis is done directly for the films and tested using ATR mode in the range of 400–4000 cm–1.
Results and Discussion
XRD( Structural studies)
Fig.2 shows the XRD patterns of FeS/PS films, and the intensity of peaks increases, as shown in the figure. A broad peak from 100to 250 shows the amorphous nature of Polystyrene. The peak at 300 shows the polystyrene nature of FeS; the sharpness of the peak increases with the increasing ratio of Polystyrene FeS Nanocomposites increased in. The peaks- 33.030, 40.910, 49.530, 57.800, 62.550 and 64.090 and corresponding planes are (200), (211), (221), (222), (023), (321) and (331) correlates with the JCPDS FILE NO- 42-13-40. These peaks indicate the formation of FeS /PS composite. The size of particles is calculated by Debye Scherer formulas using equation 1given below[14]. The particle size increased with an increasing sulfur concentration in FeS/ PS films. [15]. The William hall plots [16] show that B1 samples have a positive slope, and lateral strain exhibited by B1 and B2 has a negative slope, and it undergoes compressive strain. Due to the strain, the intensity increased, and the peaks shifted towards higher 2Ɵ values. Strain decreases as the sulfur ratio increases in Polystyrene. The size of the particles also decreases as the strain is negative in the B2 sample the length decreases.
The size of the particle varies from 32nm to 10nm.
 |
Figure 2: XRD Peaks and William halls point of (a) B1-FeS/PS (1:1), B2- FeS/PS (1:5) ,B3-FeS/PS(1:8) and B4- undoped PS. (b) WHP |
Table 1: Size of the particles by using Debye Scherer formula and strain is calculated by William Hall plot.
|
Sample |
Size(nm) |
FWHM(β) |
Intercept |
Slope( strain) |
|
B1 |
32.6 |
0.173 |
1.3781 |
1.7476 |
|
B2 |
23.3 |
0.11 |
1.62436 |
-0.98873 |
|
B3 |
10.8 |
0.082 |
1.76217 |
0.45935 |
Morphological Studies
To study the surface morphology, SEM studies were performed. SEM micrographs of polystyrene /FeS composite of various ratios of increasing FeS are shown in Fig 3. (A) B1-1:1 (B) B2- 1:5 (C) B3 1:8. Fractured morphology with pores and cracks is observed in Fib A. On increasing FeS contents, it fills in the pores, and finally, a smooth surface is observed. This is also indicated by the existence of stress as calculated by Wilkinson Hall plots. There is no separation of phase identified between PS/FeS indicating a homogeneous polymer phase [17].
 |
Figure 3: SEM micrographs of polystyrene /FeS composite of various ratios of Sulphur. (A) B1-1:1 (B) B2- 1:5 (C) B3 1:8. |
UV- Visible Spectroscopy
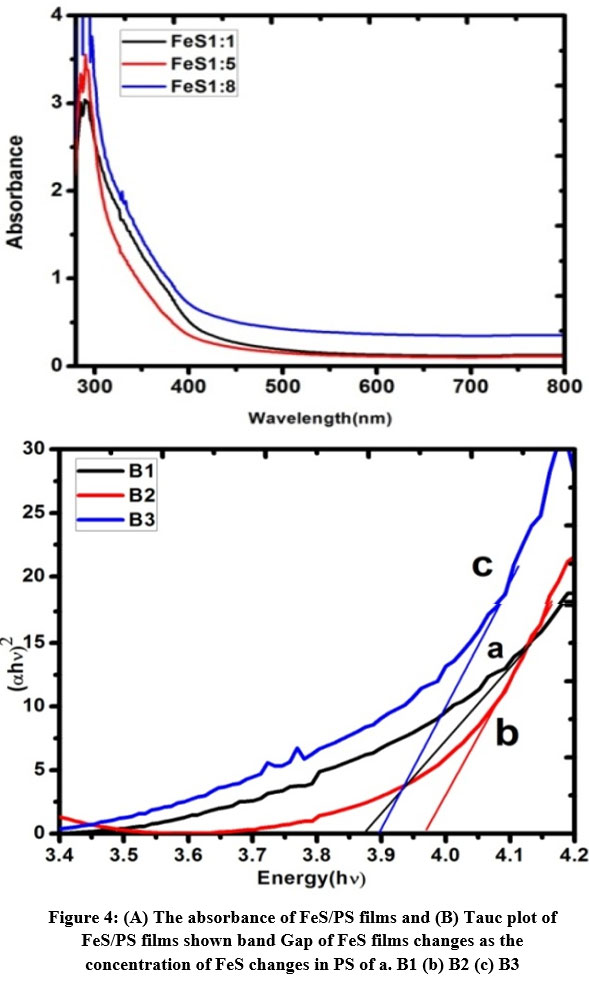
Absorbance and Tauc plot of FeS/PS films is shown in Figure 4. The absorption of FeS/Ps films increased as the ratio of sulfur increased. This shows the blue shift, in the visible region, the UV region were not absorbed by the particles. The bandgap was calculated by plotting the Graph between Energy and (α h ν) 2 [18-19] as shown in fig; the bandgap increased as the FeS ratio increased. This shows that the size of particles increased.
 |
Figure 4: (A) The absorbance of FeS/PS films and (B) Tauc plot of FeS/PS films shown band Gap of FeS films changes as the concentration of FeS changes in PS of a. B1 (b) B2 (c) B3 |
Photoluminescence (Pl)-Studies
PL spectra of PS/FeS shown in Fig5. Excellent luminescence is observed. The excited Wavelength of particles is kept at 220nm; particles have shown Broad Luminescence Peak at about 500nm in the visible region. Observation of PL peak indicates the formation of additional levels in the energy band gap region [20]. This also supports the SEM results with particle filling of pores and cracks. The electrons are trapped in these bands, and the recombination time is increased.
 |
Figure 5: PL spectra of PS/FeS Nanocomposites of different ratios. |
Conclusion
Visible luminescent and optically active Polystyrene (PS)/FeS nanocomposites are synthesized by the sol-gel route. The FeS polystyrene film was highly transparent, and best suitable for processing and fabrication because of its flexibility.
Acknowledgment
The authors are thankful to PC Ray center at ITM University, DAE Consortium Research center Indore for XRD facilities. The authors are also thankful to DRI Myanmar for SEM facilities.
Conflict of Interest
There is no conflict of interest.
Funding Sources
There is no funding source.
References
- Zhou, F. Dong, J. Liu, and K. A. Hudson-Edwards,Appl. Geochem. 80, 102 (2017).
- Y. Z. Song, W. Zhang, J. Chen, Y. T. Lu, J. Song, L. L. Zhang, J. M. Xie, and Y. Ye,Russian Journal of Physical Chemistry A, 2020, Vol. 94, No. 6, pp. 1184–1189.
- J. Liu, L. Zhou, F. Dong, and A. Karen, Chemosphere 168, 529 (2017).
- D. Li, Y. Sun, S. Chen, J. Yao, Y. Zhang, Y. Xia, and D. Yang, ACS Appl. Mater. Interfaces 10, 17175 (2018).
- M. Soori, K. Zarezadeh, S. Sheibani, and F. Rashchi, Adv. Powder Technol. 27, 557 (2016).
- Pin Xiao,1,2 Xiao-Li Fan,1,2 Li-Min Liu,and Woon-Ming Lau, Physical Chemistry Chemical Physics page 1to 19.
- X. Wei, W. Li, J. Shi, L. Gu, and Y. Yu, ACS Appl. Mater. Interfaces 7, 27804 (2015).
- D. Li, Y. Sun, S. Chen, J. Yao, Y. Zhang, Y. Xia, and D. Yang, ACS Appl. Mater. Interfaces 10, 17175 (2018).
- Pyun J.: Nanocomposite materials from functional polymers and magnetic colloids. Polymer Reviews, 47, 231–263 (2007).DOI: 10.1080/15583720701271294
- Tayyab Ali and A.Venkataraman, International Journal of Advances in Engineering & Technology, Mar. 2014 Vol. 7, Issue 1, pp. 122-126
- W. Zhong, P. Liu, H. G. Shi, D. S. Xue, eXPRESS Polymer Letters Vol.4, No.3 (2010) 183–187.
- Zhang X. J., Jiang W., Li F. S., Sun Z. D., Ou’yang Z.: Controllable preparation of magnetic polymer nanospheres with high saturation magnetization by miniemulsion polymerization. Materials Letters, 64, 119 121 (2010). DOI: 10.1016/j.matlet.2009.10.002
- Yang T-I., Brown R. N. C., Kempel L. C., Kofinas P.:Magneto-dielectric properties of polymer-Fe3O4 nanocomposites.Journal of Magnetism and Magnetic Materials, 320, 2714–2720 (2008). DOI: 10.1016/j.jmmm.2008.06.008
- B.D. Cullity & S.R. Stock, Elements of X-Ray Diffraction, 3rd Ed., Prentice-Hall Inc., 2001, p 167-171, ISBN 0-201-61091-4.
- Md Azad Alam,Sajjad Arif and Mohd. Shariq, “International Journal of Innovative Research in Advanced Engineering” (IJIRAE) ISSN: 2349-2163 Issue 6, Volume 2 (June 2015).
- A. A. SAAD Akl, M. Elhadi, Journal of Ovonic Research 16 (5), 2020, 323.
- K. Kannan, S. Agilan, N. Muthukumarasamy, K. Vijayakumar, and G Vinitha, Journal of Ovonic Research, 16 ( 6), 2020, 355 – 360.
- R Bisauriya, D Verma, YC Goswami, Journal of Materials Science: Materials in Electronics 29 (3), 1868- 1876
- YC Goswami, R Bisauriya, S Khandelwal, Journal of NanoScience, NanoEngineering & Applications 7 (2), 23-28
- R Sharma, R Singh, YC Goswami, V Kumar, D Kumar, Journal of the Australian Ceramic Society, 2021 57, 697–703 (2021).

This work is licensed under a Creative Commons Attribution 4.0 International License.
About The Author
![]()
A New Edition of Web of Science
Journal Impact Factor
2022: 0.5
Five Year: 0.8
Journal is Indexed in

Cabells Whitelist
![]()


