Liquid State Anaerobic Co-Digestion of Cattle Manure and Wheat Straw at Various Mix Ratio for Optimal Biogas Production
Guvvala Harsha and Nityanand Singh Maurya*
Civil Engineering Department, National Institute of Technology Patna, 800005, India.
Corresponding Author E-mail: nsmaurya@nitp.ac.in
DOI : http://dx.doi.org/10.13005/ojc/380332
Article Received on : 06 Apr 2022
Article Accepted on :
Article Published : 27 Jun 2022
Reviewed by: Dr. Angham G. Hadi
Second Review by: Dr.Jeenat Khan
Final Approval by: Dr. Venugopal nutulapati
Anaerobic codigestion study was performed on cattle manure (CM) and wheat straw (WS) at 5% total solids in mesophilic temperature. CM and WS were mixed on the basis of total solids in six ratios, namely, 100:0, 80:20, 60:40, 40:60, 20:80, and 0:100. The highest biogas production of 170.89 mL/g-vsadded was observed in the reactor fed with 100% CM (100:0). A considerable amount of biogas was measured up to 60:40 mix ratio (CM:WS). With the increase in proportion of WS in the mix, biogas production was decreased. Reactor stability in terms of pH and volatile fatty acids were also decreased with increase in the proportion of WS. The last three mix ratios showed low biogas production due to the less methanogenic activity caused by the low pH. Three kinetic models, namely modified gompertz model, growth and monod were employed to predict cumulative biogas production. Among these, modified gompertz was found the most suitable model.
KEYWORDS:Anaerobic Codigestion; Agriculture Residue; Biogas; Cattle Manure; Kinetic Study; Wheat Straw
Download this article as:| Copy the following to cite this article: Harsha G, Maurya N. S. Liquid State Anaerobic Co-Digestion of Cattle Manure and Wheat Straw at Various Mix Ratio for Optimal Biogas Production. Orient J Chem 2022;38(3). |
| Copy the following to cite this URL: Harsha G, Maurya N. S. Liquid State Anaerobic Co-Digestion of Cattle Manure and Wheat Straw at Various Mix Ratio for Optimal Biogas Production. Orient J Chem 2022;38(3). Available from: https://bit.ly/3NpdSzJ |
Introduction
India is an agriculture-based country, where 58% of the population lives under agriculture sector 1. The major activities of the agriculture sector are crop production and dairy farming. These activities resulting in by-production of bio-degradable materials as agriculture residue and cattle manure. In some parts of India (particularly in Haryana, Punjab, Uttar pradesh) burning of agriculture residue to eliminate the excess waste 2,3. It is causing air pollution in the neighbouring regions along with loss of valuable resource. Similarly, the cattle manure produced from dairy farms is either stored in a manure pile or burned when it gets dry. Such improper management results in emission of greenhouse gases such as carbon dioxide and methane along with other pollutants 4. This study aimed to produce valuable resources (biogas and natural fertilizer) from agriculture residue and cattle manure through anaerobic digestion.
Anaerobic digestion is a complex process of digesting organic material using microorganisms in absence of oxygen and produces the valuable products as biogas and sludge5,6. During anaerobic digestion, organic material passes through four stages of digestion process. The first stage is hydrolysis, where the polysaccharides, cellulose, hemicellulose, starch etc, get converted into carbohydrates, proteins, and lipids. Acidogenesis is the second stage, where the hydrolysed products transform into long-chain fatty acids, amino acids, and alcohols. In the third stage, acetogenesis, long-chain fatty acids are disintegrated into smaller molecules such as acetic acid and other small chain volatile fatty acids along with the hydrogen. Methanogenesis is the final stage of anaerobic digestion process, in which methanogenic bacteria convert the acetic acid, small chain volatile fatty acids and hydrogen into biogas 7,8. On the basis of total solids (TS) content of the substrate anaerobic digestion can be classified into three groups. They are liquid state (0% < TS < 10%), semi solid state (10% < TS < 15%) and solid state (TS > 15%) anaerobic digestion 9,10.
Anaerobic digestion of agriculture residues (for example wheat straw) alone may cause hindrance to the process due to the presence of relatively less biodegradable lignocellulosic and other materials 11. Literature indicates that co-digestion of agriculture residue with cattle manure may be suitable and economical options at least in rural areas of developing countries. Co-digestion of wheat straw (WS) along with cattle manure (CM) may enhance the biodegradability of lignocellulosic component of agriculture residue 12,13.
In view of the above, the present study aimed to examine the fundamental obstacles that occur in the codigestion of WS and CM. An anaerobic batch experiment was performed at 5% total solids content in mesophilic temperature. Three kinetic models, the modified Gompertz model, growth model, and Monod models were applied to predict the biogas production, lag phase, and hydrolysis rate.
Materials and Methods
Substrate and Inoculum
Wheat straw (WS) as agriculture residue and cattle manure (CM) were collected from the local dairy farms nearby the National Institute of Technology Patna. Well mixed sun dried WS was grinded using kitchen grinder, passed through 1.18 mm sieve and store in airtight container for further use. The collected CM was properly mixed and passed through 1.18 mm sieve before storage in an airtight container at 40C.
Experimental procedure
Six black colored glass bottles of 1 L volume were used as batch anaerobic digester. Each reactor was filled with 600 g of CM and WS mixture (100:0, 80:20, 60:40, 40:60, 20:80, and 100:0), on total solids (TS) basis as shown in the table 1. Required amount of distilled water was added to each reactor to achieve 5% TS in the system. The reactor with 100% WS (100:0) was also supplied with 2% CM to ensure the presence of anaerobic bacteria. All the reactors were placed in a temperature-controlled water bath at mesophilic temperature (35±0.5 0C) for a digestion period of 50 days. Biogas was collected using water displacement method. Volume of displaced water was noted down on daily basis as it is equal to the biogas production from each reactor. Contents of the reactors were manually mixed for a duration of one minute per day. The reactors were indicated as Rx, where x stands for reactor mix ratio, as shown in Table 1.
Table 1: Mix ratios of cattle manure (CM) and wheat straw (WS) and their weights.
|
Reactor |
% TS ratios of CM and WS |
TS required in grams (CM: WS) |
Weight of CM (gm) |
Weight of WS (gm) |
CM+WS (gm) |
Water to be added in mL |
|
R1 |
100: nil |
30: NIL |
190.48 |
Nil |
190.48 |
409.52 |
|
R2 |
80: 20 |
24: 6 |
152.38 |
6.60 |
158.98 |
441.02 |
|
R3 |
60: 40 |
18: 12 |
114.29 |
13.19 |
127.48 |
472.52 |
|
R4 |
40: 60 |
12: 18 |
76.19 |
19.79 |
95.98 |
504.02 |
|
R5 |
20: 80 |
6: 24 |
38.10 |
26.39 |
64.49 |
535.52 |
|
R6 |
Nil: 100 |
Nil: 30 |
Nil |
32.99 |
32.99 |
567.01 |
Analytical methods for the characterization of CM and WS
All the chemical tests were performed using the analytical grade chemicals. Moisture content (MC), total solids (TS), volatile solids (VS), pH, alkalinity, volatile fatty acids (VFA) were determined according to the testing procedures described in standard methods for water and wastewater treatment technologies 14. Moisture content (MC), total solids (TS), and volatile solids (VS) were measuring using raw samples. For measuring pH, alkalinity, and volatile fatty acids (VFA), 5 g sample was mixed in 100 mL distilled water and filtered through the 11 µm filter paper. The filtrate was analyzed to determine the pH, alkalinity, and volatile fatty acids (VFA). pH was measured using a digital pH meter. Alkalinity was determined by the titration method. VFA were measured using the distillation method followed by titration.
Determination of theoretical biogas production
Modified Buswell – Boruff equation (Equation 1) is employed to calculate the theoretical biogas production (Equation 1) 15.
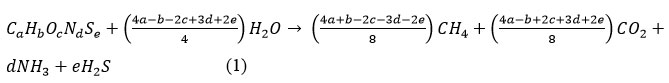
The following assumptions were made while employing the modified Buswell and Boruff equation;
The experiment was performed at a constant temperature and biogas was collected at room temperature.’
All the biomass is completely digested
The biogas is composed of methane (CH4), carbon dioxide (CO2), ammonia (NH3), and hydrogen sulfide (H2S).
Number of moles of the biogas produced is equal to the sum of number of moles of CH4, CO2, NH3, and H2S.
The quantity of biogas was calculated using above equation is in terms of mole. Thus, amount of biogas was measured in terms of mole is converted employing ideal gas equation (Equation 2).
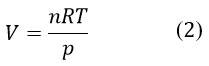
Where V is the volume of gas (L), n is the number of moles, R is the universal gas constant (0.082057 atm. L/mole. K), T is equal to 300.15 K (273.15+270C), P is equal to 1 atm, and η denotes the number of moles of gas. η can be obtained from the modified Buswell – Boruff equation. Therefore, volume of biogas production or theoretical biogas production will be; Theoretical biogas production (TBP)

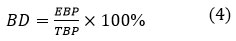
Extent of anaerobic digestion can be estimated by the amount of material degraded through the anaerobic digestion and termed as biodegradability (BD) 16. It is the ratio of experimental biogas production (EBP) and TBP, which is;
Kinetic modelling of daily biogas production
The biogas data obtained from the anaerobic digestion of CM and WS were fitted in three kinetic models, namely modified gompertz, first order exponential growth and monod models.
Modified Gompertz model (Equation 5) was used to perform the nonlinear kinetic fitting17.
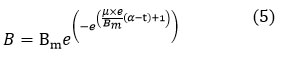
Where B is the biogas production (mL/g-VSadded) with respect to time t in days, Bm is the maximum biogas potential (mL/g-VSadded), μ is the rate of biogas production (mL/g-VSadded/day), α stands for the lag phase in days and e stands for the Euler’s constant, which is equal to 2.71828.
First-order exponential growth equation (Equation 6) and monod (Equation 7) models were also used to predict the biogas production along with the rate of hydrolysis constant 18,19.
Where Y and B is the biogas production (mL/g VSadded), Ym and F represents the maximum biogas yield (mL/g VSadded), K and K1 stands for the rate of hydrolysis ( d – 1).
Results and discussions
Characterization of substrates (CM and WS).
Characterization of substrates is an essential step to perform anaerobic digestion. It defines the stability of the digestion process and biogas production. Characteristics of CM and WS are presented in Table 2. The pH of the CM and WS were measured 6.33 and 7.04 respectively. The TS and VS contents in CM was 19.95% and 12.25%, whereas WS contains 90.95% and 83.6% TS and VS respectively. These values are in close range with the values reported in literature 20,21. The ratio of VS to TS for CW was 0.64 whereas for WS was 0.92. Thus, the reactor with more WS implies the more organic loading. The CHNS analysis were taken from the literature Table 2. The C/N ratios of CM and WS were 15.12 and 47.78, respectively. The reactor with 100% CM (R1) has a C/N ratio of 15.12, and the reactor with 100% WS is 47.78. Thus, the C/N ratio increases with increase in WS content in the mix. For the anaerobic digestion the suggested value of C/N ratio is 20 to 30 22. Only the rectors R2 and R3 have C/N ratio in the range of 20 to 30.
Table 2: Initial physicochemical characteristics of cattle manure (CM) and wheat straw (WS).
|
Parameter |
Cattle manure (CM) |
wheat straw (WS) |
|
MC% |
80.05 |
9.05 |
|
TS % of wet weight |
19.95 |
90.95 |
|
VS% of wet weight |
12.85 |
83.60 |
|
pH |
6.33 |
7.04 |
|
Alkalinity (g/kg) |
0.41 |
0.65 |
|
VFA (g/kg) |
9.28 |
– |
|
C (%) |
38.71 |
41.57 |
|
H (%) |
5.12 |
5.85 |
|
N (%) |
2.56 |
0.87 |
|
S (%) |
0.31 |
0.17 |
|
O (%) |
42.38 |
44.45 |
Note: CHNSO values of CM were extracted from 23–27, and for the WS, CHNSO values were extracted from 20,21,28–30.
Biogas production
Reactors containing mix of CM and WS in ratio 100:0, 80:20, 60:40, 40:60, 20:80, and 100:0 while maintaining 5% TS are designated as R1, R2, R3, R4, R5, , R6 and respectively. Daily and cumulative biogas production from the reactors are presented in Fig. 1 and Fig. 2 respectively. The highest daily biogas production 283 mL was observed in R1 on 13th day. The reactors R2 and R3 have produced the highest daily biogas 220 mL and 138 mL on 32nd and 30th days. The remaining reactors, R4, R5, and R6 have not produced considerable amount of biogas. As the CM content decreases or WS content increases, the highest daily biogas production also decreases . The time duration from the start of reactor to the highest daily biogas production was also decreased (Table 3). This may be due to the fact that increasing proportion of WS increases cellulose, hemicellulose, and lignin content in the mix. Literature indicated that these materials are hard to digest anaerobically 12. Further, decreasing content of CM in the reactor R4, R5 and R6 may also be responsible the less anaerobic activity. Cumulative biogas production from R1, R2, R3, R4, R5, and R6 was 170.38, 108.86, 61.96, 9.52, 6.85, and 11.87 mL/g-VSadded, respectively (Table 3). The highest cumulative biogas production of 170.38 mL/g-VSadded was reckoned from R1, and the lowest cumulative biogas production was not noticeable. Such low biogas productions were observed in a study on solid-state anaerobic digestion of WS, where WS was co-digested with dog food and canteen food waste31. A study on CM and WS co-digestion using anaerobic CM sludge measured an increase in biogas production up to 100:30 ratio of CM and WS32. The current study also measured a sharp dip in the biogas production after R3 which contains 60:40 mix ratio of CM and WS. The reactors, R4, R5, and R6, have low or zero CM content and resulted in negligible biogas production. Most of the studies have applied the pretreatment techniques along with the anaerobic bacteria in the form of inoculum for the better anaerobic digestion of WS and obtained optimum biogas production 33–36. Therefore, the reactors which contain more than 50% CM have produced a considerable amount of biogas.
 |
Figure 1: Daily biogas production from the reactors. |
 |
Figure 2: Cumulative biogas production from the reactors. |
Volatile solids reduction
Biogas production is directly proportional to the extent of volatile solids (VS) reduction 37. The relation between biogas production (mL) and VS reduction (%) is presented in Fig. 3. The highest VS reduction and biogas production of 10.73% in reactor R1, which is also corresponds to the production of highest cumulative biogas, 4092 mL. The amount of VS reduction and cumulative biogas production from all six reactors are linearly correlated with a higher value of coefficient of determination (R2) of 0.94, which is also statistically supported by the one-way ANOVA (p <0.05).
 |
Figure 3: Relation between volatile solids (VS) reduction and cumulative biogas production. |
Biodegradability
Biodegradability may also be considered as the ratio of experimental cumulative biogas production to theoretical biogas production16. Theoretical biogas production was calculated using modified Buswell equation. Similar to the VS reduction biodegradability is also decreased with increase in WS content in the reactor. Fig. 4 indicates, cumulative biogas production (mL/g-VSadded) and biodegradability and they are linearly correlated till R5. The highest cumulative biogas production and the highest biodegradability of 170.38 mL/g-VSadded and 15.37 % respectively were observed in R1, which contains 100% CM. While the lowest biogas production and the lowest biodegradability of 6.85 mL/g-VSadded and 0.64, respectively were observed in R5, which contains 20% CM and 80%WS. From the modified Buswell equation, the theoretical biogas for all the reactors lies between a close range, 1070 to 1150 mL/g-VSadded (table 3). Whereas in the case of experimental observation, the biogas production varied from 170.38 to 6.85 mL/g-VS added. This may be due to the recalcitrant part of WS (cellulose, hemicellulose, and lignin) and lack of anaerobic bacteria restricted the biogas production 12,34.
 |
Figure 4: Linear relation between biodegradability (%) and cumulative biogas production (mL/g-VSadded). |
Table 3: Experimental and theoretical biogas production and biodegradability of the reactors.
|
Reactor |
Highest daily biogas production (mL) |
Time to reach the highest daily biogas production (days) |
EBP (mL) |
EBP (mL/g-VSadded) |
TBP (mL/g-VSadded) |
BD [CBP/TBP x 100%] |
|
R1 |
283 |
13 |
4092 |
170.38 |
1108.91 |
15.37 |
|
R2 |
220 |
32 |
2692 |
108.86 |
1099.48 |
9.90 |
|
R3 |
138 |
30 |
1576 |
61.96 |
1091.18 |
5.68 |
|
R4 |
– |
– |
249 |
9.52 |
1083.80 |
0.88 |
|
R5 |
– |
– |
184 |
6.85 |
1077.21 |
0.64 |
|
R6 |
– |
– |
308 |
11.17 |
1071.28 |
1.04 |
Note: EBP-cumulative biogas production, TBP-theoretical biogas production, and BD-biodegradability.
pH, VFA, and alkalinity
pH, volatile fatty acids (VFA), and alkalinity are useful in monitoring the anaerobic digestion process. These parameters may vary during the process of anaerobic digestion38. VFA are the intermediate products of the anaerobic digestion process. pH and VFA are associated with each other and varies inversely. pH, VFA, and alkalinity of all the digestion mixtures were measured at the initial and final stages of the digestion period and the same are shown in Fig. 5The optimum pH range for anaerobic digestion is 6.5 to 7.5 38. The initial pH of the reactors was observed in the range of 6 to 7.5. The final pH of R1 and R3 was close to 5.5 and they have produced a biogas of 49 mL and 39 mL respectively, on the final day of digestion period. The reactors R4, R5 and R6 having a final pH approximately 4.5, stopped producing biogas by the end of digestion period. It may be due to the more VFA production and low buffering capacity of the mix due to less amount of CM 39. The lignocellulosic components in the WS may got hydrolyzed by the end of the digestion period and produced relatively high VFA. The alkalinity of these three reactors was also slightly lowered compared to R1, R2, and R3. Thus, the reactors which contain relatively more CM (R1, R2, and R3) have shown relatively more buffering capacity and thus able to produce a considerable amount of biogas.
 |
Figure 5: pH, Alkalinity, and Volatile fatty acids (VFA) variation among the reactors. |
Kinetic study
Cumulative biogas (mL/g-VSadded) data obtained from the experimentation was fitted using three kinetic models, namely modified gompertz model, first order-exponential growth model and monod model to investigate the appropriate model which can better describe the data. The modified Gompertz model is able to quantify the maximum biogas production, biogas production rate, and lag phase. While the remaining two models are useful in assessing the hydrolysis rate constant. Parameters obtained from the models while fitting the cumulative biogas are presented in Table 4. Results indicated that, modified Gompertz model was able to describe the experimental data very well particularly for R1, R2 and R3 reactors. However, first order and Monod models were highly over predicted against the experimental cumulative biogas. The coefficient of determination, R2 values of all the applied models were decreased with increase in WS content from R1 to R6 (Table 4). R2 values of the modified Gompertz model were in the accepted range (R2>0.9) for R1, R2 and R3 reactors. The rate of biogas production, μ of R1, R2, and R3, were 4.88, 3.42, and 2.23 mL/g-VSadded/day, respectively. The lag time, α of R1, R2, and R3 were 7.08, 15.90, and 17.06 days respectively. It indicates that, as the WS portion increases from R1 to R3, the μ values were decreased, and α values were increased. It may be due to the presence of hard recalcitrant materials of WS. A similar α value of 12.69 days was observed in the codigestion of untreated WS with animal manure from biogas plant as inoculum 40.
Table 4: Estimated kinetic parameters of modified Gompertz model, growth model, and monod model.
|
Parameter |
R1 |
R2 |
R3 |
R4 |
R5 |
R6 |
|
Experimental biogas potential (mL/g VSadded) |
170.38 |
108.86 |
61.96 |
9.52 |
6.85 |
11.17 |
|
Bm |
189.84 |
151.52 |
81.95 |
55.45 |
51.29 |
62.75 |
|
μ |
4.88 |
3.42 |
2.23 |
0.24 |
0.13 |
0.27 |
|
α |
7.08 |
15.90 |
17.06 |
3.73 |
0.00 |
0.00 |
|
R2 (modified gompertz model) |
0.99 |
0.99 |
0.99 |
0.79 |
0.82 |
0.75 |
|
Ym |
81279.60 |
588978.57 |
47836.42 |
11170.78 |
50010.57 |
70421.39 |
|
K |
4.27E-05 |
3.13E-06 |
2.31E-05 |
2.21E-05 |
3.59E-06 |
4.31E-06 |
|
R2 (growth model) |
0.99 |
0.94 |
0.92 |
0.85 |
0.85 |
0.81 |
|
F |
616135.09 |
139528.48 |
421667.02 |
32600.68 |
359201.81 |
359328.05 |
|
K1 |
6.11E-06 |
1.32E-05 |
2.62E-06 |
7.59E-06 |
5.00E-07 |
8.45E-07 |
|
R2 (monod-model) |
0.99 |
0.94 |
0.92 |
0.85 |
0.85 |
0.81 |
Conclusion
Batch experiments were performed on six different mixtures of cattle manure (CM) and wheat straw (WS) at mesophilic temperature. Results showed a decrease in biogas production with an increase in WS content. Reactor stability in terms of pH and stable VFA was observed better in R1, R2, and R3 reactors. These reactors were fed with 100:0, 80:20, and 60:40 mixture of CM and WS. Low biogas production and high VFA was observed in R4, R5, and R6 reactors, in which ratio of CM and WS were 40:60, 20:80, and 0:100 respectively. Of the three kinetic models employed in the study, the modified Gompertz model was found the best to describe the experimental data of cumulative biogas production and shown optimum fitness up to R3 reactor (i.e., for the 60:40 ratio of CM and WS). Therefore, the optimum mix ratio range of cattle manure and wheat straw for anaerobic digestion might be 20:80 and 60:40.
Acknowledgment
Authors are thankful to Department of Civil Engineering, NIT Patna for providing laboratory facilities with chemicals for conducting the present study.
Conflict of interest
There is no conflict of interest.
Funding Sources
There is no funding source.
References
- IBEF. Agriculture in India: Industry Overview, Market Size, Role in Development…| IBEF., www.ibef.org., 2019.
- Abdurrahman, M.I.; Chaki, S.; Saini G. Stubble burning: Effects on health & environment, regulations and management practices., Environ Adv., 2020,2,100011.
CrossRef - Kumar, A.; Hakkim, H.; Sinha, B.; Sinha, V. Gridded 1 km × 1 km emission inventory for paddy stubble burning emissions over north-west India constrained by measured emission factors of 77 VOCs and district-wise crop yield data., Sci Total Environ., 2021,789,148064.
CrossRef - Liu, T.; Mickley, L.J.; Singh, S.; Jain, M.; DeFries, R.S.; Marlier, M.E. Crop residue burning practices across north India inferred from household survey data: Bridging gaps in satellite observations., Atmos Environ X., 2020,8.
CrossRef - Murphy, J.D.; Thamsiriroj, T. Fundamental science and engineering of the anaerobic digestion process for biogas production., Biogas Handb Sci Prod Appl., 2013,104-130.
CrossRef - André, L.; Pauss, A.; Ribeiro, T. Solid anaerobic digestion: State-of-art, scientific and technological hurdles., Bioresour Technol., 2018,247,1027-1037.
CrossRef - Ferreira, J.A.; Agnihotri, S.; Taherzadeh, M.J. Waste biorefinery., Sustain Resour Recover Zero Waste Approaches., 2019,35-52.
CrossRef - Labatut, R.A.; Pronto, J.L. Sustainable Waste-to-Energy Technologies: Anaerobic Digestion., Sustainable Food Waste-to-Energy Systems., 2018,47-67.
CrossRef - Abbassi-Guendouz, A.; Brockmann, D.; Trably, E.; Dumas, C.; Delgenès, J.P.; Steyer, J.P.; Escudié, R. Total solids content drives high solid anaerobic digestion via mass transfer limitation., Bioresour Technol., 2012,111(3),55-61.
CrossRef - Mata-Alvarez, J.; Macé, S.; Llabrés, P. Anaerobic digestion of organic solid wastes. An overview of research achievements and perspectives., Bioresour Technol., 2000,74(1),3-16.
CrossRef - Fan, Y. Van.; Klemeš, J.J.; Perry, S.; Lee, C.T. Anaerobic digestion of lignocellulosic waste: Environmental impact and economic assessment., J Environ Manage., 2019,231,352-363.
CrossRef - Neshat, S.A.; Mohammadi, M.; Najafpour, G.D.; Lahijani, P. Anaerobic co-digestion of animal manures and lignocellulosic residues as a potent approach for sustainable biogas production., Renew Sustain Energy Rev., 2017,79,308-322.
CrossRef - Paul, S.; Dutta, A. Challenges and opportunities of lignocellulosic biomass for anaerobic digestion., Resour Conserv Recycl., 2018,130,164-174.
CrossRef - Baird, R.B.; Eaton, A.D.; Rice, E.W. Standard Methods for the Examination of Water and Waste Water., 23rd ed. American Public Health Association, American Water Works Association, and Water Environment Federation., 2017.
- Achinas, S.; Euverink, G.J.W. Theoretical analysis of biogas potential prediction from agricultural waste., Resour Technol., 2016,2(3),143-147.
CrossRef - Li, W.; Khalid, H.; Zhu, Z.; Zhang, R.; Liu, G.; Chen, Chen.; Thorin E. Methane production through anaerobic digestion: Participation and digestion characteristics of cellulose, hemicellulose and lignin., Appl Energy., 2018,226,1219-1228.
CrossRef - Blasius, J.P.; Contrera, R.C.; Maintinguer, S.I.; Alves de Castro, M.C.A. Effects of temperature, proportion and organic loading rate on the performance of anaerobic digestion of food waste., Biotechnol Reports., 2020,27,9.
CrossRef - Negi, S.; Dhar, H.; Hussain, A.; Kumar, S. Biomethanation potential for co-digestion of municipal solid waste and rice straw: A batch study., Bioresour Technol., 2018;254,139-144.
CrossRef - Koch, K.; Drewes, J.E. Alternative approach to estimate the hydrolysis rate constant of particulate material from batch data., Appl Energy., 2014,120,11-15.
CrossRef - Potdukhe, R.M.; Sahu, N.; Kapley, A.; Kumar, R. Co-digestion of waste activated sludge and agricultural straw waste for enhanced biogas production., Bioresour Technol Reports., 2021,15,100769.
CrossRef - Kumar, S.; Gandhi, P.; Yadav, M.; Paritosh, K.; Pareek, N.; Vivekanand, V. Weak alkaline treatment of wheat and pearl millet straw for enhanced biogas production and its economic analysis., Renew Energy., 2019,139,753-764.
CrossRef - Ma, G.; Ndegwa, P.; Harrison, JH.; Chen, Y. Methane yields during anaerobic co-digestion of animal manure with other feedstocks: A meta-analysis., Sci Total Environ., 2020,728(1),138224.
CrossRef - Lang, Q.; Liu, Z.; Li, Y.; Xu, J.; Li, J.; Liu, B.; Sun, Q. Combustion characteristics, kinetic and thermodynamic analyses of hydrochars derived from hydrothermal carbonization of cattle manure., J Environ Chem Eng., 2022,10(1),106938.
CrossRef - Zhang, J.; Liu, J.; Evrendilek, F.; Xie, W.; Kuo, J.; Zhang, X.; Buyukada, M. Kinetics, thermodynamics, gas evolution and empirical optimization of cattle manure combustion in air and oxy-fuel atmospheres., Appl Therm Eng., 2019,149,119-131.
CrossRef - Xin, Y.; Cao, H.; Yuan, Q.; Wang, D. Two-step gasification of cattle manure for hydrogen-rich gas production: Effect of biochar preparation temperature and gasification temperature., Waste Manag., 2017,68,618-625.
CrossRef - Marin-Batista, J.D.; Villamil, J.; Qaramaleki, S.V.; Coronella, C.J.; Mohedano, A.F.; Rubia, M.A. d. la. Energy valorization of cow manure by hydrothermal carbonization and anaerobic digestion., Renew Energy., 2020,160,623-632.
CrossRef - Bułkowska, K.; Mikucka, W.; Pokój, T.; Enhancement of biogas production from cattle manure using glycerine phase as a co-substrate in anaerobic digestion., Fuel., 2022,317,123456.
CrossRef - Romagnoli, F.; Dorella, M.; Gruduls, A.; Collotta, M.; Tomasoni, G. Anaerobic co-digestion of Baltic seaweeds with wheat straw and straw pellets: Synergetic effects on biomethane yield and kinetic biodegradability constant., In: Energy Procedia., 2019,158,854-860.
CrossRef - Kumar, P.; Kumar Nandi, B. Combustion characteristics of high ash Indian coal, wheat straw, wheat husk and their blends., Mater Sci Energy Technol., 2021,4,274-281.
CrossRef - Singhal, A.; Konttinen, J.; Joronen, T. Effect of different washing parameters on the fuel properties and elemental composition of wheat straw in water-washing pre-treatment. Part 1: Effect of washing duration and biomass size., Fuel., 2021,292,120206.
CrossRef - Jin, X.; Ai, W.; Dong, W. Lignocellulose degradation, biogas production and characteristics of the microbial community in solid-state anaerobic digestion of wheat straw waste., Life Sci Sp Res., 2022,32,1-7.
CrossRef - Song, Z.; Zhang, C. Anaerobic codigestion of pretreated wheat straw with cattle manure and analysis of the microbial community., Bioresour Technol., 2015,186,128-135.
CrossRef - Liu, L.; Zhang, T.; Wan, H.; Chen, Y.; Wang, X.; Yang, G.; Ren, G. Anaerobic co-digestion of animal manure and wheat straw for optimized biogas production by the addition of magnetite and zeolite., Energy Convers Manag., 2015,97,132-139.
CrossRef - Liu, T.; Sun, L.; Müller, B.; Schnürer, A. Importance of inoculum source and initial community structure for biogas production from agricultural substrates., Bioresour Technol., 2017,245,768-777.
CrossRef - Tian, W.; Chen, Y.; Shen, Y.; Zhong, C.; Gao, M.; Shi, D.; He, Q.; Gu, L. Effects of hydrothermal pretreatment on the mono- and co-digestion of waste activated sludge and wheat straw., Sci Total Environ., 2020,732,1-15.
CrossRef - Liu, Y.; Xiao, Q; Ye, X.; Wang, C.; Jia, Z.; Du, J.; Kong, X.; Xi, Y. Effect of different charged Fe3O4 nanoparticles on methane production for anaerobic digestion of wheat straw., J Clean Prod., 2021,328,129655.
CrossRef - Dhamodharan, K.; Kumar, V.; Kalamdhad, A.S. Effect of different livestock dungs as inoculum on food waste anaerobic digestion and its kinetics., Bioresour Technol., 2015,180,237-241.
CrossRef - Drosg, B.; Braun, R.; Bochmann, G.; Al S.T. Analysis and characterisation of biogas feedstocks., In: The Biogas Handbook: Science, Production and Applications., 2013,52-84.
CrossRef - Yang, F.; Li, W.; Sun, M.; Li, Q.; Wang, M.; Sun, Y. Improved buffering capacity and methane production by anaerobic co-digestion of corn stalk and straw depolymerization wastewater., Energies., 2018,11(7),1751.
CrossRef - Rajput, A.A.; Zeshan, V.C. Effect of thermal pretreatment on chemical composition, physical structure and biogas production kinetics of wheat straw., J Environ Manage., 2018,221,45-52.
CrossRef

This work is licensed under a Creative Commons Attribution 4.0 International License.
About The Author
![]()
A New Edition of Web of Science
Journal Impact Factor
2022: 0.5
Five Year: 0.8
Journal is Indexed in

Cabells Whitelist
![]()


