Synthesis, FTIR, NMR, Mass spectral, X-ray crystallographic and Thermal studies of Hg(II) Complex of N, N-dimethylbiguanide
Bal Krishan1* , Md. Tawkir2 and Nidhi Sharma1
1Department of Chemistry, Bahra University, Solan, Himachal Pradesh, India-173234.
2Dr. Khatri Mahavidyalaya, Tukum Chanderpur, (M.S),1ndia.
Corresponding Author E-mail: bkrishan.krg@gmail.com
DOI : http://dx.doi.org/10.13005/ojc/380225
Article Received on : 10-Mar-2022
Article Accepted on :
Article Published : 11 Apr 2022
Reviewed by: Dr. Ankit Verma
Second Review by: Dr. Neeti Rathore
Final Approval by: Dr. Abdelwahab Omri
Metal chelate of antidiabetic drug is synthesized and characterized by using various spectroscopic tools like elemental analyses, IR, NMR, mass spectra, thermal analyses (TGA) and X-ray powder diffraction techniques. The nonvariation conductometric titration method indicated the ionic nature of the complex and LM2 structure type. Complex was assigned tetrahedral geometry based on the spectral data and was found to have chemical formula [(C4H10N5)(HgCl)2] (Scheme-I). Crystallographic parameters have been calculated from powder X-ray diffraction analysis. The thermal and kinetic behaviour of the complex has been studied using Thermogravimetric analysis, which indicates that water molecules of crystallization together with anions are removed in the first step. Calculation of thermodynamic parameters has been done and their relative thermal stabilities of the complex is also discussed. Thermal stability and activation energy have been calculated by F.C and S.W methods. F.C method and TG curves have been used to determine thermodynamic specification viz. free energy change (ΔF), entropy change (ΔS).
KEYWORDS:Antidiabetic drugs; complex; spectroscopy; Therma land X-ray crystallographic
Download this article as:| Copy the following to cite this article: Krishan B, Tawkir M. D, Sharma N. Synthesis, FTIR, NMR, Mass spectral, X-ray crystallographic and Thermal studies of Hg(II) Complex of N, N-dimethylbiguanide. Orient J Chem 2022;38(2). |
| Copy the following to cite this URL: Krishan B, Tawkir M. D, Sharma N. Synthesis, FTIR, NMR, Mass spectral, X-ray crystallographic & Thermal studies of Hg(II) Complex of N, N-dimethylbiguanide. Orient J Chem 2022;38(2). Available from: https://bit.ly/3jsuCt2 |
Introduction
Metal ions play indispensable role in various biological processes and their deficiency is the root causes of many diseases 1. Well-known examples of such diseases are pernicious anemia resulting from iron deficiency. Millions of people suffer from diabetes mellitus, a progressive health complication characterized by long-lasting hyperglycaemia and disorders of carbohydrate 2-4. Zinc- insulin has been proved to be a very effective medicine in the treatment of diabetes and till date, a number of treatment methods have been developed to control the blood glucose level in diabetic patient 5-6. Insulin-enhancing properties have been markedly shown by vanadium-containing compounds and they also show anti-diabetic effects both in vivo and vitro 7-8. Discovery of oral hypoglycemic drugs which has been takes place to avoid the daily pain of hypodermic syringe. Transition metals, whose ability to form coordination compounds and chelate are of great biological importance. In past few years greater number of sulphonyl-urea complexes has been synthesized because of their high complex formation tendency. Literature report that the Sulphonyl-urea are effective for Type -2 diabetes [2-4]. Complexation of sulphonyl-urea with lighter transition metals has been studied in detail by Yoshinaga and Yamamotto 9-10. by Iqbal at. el., and other had studied the complexation of sulphonyl-urea and biguanidine 11-12. Therefore, to further explore the immense potential of metal complexes, we have synthesized metformin-mercury complex and characterized by various techniques. Mercury-metformin complex characterization and synthesis has been reported in the present paper.
 |
Scheme 1: Structure of ligand (metformin) |
Experimental
Metal-Ligand Ratio
1.565g of metformin, diluted to 200 ml. and mercuric chloride solution in same solvent was papered. They were conductometrically titrated at 30±1°C and graph was designed from the results which indicates that complex is in 2:1 ratio.
Job’s method 13 of continuous variation as modified by Turner and Anderson 14 was used for further confirmation of metal-ligand ratio (Table-1 and figure-1a & 1b) using absorbance as index property. Values of log k and -DF have been calculated.
Table 1: Job’s method as modified by Turner and Anderson
|
S. no. |
M:L Ratio |
Absorbance |
Corrected Absorbance |
||
|
0.002M |
0.005M |
0.002M |
0.005M |
||
|
1 |
0:12 |
0.009 |
0.014 |
0.00 |
0.00 |
|
2 |
1:11 |
0.022 |
0.029 |
0.013 |
0.015 |
|
3 |
2:10 |
0.033 |
0.058 |
0.024 |
0.043 |
|
4 |
3:9 |
0.053 |
0.071 |
0.041 |
0.055 |
|
5 |
4:8 |
0.052 |
0.099 |
0.040 |
0.080 |
|
6 |
5:7 |
0.088 |
0.109 |
0.073 |
0.091 |
|
7 |
6:6 |
0.113 |
0.144 |
0.100 |
0.124 |
|
8 |
7:5 |
0.127 |
0.157 |
0.111 |
0.134 |
|
9 |
8:4 |
0.159 |
0.186 |
0.141 |
0.161 |
|
10 |
9:3 |
0.105 |
0.139 |
0.085 |
0.115 |
|
11 |
10:2 |
0.085 |
0.103 |
0.064 |
0.073 |
|
12 |
11:1 |
0.041 |
0.067 |
0.019 |
0.034 |
|
13 |
12:0 |
0.029 |
0.035 |
0.00 |
0.00 |
 |
Figure 1: (a and b)- Graphs of Job’s method of continuous variation to find out M:L ratio |
Preparation
All the chemicals used in this study were of analytical grade.1.656 g. of “metformin” and 0.677 g metal salt were dissolved distinctly in 90% ethanol. Drug solution was added gradually to the metal salt with constant stirring (pH 5.5). A white coloured precipitate was obtained. The solution was reflux for 3 hours. After that the solution was cooled and filtered. The complex formed was purified by ethanol and dried and finally weighed (Yield, 60%).
Result
Physico-chemical properties of complex
Molecular formula, Mol.wt, Colour, Yield, Stability constant, Free Energy Change, of the complex [(C4H10N5)(HgCl)2], has been found to be 601.08, White, 55.63%,12.64; -17.19 respectively. Melting ponit:276oC, C,7.98(7.65), H,1.66(2.05), N,11.64(11.50), Metal,33.27(33.50), Cl,11.62(11.85).
Infra-red Spectral Studies
The Infrared spectra of prepared complex was obtained within the range 4000-400 cm-1. Spectral bands have been assigned to their corresponding groups after comparing with the data available in literature 15-20. Infrared spectra shows prominent peaks due to presence of n(Metal-Nitrogen) 500±10 cm-1, v(C-N-C) 670±10 cm-1,n(-Nitrogen-Hydrogen bond) 1426±10 cm-1, n(-N-H) 1630±10 cm-1, (amine salt) 2380±20 cm-1, n(C-H) 3020±20 cm-1,n(N-H bond) 3275±10 cm-1, n(N-H bond) 3520±10 cm-1.
1H-NMR Studies
1H-NMR spectrum was obtained on a Bruker AM-200 spectrometer by using d6-Dimethylsulphoxide. A singlet has been found to be around d=8.74 due to the presence of imide (-NH) proton of the ligand and spectral peak has been found to be less broad in complex, which confirms the loss of proton of imide -NH group through enolization. Assignment of complex as molecular formula [(C4H10N5)(HgCl)2], (molecular weight=601) δ 7.207(s, amine salt), δ6.788 (s,1H,Carbon-NH-Carbon, J=2.014 Hz ), δ2.912 (s,6H,2 methyl group J=3.134 Hz ) δ2.49(s), δ3.369(s) Residual solvent & water of solvent of the DMSO-d6 respectively. Literature also supports above spectra data for complex formation 21-22.
Mass Spectral studies
Molecular mass analysis also gives the exact mass of the complex. It gives information about the molecular assembly of coordination compounds 23-24. The assignments of complex as molecular formula [(C4H10N5)(HgCl)2],(Mol.Wt.= 601), mass over charge ratio at 601 is due to [(C4H11N5)(HgCl)2]+. or (M2L)+. Peak at 130 shows the presence of [C4H11N5]+., base peak ion having 100% relative abundance at m/z 316 due to[C3H6N2HgCl]+ ., m/z 88 due to [C3H9N3]+ fragment ion.
X-Ray Diffraction Studies
From the literature, it is found to be that X-ray crystallography confirm the prepared complex and establishment of new bonds 25-29. X-ray diffraction lines (Table-2 and fig.2) have been indexed and the unit cell parameters has been calculated. The data shows orthorhombic crystal structure and thus confirms the same structure for Hg(II)- complex. The Scherrer formula Dhkl =κλ/βhkl cosθ, has been used to calculate the particle size and found to be 6.31 micron. Porosity of the complex get calculate by formula
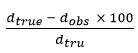
and found to be 0.171 and unit cell volume is 14025.41 is find out by Volume(abcsinb)Å where a,b and c are lattice parameters. Moreover, density of the complex has been calculated by

is found 0.04419 g/cm3 for synthesized complex. Space group for prepared complex is Pmmm and α=90°, β=90°, γ =90°.
Table 2: X-Ray measurement of complex
|
Pos. [°2Th.] |
FWHM [°2Th.] |
d-spacing [Å] |
Rel. Int. [%] |
Area [cts*°2Th.] |
|
12.7240 |
0.2175 |
6.95731 |
21.84 |
62.76 |
|
16.4612 |
0.2509 |
5.38524 |
100.00 |
331.62 |
|
17.7016 |
0.3346 |
5.01057 |
16.05 |
70.97 |
|
19.8348 |
0.2175 |
4.47624 |
2.59 |
7.46 |
|
20.8349 |
0.2007 |
4.26360 |
5.00 |
13.28 |
|
22.5976 |
0.2342 |
3.93484 |
9.06 |
28.03 |
|
24.6988 |
0.2509 |
3.60466 |
6.54 |
21.70 |
|
25.3489 |
0.3680 |
3.51367 |
5.84 |
28.41 |
|
32.5464 |
0.2676 |
2.75121 |
46.93 |
166.00 |
|
39.8827 |
0.3346 |
2.26043 |
35.12 |
155.29 |
|
50.4146 |
0.4349 |
1.81016 |
7.61 |
43.75 |
|
53.8220 |
0.5712 |
1.70192 |
5.99 |
61.17 |
 |
Figure 2: X-ray difractogram of metformin-mercurycomplex |
Thermal analysis
Metformin complex was degraded in two degradation steps with the variation of temperature from 20-6000C. The first degradation is due to loss of water molecule and second step is due to the loss of organic constituents (Table-3). The complete Thermogravimetrically analysis is shown in Figure 3.
The thermoanalytical data have been obtained by F-C and S-W method are presented in table 4 & 5. Kinetics methods reported in the literature have been used to study decomposition 30.
Freeman-Carroll 31 and Sharp-Wentworth.32 were used to find out kinetic parameter (Table-4).
The straight-line have been obtained by equation derived by F.C method, which is in the form of
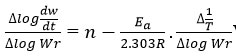
Where

rate of change of mass with time, Wr = Wc-W, Wc = Weight loss when the reaction complete, W = Total weight loss with time ‘t’, Ea = Activation energy, n = Order of reaction. Graph has been plotted by using the values of

and values of

which gives a straight line from which slope and other parameters were calculated Various thermodynamic parameter like activation energy, Gibbs free energy and entropy of the synthesized complex were evaluated by using the S.W equation.
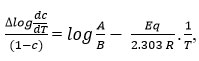
where,

Rate of change of weight loss with change of temperature. By plotting the graph between the values of

and values of 1/T
A straight line was obtained and various parameters were calculated [33-34]
Table 3: TGA data of prepared complex
|
Complex |
Decay Temperature (°C) |
Percentage Wt. loss |
Activation energy(Kj/mole) |
ΔS* (Kilo jule/mole) |
ΔF(Kilo jule/mole) |
Order of reaction(n) |
|
|
S.W. |
F.C. |
||||||
|
[(C4H10N5)(HgCl)2]. |
40-600 |
100 |
101.92 |
98.01 |
-77.80 |
-31.80 |
0.99 |
 |
Figure 3: TGA Curve of metformin-mercury complex |
Table 4: Thermogravimetric analysis of prepared complex by S-W method
|
Temp. (°C) |
°K Temp (T) |
1000 |
% Mass Loss |
Change in Wt. ‘c’ grams |
1-c |
dc |
log(dc/dt) |
log(1-c) |
log(dc/dt)/1-c |
Weight % (%) |
|
30 |
303 |
3.300330033 |
0.145 |
1.53526E-05 |
0.999984647 |
3.79845E-05 |
-4.420394158 |
-6.6676E-06 |
-4.420462023 |
99.855 |
|
50 |
323 |
3.095975232 |
0.366 |
3.87521E-05 |
0.999961248 |
6.1908E-05 |
-4.208252974 |
-1.68301E-05 |
-4.208416058 |
99.634 |
|
70 |
343 |
2.915451895 |
0.603 |
6.38456E-05 |
0.999936154 |
7.37825E-05 |
-4.132046763 |
-2.77287E-05 |
-4.132310593 |
99.397 |
|
90 |
363 |
2.754820937 |
0.727 |
7.69748E-05 |
0.999923025 |
7.58789E-05 |
-4.119878962 |
-3.3431E-05 |
-4.120196113 |
99.273 |
|
110 |
383 |
2.610966057 |
0.753 |
7.97276E-05 |
0.999920272 |
7.16119E-05 |
-4.145014573 |
-3.46267E-05 |
-4.145345072 |
99.247 |
|
130 |
403 |
2.481389578 |
0.714 |
7.55983E-05 |
0.999924402 |
7.0442E-05 |
-4.152168544 |
-3.28332E-05 |
-4.152482465 |
99.286 |
|
150 |
423 |
2.364066194 |
0.701 |
7.42219E-05 |
0.999925778 |
1.22768E-05 |
-4.910915314 |
-3.22353E-05 |
-4.911279839 |
99.299 |
|
170 |
443 |
2.257336343 |
0.151 |
1.59879E-05 |
0.999984012 |
7.5646E-05 |
-4.121214227 |
-6.9435E-06 |
-4.121280117 |
99.849 |
|
190 |
463 |
2.159827214 |
0.722 |
7.64454E-05 |
0.999923555 |
0.00024489 |
-3.611029211 |
-3.32011E-05 |
-3.611305279 |
99.278 |
|
210 |
483 |
2.070393375 |
2.349 |
0.000248712 |
0.999751288 |
0.000592139 |
-3.227576192 |
-0.000108028 |
-3.228379129 |
97.651 |
|
230 |
503 |
1.988071571 |
5.71 |
0.000604575 |
0.999395425 |
0.001025183 |
-2.989198562 |
-0.000262643 |
-2.991006849 |
94.29 |
|
250 |
523 |
1.912045889 |
9.968 |
0.001055412 |
0.998944588 |
0.001680167 |
-2.774647454 |
-0.000458602 |
-2.777578944 |
90.032 |
|
270 |
543 |
1.841620626 |
16.367 |
0.001732938 |
0.998267062 |
0.002630128 |
-2.580023112 |
-0.000753258 |
-2.584501893 |
83.633 |
|
290 |
563 |
1.776198934 |
25.659 |
0.002716775 |
0.997283225 |
0.004394131 |
-2.357126983 |
-0.001181486 |
-2.363548211 |
74.341 |
|
310 |
583 |
1.715265866 |
42.784 |
0.00452997 |
0.99547003 |
0.007219195 |
-2.141511235 |
-0.00197181 |
-2.151256362 |
57.216 |
|
330 |
603 |
1.658374793 |
70.322 |
0.007445693 |
0.992554307 |
0.008994178 |
-2.046038533 |
-0.003245722 |
-2.061386988 |
29.678 |
|
350 |
623 |
1.605136437 |
88.463 |
0.009366462 |
0.990633538 |
0.009256755 |
-2.033541236 |
-0.004086973 |
-2.052768415 |
11.537 |
|
370 |
643 |
1.555209953 |
91.85 |
0.009725078 |
0.990274922 |
0.009308811 |
-2.031105798 |
-0.004244219 |
-2.051052442 |
8.15 |
|
390 |
663 |
1.508295626 |
92.511 |
0.009795065 |
0.990204935 |
0.009337287 |
-2.029779283 |
-0.004274913 |
-2.049857772 |
7.489 |
|
410 |
683 |
1.464128843 |
92.813 |
0.00982704 |
0.99017296 |
0.009358241 |
-2.028805781 |
-0.004288938 |
-2.048940805 |
7.187 |
|
430 |
703 |
1.422475107 |
93.026 |
0.009849593 |
0.990150407 |
0.009389407 |
-2.027361852 |
-0.00429883 |
-2.047529181 |
6.974 |
|
450 |
723 |
1.383125864 |
93.331 |
0.009881886 |
0.990118114 |
0.009423156 |
-2.025803624 |
-0.004312994 |
-2.046022183 |
6.669 |
|
470 |
743 |
1.34589502 |
93.665 |
0.00991725 |
0.99008275 |
0.009456963 |
-2.024248293 |
-0.004328506 |
-2.044524353 |
6.335 |
|
490 |
763 |
1.31061599 |
94.001 |
0.009952826 |
0.990047174 |
0.009499548 |
-2.022297044 |
-0.004344111 |
-2.042626955 |
5.999 |
|
510 |
783 |
1.277139208 |
94.42 |
0.00999719 |
0.99000281 |
0.009548364 |
-2.020071021 |
-0.004363573 |
-2.040469986 |
5.58 |
|
530 |
803 |
1.245330012 |
94.902 |
0.010048224 |
0.989951776 |
-0.000502411 |
#NUM! |
-0.004385961 |
#NUM! |
5.098 |
 |
Table 5:Thermogravimetric analysis of prepared complex by F.C. method |
 |
Scheme 2: Proposed Structure (scheme-2) for |
Discussion
Scheme-I is given for synthesized complex and confirmed by analytical, spectral and other methods. Job’s method of continuous variation as modified by Turner and Anderson was conducted to confirm ligand-metal ratio which indicate the formation of complex in 1:2. Analytical data confirm the molecular formula [(C4H10N5)(HgCl)2].The proposed structure was further confirmed by spectroscopic tools viz Infrared, Nuclear Magnetic Resonance, UV-Vis and mass studies etc. The Infrared spectral specification shows that coordinate bond is formed by the replacement of Hydrogen. Moreover, Nuclear magnetic resonance studies strongly support the formation of complex. Mass spectral results and values are further supporting the coordination of mercury with nitrogen atom of the drug. X-Ray studies also confirms the complex formation and various parameters also have been find out. S.W and F-C methods have been used to determine Ea, Kinetic parameters viz. change of entropy, ΔF and order of reaction (n).
Acknowledgments
I am thankful to I.I.T Mumbai and Central Drug Research Institute, Lucknow for providing Infrared, Nuclear Magnetic Resonance spectra, mass spectra and TGA analysis.
Conflict of Interests
No conflict of interests for this article publication.
Funding Sources
There is no funding source.
References
- Michael, B. Nature, 414, 2001, 813–820.
CrossRef - Sadilot, S.M.; Pathak, R.B.J. Diabetes Asso.,1992, 32(4).
- Bloomgarden, Z.N. American Diabetes Association Consensus Statement on pharmacologic treatment, Diabetes Care, 1999, 22, S1–S114.
CrossRef - Sanger, F.; Thompson, E.O.L. The Biochem. Jour.,1951,53, 366–535.
- Karmaker, S.; Saha, T.K.; Yoshikawa, Y.; Yasui, H.; Sakurai, H. J. Inorg. Biochem.,2006, 100, 1535–1546.
CrossRef - Alice, Y.Y.; Cheng, I.; George, F. J. Can. Med. Assoc.,2005, 172, 213–226.
CrossRef - Heyliger, C.E.; Tahiliani, A.G.; McNeill, J.H. Science.,1985, 227, 1474–1477.
CrossRef - McNeill, J.H.; Yuen, V.G.;Hoveyda, H.R.; Orvig, C. J. Med. Chem.,1992, 35, 1489–1491.
CrossRef - Yoshinaga, I.; Yamamotto, Y.Endocrinologie, 1966a, 50(3).
- Yoshinaga, I.; Yamamotto,Y. J.Osaka.,1966b, 1(3).
- Iqbal, S.A.; Jose, S.; Zaafarany, I. Orient. J. Chem.,2012, 28(1), 613–618.
CrossRef - Veer , D.; Baboo,M.Orient. J. Chem.,2012, 28(4), 1797–1802.
CrossRef - Job, P. Annales de Chimie, 1928, 10, 113.
- Turner, S.E.; Anderson,R.C. J. Am. Chem. Soc.,1949, 71(3), 912–914.
CrossRef - Krishan, B.; Prakash, O. Orient. J. Chem.,2013, 29(1), 381–388.
CrossRef - Valarmathy, G.; Subbalakshmi, R.; Selvameena, R.; Gomathi, V. Orient. J. Chem.,2013,29(1), 315–320.
- Nakamotto, K. 1963, Infrared Spectra of Inorganic and Coordination Compounds, John Wiley & Sons, New York, NY, USA.
- Rao, C.N.R. 1963, Chemical Applications of Infrared Spectroscopy, Academic Press, New York, USA.
- Bellamy, L.J. The Infrared Spectra of Complex Molecules,1964, Matheun & Co., London, UK.
- Weissberger, A. 1956, Technique of Organic Chemistry: Chemical Applications of Spectroscopy, 11, Wiley-Interscience, NewYork, NY, USA.
- Slichter, C.P.1963, Principles of Magnetic Resonance: With Examples from Solid State Physics, vol. 7, Harper & Row, New York, NY, USA.
- Akit, J.W. 1973, NMR and Chemistry: An Introduction to Nuclear Magnetic Resonance Spectroscopy, Chapman and Hall, London, UK.
- Tawkir, Md.; Iqbal, S.A.; Krishan, B.; Zaafarany, I. Orient. J. Chem.,2011,27(2), 603–609.
- McLafferty, F.W.; Turecek, F. 1963.Interpretation of Mass Spectra, University Science Books, Sausalito, Calif, USA, 4th edition.
- Cullity, B.D.1978, Elements of X-Ray Diffraction, Addison-Wesley, Boston, Mass, USA, 2nd edition.
- Krishan, B.; Tawkir, M.; Iqbal, S.A. Orient. J. Chem.,2012, 28(4), 1883–1888.
CrossRef - Bragg W.L.; Bragg, W.H. 1993, The Crystalline State: A General Survey, George Bell & Sons, London, UK.
- Guiner, A.1992, X-Ray Crystallographic Technology, Hilger and Watts, London.
- Henry, N.F.M.; Lipson, H.; Wooster, W.A. The Interpretation of X-Ray Diffraction Photographs,1951, Macmillan, London, UK.
- Singru, R.N. Arc. Appl. Sci. Res.,2011, 3(5), 309–325.
- E. S. Freeman E.S.; Carroll, B.J. Phy. Chem.,1958, 62(4), 394–397.
CrossRef - Sharp, J.H.; Wentworth, S.A. Analytical Chemistry, 1969, 41(14), 2060–2062.
CrossRef - Rahangdale, S.S.; Gurnule, W.B. Chem. Sci. Trans.,2013, 2(1), 287–293
CrossRef - Duval, C. Inorganic Thermogravimetric Analysis, Elsevier, 1983, London, UK.

This work is licensed under a Creative Commons Attribution 4.0 International License.
About The Author
![]()
A New Edition of Web of Science
Journal Impact Factor
2022: 0.5
Five Year: 0.8
Journal is Indexed in

Cabells Whitelist
![]()


