Synthesis, Characterization, Cyclic Voltammetric and Biological Studies of 2-Hydroxy-2-Methyl Propiophenone Sulfaguanidine Azomethine ligand and its Mononuclear Cu(II) Complex
Ishwar Chand Balaee , Naresh Kumar Verma, Monika Jharwal, Saloni Meena and Sarita Varshney*
Department of Chemistry, University of Rajasthan, Jaipur, 302004, Rajasthan, India.
Corresponding Author E-mail: icsurela@gmail.com
DOI : http://dx.doi.org/10.13005/ojc/380212
Article Received on : 27-Dec-2021
Article Accepted on : 15-Mar-2022
Article Published : 19 Apr 2022
Reviewed by: Dr. R. P. Pawar
Second Review by: Dr. K. Sivaraj
Final Approval by: Dr. Naeem Siddiqui
A new Cu (II) complex with Schiff base ligand 2-hydroxy-2-methyl propiophenone sulfaguanidine (HMPSG) has been prepared in alcoholic medium and investigated by elemental analysis and spectroscopic methods. The ligand and its Cu (II) complex were subjected to cyclic voltammetric studies using glassy carbon electrode with variable scan rate at various pH levels. The electrochemical studies show single Irreversible reduction wave for ligand while quasi- reversible wave for its Cu (II) complex. For comparative studies, electrochemical measurements were carried out in different polarity solvents. Various kinetic variables such as charge transfer coefficient (αn), diffusion coefficient (D01/2) rate constant (K0f,h) were also determined from cyclic voltammograms measurement. Further, ligand and its Cu (II) complex were analyzed for antimicrobial studies.
KEYWORDS:Antimicrobial study; Cyclic voltammetry; Charge transfer coefficient (αn); Diffusion coefficient (Do1/2); 2-Hydroxy-2-methylpropiophenone; Rate constant (K0f,h); Sulfaguanidine
Download this article as:| Copy the following to cite this article: Balaee I. C, Verma N. K, Jharwal M, Meena S, Varshney S. Synthesis, Characterization, Cyclic Voltammetric and Biological Studies of 2-Hydroxy-2-Methyl Propiophenone Sulfaguanidine Azomethine ligand and its Mononuclear Cu(II) Complex. Orient J Chem 2022;38(2). |
| Copy the following to cite this URL: Balaee I. C, Verma N. K, Jharwal M, Meena S, Varshney S. Synthesis, Characterization, Cyclic Voltammetric and Biological Studies of 2-Hydroxy-2-Methyl Propiophenone Sulfaguanidine Azomethine ligand and its Mononuclear Cu(II) Complex. Orient J Chem 2022;38(2).Available from: https://bit.ly/3uUjqvU |
Introduction
Schiff bases are derived from condensation of a primary amine with an active carbonyl compound under acidic basic medium or with heat1-2. These are the compounds with azomethine group and studied first by Hugo Schiff in 1864. A number of curative compounds have been obtained from Schiff base reactions which are being used for medicine and pharmaceutical purposes due to their versatile biological importance such as anti-inflammatory drugs3-4 antimicrobial5-7 antispasmodic8 tuberculosis9 anticancer10, antioxidant11and anthelmintic properties12. Schiff bases are also used as catalyst, 13-14 dyes and pigments, polymer15-16 and corrosion inhibitors17-18. The Schiff base ligands played an important role in the development of coordination chemistry and were involved as essence in the improvement of bioinorganic chemistry and optical materials19. Many important sulfa drugs are known as preventive and therapeutic compounds against several bacterial infections due to –SO2NH- moiety. Schiff bases derived from sulfa drugs have been synthesized and used as ligand to prepare a potent metal complex.20-21 The cyclic voltammetric technique is important electrochemical technique which provides information regarding reduction and oxidation potential, formation of intermediates and most importantly the information concerning reversibility of electron transfer across the electrode solution interface, which helps in elucidating kinetics and mechanism of reaction taking place at the electrode. In this paper we are reporting synthesis, spectral analysis and cyclic voltammetric studies of HMPSG and its Cu (II) complex.
Experimental
Synthesis of Schiff base ligand
Analytical grade chemicals employed in present study. The Schiff base ligand HMPSG was prepared by adding a hot methanolic solution of 2-hydroxy-2-methypropiophenone to a hot methanolic solution of sulfaguanidine with fast stirring in equimolar ratio. The reaction mixture refluxed for 5-6 hours at 600C. The condensation product separated on cooling, was filtered off, washed several time and purified by repeated recrystallization from ethanol solvent, anhydrous calcium chloride was used for drying the compound (fig. 1).
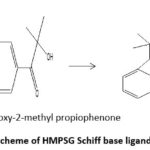 |
Figure 1: Scheme of HMPSG Schiff base ligand preparation. |
Synthesis of copper (II) complex
Copper (II) complex of HMPSG were prepared by adding a methanolic solution of (CH3COO)2Cu.H2O with vigorous stirring to HMPSG methanolic solution in ratio of 1:2. The obtained mixture was heated under reflux with stirring for 4 hours at 60OC and then allowed to evaporate into its one third volumes and cooled. The obtained deep green coloured complex was separated and washed with methanol and dried in vacuum over anhydrous calcium chloride (yield 68%).
 |
Figure 2: Copper (II) Complex of HMPSG ligand |
Results and Discussion
Micro analytical technique was used for elemental analysis on C, H, N, S, O elemental analyzer. Melting point apparatus was used for recording melting point and found 182ºC for HMPSG and 205 ºC for Cu (II) complex.
Table 1: Elemental analysis.
|
Composition of ligand/complex (M.Wt.) |
colour |
Yield (%) |
Elemental analysis(%): found(cal.) |
|||||
|
C |
H |
N |
O |
S |
Cu |
|||
|
C17H20N4O3S (360.432) |
Pale yellow |
76 |
56.58 (56.64) |
5.75 (5.59) |
15.56 (15.54) |
13.48 (13.31) |
8.60 (8.89) |
|
|
C34H38CuN8O6S2 (780.321) |
Deep green |
68 |
52.19 (52.17) |
4.90 (4.92) |
14.32 (14.31) |
12.27 (12.31) |
8.20 (8.19) |
8.14 (8.12) |
Infrared Spectral Studies
The IR studies of the prepared ligand and Cu (II) complex were obtained in the range 4000-440 cm-1. Absence of absorption bands for amino group of sulfaguanidine phenyl ring and the ketonic group of 2-hydroxy-2-methylpropiophenone in spectra of ligand are characteristic which indicate the condensation between carbonyl group and –NH2 group. A new peak at 1625 cm-1 is characteristic υ(C=N) of azomethine group confirmed above the same. A band of υ(C=N) in the region 1614-1620 cm-1 in spectra of the complexes show the shift of the band to lower wave number which indicate the coordination of ligands with metal through nitrogen atom. Absence of a broad band in the region 3300-3450 cm-1 for –OH group in complex indicates the de-protonation of OH proton before coordination. On comparing the SO2, SO2–NH, C=NH, =C-NH2 bands in the complex confirmed that they are not associate in coordination. The appearance of the new peak in the region 445-465 cm-1 and 510-560cm-1 assignable to υ(Cu-O) and υ(Cu-N) respectively consider the bonding of copper ion to O and N atoms.
Cyclic voltammetric studies of HMPSG Schiff base ligand
The cyclic voltammetric data were recorded with fully computer controlled electro analytical system, using three electrode cell assembly with glassy carbon as working electrode. The cyclic voltammograms of above introduced ligand were recorded between +800mV to -1500mV in the scan rate interval of 50-250 mV/sec, at constant pH and concentration of experimental solution. The electrochemical behavior of HMPSG was recorded in acetones, methanol and DMF solvents, using phosphate buffer and BR buffer of different pH values. The cyclic voltammetric data for ligand are summarized in table 2-5 and figure 3-6 showed the cyclic voltammograms of HMPSG in DMF-phosphate buffer, acetone phosphate buffer, methanol phosphate buffer and methanol BR buffer. The figure 3 shows the cyclic voltammograms that was recorded at pH 7.0 in DMF-phosphate buffer for HMPSG ligand. The peak potential value shifted from -950mV to -1030mV at 50-250 mVs-1 scan rates and peak current (µA) values increases from 29.40 µA to 36.30 µA with same scan rates indicating that the electrode process is irreversible. Figure 4 represent potential current curves at a scan rate 50 -250 mVs-1 in acetone -phosphate buffer at PH 5.0, 7.0, 8.2 ( fig.A, B, C respectively). The obtained cyclic voltammograms show one irreversible cathodic peak at all scan rate and at all taken pH medium. The peak potential value swept from -890mV to -975mV in aforementioned pH medium. Peak current value rises from 10.5μA to 49.5 μA with same pH. Cyclic voltammograms of 1mM HMPSG in CH3OH-phosphate buffer at PH 5.0, 7.0, 8.2 are shown in fig. 5 (A, B and C) respectively. For comparative studies of HMPSG ligand in methanol-phosphate buffer, potential was applied in the range of +700mV to -1600mV. All CV curves shows that Epc value shifted to more negative cathodic direction and Ipc value also increases with acidic to basic media at 50-250 mV/s scan rates (table 3). The figure 6 shows the current potential curves of HMPSG in CH3OH-BR buffer at 50,100,150,200 and 250 mVs-1 scan rate at PH 5.0, 7.0, 8.2.The shape of the reduction wave in all cyclic voltammograms of HMPSG shows the irreversible nature of electrode process. Thus kinetic variables such as charge transfer coefficient (αn), diffusion coefficient (D01/2) rate constant (K0f,h) have been calculated using following equations22-25 and detailed in table 2-5.
Table 2: Scan rate V/s voltammetric variables (1mM HMPSG ligand in acetone -phosphate Buffer at different pH i.e. 5, 7, 8.2) (fig. 4).
|
pH |
ν (mVs-1) |
Epc (mV) |
Ipc (µA) |
Ep/2 (mV) |
Ipc/ ν1/2 |
αn |
Do1/2 (cm2s-1) |
k°f,h (cm.s-1) |
|
5
|
50 |
-890 |
10.5 |
-790 |
1.484924 |
0.477000 |
6.766939 |
9.40E-10 |
|
100 |
-900 |
11.4 |
-792 |
1.140000 |
0.441667 |
5.398893 |
2.92E-09 |
|
|
150 |
-910 |
13.1 |
-796 |
1.069611 |
0.418421 |
5.204345 |
6.45E-09 |
|
|
200 |
-920 |
14.9 |
-820 |
1.053589 |
0.477000 |
4.801305 |
7.64E-10 |
|
|
250 |
-925 |
16.2 |
-810 |
1.024578 |
0.414783 |
5.007050 |
7.12E-09 |
|
|
7 |
50 |
-910 |
14.6 |
-800 |
2.064752 |
0.433636 |
9.868523 |
4.19E-09 |
|
100 |
-922 |
19.3 |
-824 |
1.930000 |
0.486735 |
8.706795 |
6.72E-10 |
|
|
150 |
-933 |
22.4 |
-835 |
1.828952 |
0.486735 |
8.250940 |
6.33E-10 |
|
|
200 |
-940 |
29.3 |
-847 |
2.071823 |
0.512903 |
9.105045 |
2.78E-10 |
|
|
250 |
-955 |
35.0 |
-862 |
2.213594 |
0.512903 |
9.728088 |
2.46E-10 |
|
|
8.2
|
50 |
-920 |
16.2 |
-800 |
2.291026 |
0.397500 |
11.43691 |
1.43E-08 |
|
100 |
-940 |
27.4 |
-830 |
2.740000 |
0.433636 |
13.09589 |
4.74E-09 |
|
|
150 |
-952 |
32.1 |
-850 |
2.620954 |
0.467647 |
12.06278 |
1.28E-09 |
|
|
200 |
-963 |
41.1 |
-872 |
2.906209 |
0.524176 |
12.63384 |
1.62E-10 |
|
|
250 |
-975 |
49.5 |
-884 |
3.130655 |
0.524176 |
13.60955 |
1.52E-10 |
Table 3: Scan rate V/s voltammetric variables (1mM HMPSG ligand in methanol – phosphate buffer at different pH (5, 7, 8.2) (fig.5).
|
pH |
ν (mVs-1) |
Epc (mV) |
Ipc (µA) |
Ep/2 (mV) |
Ipc/ ν1/2 |
αn |
Do1/2 (cm2s-1) |
k°f,h (cm.s-1) |
|
5
|
50 |
-900 |
11.4 |
-790 |
1.612203 |
0.433636 |
7.705559 |
3.87E-09 |
|
100 |
-915 |
15.9 |
-805 |
1.590000 |
0.433636 |
7.599438 |
4.19E-09 |
|
|
150 |
-929 |
18.5 |
-813 |
1.510519 |
0.411207 |
7.413838 |
8.67E-09 |
|
|
200 |
-940 |
23.3 |
-825 |
1.647559 |
0.414783 |
8.051519 |
8.03E-09 |
|
|
250 |
-949 |
28.5 |
-836 |
1.802498 |
0.422124 |
8.731765 |
6.48E-09 |
|
|
7 |
50 |
-920 |
18.6 |
-810 |
2.630437 |
0.433636 |
12.57223 |
4.51E-09 |
|
100 |
-940 |
25.1 |
-810 |
2.510000 |
0.366923 |
13.04168 |
4.99E-08 |
|
|
150 |
-954 |
32.1 |
-836 |
2.620954 |
0.404237 |
12.97443 |
1.31E-08 |
|
|
200 |
-973 |
36.8 |
-848 |
2.602153 |
0.3816000 |
13.25793 |
2.62E-08 |
|
|
250 |
-980 |
42.7 |
-857 |
2.700585 |
0.387805 |
13.64892 |
2.16E-08 |
|
|
8.2
|
50 |
-930 |
19.1 |
-830 |
2.701148 |
0.477000 |
12.30938 |
8.13E-10 |
|
100 |
-952 |
27.7 |
-848 |
2.770000 |
0.458654 |
12.87314 |
1.55E-09 |
|
|
150 |
-965 |
35.9 |
-865 |
2.931223 |
0.477000 |
13.35786 |
7.98E-10 |
|
|
200 |
-978 |
39.6 |
-876 |
2.800143 |
0.467647 |
12.88749 |
9.87E-10 |
|
|
250 |
-989 |
43.4 |
-884 |
2.744857 |
0.454286 |
12.81747 |
1.48E-09 |
Table 4: Scan rate V/s voltammetric variables (1mM HMPSG ligand in methanol – BR Buffer at different pH (5, 7, 8.2)(fig.6).
|
pH |
ν (mVs-1) |
Epc (mV) |
Ipc (µA) |
Ep/2 (mV) |
Ipc/ν1/2 |
αn |
Do1/2 (cm2s-1) |
k°f,h (cm.s-1) |
|
5
|
50 |
-942 |
20.4 |
-835 |
2.884996 |
0.445794 |
13.59957 |
2.18E-09 |
|
100 |
-956 |
25.4 |
-850 |
2.540000 |
0.45000 |
11.91721 |
1.82E-09 |
|
|
150 |
-967 |
31.3 |
-870 |
2.555634 |
0.491753 |
11.47024 |
3.85E-10 |
|
|
200 |
-974 |
33.9 |
-872 |
2.397092 |
0.467647 |
11.03247 |
9.09E-10 |
|
|
250 |
-983 |
34.5 |
-879 |
2.181972 |
0.458654 |
10.14037 |
1.11E-09 |
|
|
7 |
50 |
-950 |
29.4 |
-843 |
4.157788 |
0.445794 |
19.59937 |
2.74E-09 |
|
100 |
-965 |
31.3 |
-860 |
3.130000 |
0.454286 |
14.61595 |
1.63E-09 |
|
|
150 |
-978 |
34.3 |
-882 |
2.800583 |
0.496875 |
12.50467 |
2.81E-10 |
|
|
200 |
-985 |
36.3 |
-888 |
2.566798 |
0.491753 |
11.52034 |
3.16E-10 |
|
|
250 |
-998 |
37.2 |
-902 |
2.352735 |
0.496875 |
10.50501 |
2.07E-10 |
|
|
8.2
|
50 |
-964 |
35.2 |
-869 |
4.978032 |
0.502105 |
22.11095 |
3.11E-10 |
|
100 |
-982 |
43.1 |
-875 |
4.310000 |
0.445794 |
20.31689 |
2.30E-09 |
|
|
150 |
-997 |
41.3 |
-880 |
3.372131 |
0.407692 |
16.62208 |
7.47E-09 |
|
|
200 |
-1012 |
44.4 |
-916 |
3.139554 |
0.496875 |
14.01818 |
1.88E-10 |
|
|
250 |
-1020 |
46.3 |
-935 |
2.928269 |
0.561176 |
12.30293 |
1.31E-11 |
Table 5: Scan rate V/S voltammetric variables (1mM 2-hydroxy-2methyl propiophenone in various solvents like acetone, methanol DMF in phosphate Buffer at pH 7.
|
solvent |
ν (mVs-1) |
Epc (mV) |
Ipc (µA) |
Ep/2 (mV) |
Ipc/ ν1/2 |
αn |
Do1/2 (cm2s-1) |
k°f,h (cm.s-1) |
|
Acetone
|
50 |
-910 |
14.6 |
-800 |
2.064752 |
0.433636 |
9.868523 |
4.19E-09 |
|
100 |
-922 |
19.3 |
-824 |
1.930000 |
0.486735 |
8.706795 |
6.72E-10 |
|
|
150 |
-933 |
22.4 |
-835 |
1.828952 |
0.486735 |
8.250940 |
6.33E-10 |
|
|
200 |
-940 |
29.3 |
-847 |
2.071823 |
0.512903 |
9.105045 |
2.78E-10 |
|
|
250 |
-955 |
35 |
-862 |
2.213594 |
0.512903 |
9.728088 |
2.46E-10 |
|
|
Methanol |
50 |
-920 |
18.6 |
-810 |
2.630437 |
0.433636 |
12.57223 |
4.51E-09 |
|
100 |
-940 |
25.1 |
-810 |
2.510000 |
0.366923 |
13.04168 |
4.99E-08 |
|
|
150 |
-954 |
32.1 |
-836 |
2.620954 |
0.404237 |
12.97443 |
1.31E-08 |
|
|
200 |
-973 |
36.8 |
-848 |
2.602153 |
0.381600 |
13.25793 |
2.62E-08 |
|
|
250 |
-980 |
42.7 |
-857 |
2.700585 |
0.387805 |
13.64892 |
2.16E-08 |
|
|
DMF
|
50 |
-950 |
29.40 |
-843 |
4.157700 |
0.445700 |
39.20290 |
4.36E-09 |
|
100 |
-973 |
31.3 |
-860 |
3.130000 |
0.422124 |
15.16253 |
4.80E-09 |
|
|
150 |
-994 |
34.3 |
-882 |
2.800583 |
0.425893 |
13.50658 |
3.22E-09 |
|
|
200 |
-1020 |
37.60 |
-890 |
2.658700 |
0.454200 |
24.83280 |
1.48E-09 |
|
|
250 |
-1030 |
36.30 |
-918 |
2.295800 |
0.425800 |
22.14680 |
3.75E-09 |
 |
Figure 3: Cyclic voltammograms of 1mM HMPSG in DMF–phosphate buffer at 7.0 pH |
 |
Figure 4: Cyclic voltammograms of 1mM HMPSG in acetone -phosphate buffer at PH 5.0, 7.0 ,8.2 showed in fig. A, B and C respectively |
 |
Figure 5: Cyclic voltammograms of 1mM HMPSG in CH3OH-phosphate buffer PH 5.0, 7.0, 8.2 showed in fig. A, B and C respectively |
 |
Figure 6: Cyclic voltammograms of 1mM HMPSG in CH3OH-BR buffer at PH 5.0, 7.0, 8.2 showed in fig. A, B and C respectively |
Effect of change of scan rate
The impact of scan rate upon reduction of ligand was investigated from the analysis of cyclic voltammograms. The investigation was obtained by changing the scan rates from 50, 100, 150, 200 and 250 mV/s. The cathodic peak potential shifted to more negative value with increasing scan rate which indicates irreversibility of electrochemical process. The linear relationship between cathodic peak potential (Epc) with ln ν confirmed the irreversibility of the reduction process (fig. 7, 8 and 9). In all the cyclic voltammograms the current function (Ipc/ ν1/2) has been found to be fairly constant with respect to scan rate (Fig. 10) showing that the electrode process is diffusion controlled26-27.
 |
Figure 7: Reduction potential V/S In ν for 1mM HMPSG in acetone – phosphate buffer |
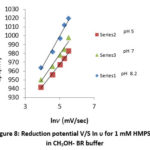 |
Figure 8: Reduction potential V/S In υ for 1 mM HMPSG in CH3OH- BR buffer. |
 |
Figure 9: Reduction potential V/S In ν for 1 mM HMPSG in different solvents in phosphate Buffer at pH 7. |
 |
Figure 10: Ipc vs ν 1/2 for 1mM HMPSG in methanol -phosphate buffer at pH 7 |
Effect of solvent
The electrochemical behavior is affected by nature of solvent. Comparative studies have been done to analyze the electrochemical parameters of ligand. Cyclic voltammograms of HMPSG were recorded in various solvent like acetone, CH3OH and DMF with phosphate Buffer at pH 7. It showed that the negative peak potential value is maximum in DMF solvent and minimum in acetone solvent. [table 5]. This trend is similar to the trend in viscosity, dielectric constant and polarity of this solvents28-29.
Effect of pH
The pH effect on electrochemical behaviour of ligand was also investigated in the pH range (5, 7 and 8.2) of experimental solution. The peak potential value of ligand is found to be changed with the pH value of the solution and shifting towards more negative value was observed for higher pH. This indicates participation of proton during electrode process. The reduction is easier at low pH in comparison of higher pH. It confirmed the formation of easily reducible protonated intermediate during the reduction (table 1, 2, 3).
Effect of buffer
To observe the effect of buffer medium electrochemical behavior of HMPSG ligand were recorded in phosphate buffer and Britton-Robinson buffer (BR) with methanol solvent at 50-250 mV/s sweep rate and at different pH (5, 7, 8.2) (fig. 6). These cyclic voltammograms show that cathodic peak potential swepts towards high negative value in BR buffer solution compared to phosphate buffer solution at same scan rate and pH values indicates that the polarity of buffer solution affected electrochemical behaviour of redox species. The reduction potential value in methanol – phosphate buffer is reported to vary from -900mV to -989 mV at 50 to 250 mVs-1 scan rates at different pH. While in methanol – BR buffer, Epc values varies from -942mV to 1020 mV at 50-250mVs-1, suggesting that reduction process is more convenience in high polarity phosphate buffer solution.30
Cyclic voltammetric studies of Copper (II) complex of HMPSG
The electrochemical behaviour of Cu(II) complex has been investigated by cyclic voltammetric technique in DMF solvent containing NaClO4 as supporting electrolyte with different scan rates varying from 100 to 300 mVs-1. The cyclic voltammograms show the negative potential of complex ranging from -0.51V to -0.54V, and in reverse scan a corresponding anodic wave occurs in the range of -0.18V to-0.17V and the peak separation (Dep) varies from 0.326V to 0.377 V. The ligand does not show cathodic and anodic potential as in the above range, so the redox process is assigned to the copper centre only. The CV of complex shows a quasi-reversible peak corresponding to the formation of Cu (II)/Cu (I) couple at given potential. The peak separation (Dep) varying from 0.326V to 0.377 V and the ratio between the anodic and cathodic peak current is less than unity (IPa/IPc<1) corresponding to a simple one electron transfer process31-33. A linear dependence between cathodic peak current (IPc) and the square of the scan rates (υ 1/2) have been also observed (Fig.12).This fact implies that these electrochemical process are mainly diffusion controlled.
Table 6: Effect of scan rate on voltammetric variables of 1 mM Cu(II) Complex of HMPSG in DMF- NaClO4 solvent (Fig. 11).
|
ν |
Epc |
Ep,a |
ΔEp |
E1/2 |
Ip,c |
Ip,a |
Ip,a/Ip,c |
Ip,c/ ν1/2 |
|
mVs-1 |
(mV) |
(mV) |
(mV) |
(mV) |
(µA) |
(µA) |
||
|
100 |
-515 |
-189 |
326 |
-442 |
25.9 |
15.2 |
0.586873 |
2.59 |
|
150 |
-520 |
-185 |
335 |
-448 |
31.8 |
17.8 |
0.559748 |
2.596459 |
|
200 |
-532 |
-182 |
350 |
-454 |
35.8 |
18.1 |
0.505587 |
2.531442 |
|
250 |
-540 |
-175 |
365 |
-460 |
41.9 |
24.9 |
0.594272 |
2.649989 |
|
300 |
-547 |
-170 |
377 |
-467 |
46.7 |
25.6 |
0.54818 |
2.696226 |
 |
Figure 11: Collective scan on the voltammograms of 1mM Cu (II) complex of HMPSG in DMF-NaClO4 |
 |
Figure 12: Ipc V/S ν1/2 for 1 mM Cu (II) complex of HMPSG. |
Biological studies of HMPSG ligand and its Cu (II) complex
The synthesized ligand and its Cu (II) complex have been subjected to antimicrobial analysis. Gram positive (staphylococcus Aureus) and gram negative bacteria (Escherichia coli) and fungi Aspergillus Niger, Candida Albicans were selected to study the antimicrobial activity. Ciprofloxacin and Ketoconazole were used as the standard for bacterial and fungal studies respectively. Well Diffusion Method is used. The results are incorporated in tables 7&8. The microbial activity of compound was determined on the basis of inhibited zone size around each well. The results reveal that there is considerable increase in toxicity of the complex as compared to the ligand. Complex is found to be more active against all organisms used than the ligand. It can be explained by Tweedy’s Chelation Theory.34-36
Table 7: Antibacterial studies of schiff base ligand HMPSG and its Cu (II) complex.
|
Staphylococcus aureus |
Escherichia coli |
|||||||
|
Anti-bacterial |
HMPSG |
Cu(II) complex |
HMPSG |
Cu(II) complex |
||||
|
Stock Conc. µg/ml |
Zone of Inhibition (mm) |
Activity index |
Zone of Inhibition (mm) |
Activity index |
Zone of Inhibition (mm) |
Activity index |
Zone of Inhibition (mm) |
Activity index |
|
20 |
13 |
0.541 |
14 |
0.583 |
14 |
0.583 |
14 |
0.583 |
|
30 |
14 |
0.583 |
15 |
0.625 |
16 |
0.666 |
17 |
0.708 |
|
40 |
15 |
0.625 |
16 |
0.666 |
21 |
0.875 |
20 |
0.833 |
|
50 |
19 |
0.791 |
20 |
0.833 |
22 |
0.916 |
24 |
1.000 |
|
60 |
21 |
0.875 |
22 |
0.916 |
26 |
1.083 |
28 |
1.166 |
Table 8: Antifungal studies of Schiff base ligand HMPSG and its Cu (II) complex
|
Aspergillus Niger |
Candida Albicans |
|||||||
|
Anti-fungal |
HMPSG |
Cu(II) complex |
HMPSG |
Cu(II) complex |
||||
|
Stock Conc. µg/ml |
Zone of Inhibition (mm) |
Activity index |
Zone of Inhibition (mm) |
Activity index |
Zone of Inhibition (mm) |
Activity index |
Zone of Inhibition (mm) |
Activity index |
|
20 |
10 |
0.666 |
10 |
0.666 |
11 |
0.733 |
12 |
0.800 |
|
30 |
12 |
0.800 |
13 |
0.866 |
13 |
0.866 |
14 |
0.933 |
|
40 |
13 |
0.866 |
14 |
0.933 |
14 |
0.933 |
16 |
1.066 |
|
50 |
15 |
1.000 |
17 |
1.133 |
17 |
1.133 |
18 |
1.200 |
|
60 |
17 |
1.133 |
19 |
1.266 |
20 |
1.333 |
23 |
1.533 |
Conclusion
In this research paper, the complex of Cu(II) with schiff base ligand prepared from 2-hydroxy-2-methyl propiophenone and sulfaguanidine was synthesized and characterized by spectral techniques. Cyclic voltammetric studies of the ligand confirmed that the electrochemical behaviour of HMPSG ligand is irreversible and diffusion controlled under the various pH scale and sweep rate range from 50 mV/s to 250mV/s. It was found that the value of reduction potential depends on scan rate, pH of experimental solution and different buffer medium. The Epc and Ep1/2 swept to more cathodic value with increasing pH and scan rate. The cyclic voltammograms of Cu (II) complex displayed a quasireversible one electron transfer redox process. The antimicrobial effects of prepared compounds were investigated on different type’s bacteria and fungi.
Acknowledgment
Authors express their sincere thanks to the Department of Chemistry, University of Rajasthan, Jaipur for providing research facilities. The authors Naresh Kumar Verma, Monika Jharwal are thankful to CSIR, New Delhi and Saloni Meena is thankful to UGC, New Delhi for financial assistance.
Conflict of interest
There is no conflict of interest.
Funding Sources
There is no funding sources.
References
- Abu-Khadra, A. ; Farag, R.; Abdel-Hady, A. Am. J. Analyt. Chem. 2016, 7, 233-245.
CrossRef - Rauf, A.; Shah, A.; Khan, A. A.; Shah, A. H.; Abbasi, R.; Qureshi, I. Z.; Ali, S. Spectrochim.Acta, Part A. 2017, 176, 155-167.
CrossRef - Shukla, S.; Mishra, A.P. Arab.J.Chem. 2019, 12(7), 1715-1721.
CrossRef - Murtaza,S.;Akhtar.M.S.;Kanwal, F.;Abbas,A.; Ashiq, A.; Shamim, S. j. Saudi Chem. Soc. 2017,21,S359-S372.
CrossRef - Anacona, J.; Pineda, Y.; Bravo, A.; Camus, J. Med. Chem. (Los Angeles) 2016, 6, 467-4736.
CrossRef - Hossain ,B.D.; Camellia,M.K.; Ud din,N.; Zahan ,K.; Banu,L.A.; Haque,M. Asian J. Chem. Sci. 2019, 6(1), 1-8.
CrossRef - Charles, A.; Sivaraj, K. Res. J. Life Sci.bioinform.pharm.chem.sci.2019, 5(2), 984.
- Chaubey, A. K.; Pandeya, S.N. Int. J. Pharmtech Res. 2012, 4, 590-598.
- Cordelia, U.; Dueke,E., Tolulope, M.; Fasinaa , A.E.; Oluwalanaa , O. B.; Familoni,A .; Jack, M.; Mphalele, B.; Onubuoguca,C. Sci .Afr. 2020,9, e00522.
CrossRef - Tadele, K.T.; Tsega, T.W. Anti-Cancer Agents Med. Chem. 2019, 19(15), 217-219.
CrossRef - Kalaiarasi, G.; Dharani, S.; Puschmann, H.; Prabhakaran, R. Inorg. Chem. Commun. 2018, 97, 34-38.
CrossRef - Maddireddy, M.; Kulkarni, A.D.; Bagihalli, G.B.; Malladi, S. Helv.Chim.Acta. 2016, 99, 562–572.
CrossRef - Adam, M.S.S.; Al‑Omair,M.A.; Ullah,F. Res. Chem. Intermed. 2019, 45 ,4653–4675.
CrossRef - Adam, M.S.S.; El-Hady,O.M.; Ullah,F. R.Soc.Chem.2019, 9, 34311.
CrossRef - González,D.M.; Cisterna,J.; Brito,I.; Roisnel,T.; Jean-Hamon, J.; Manzur, C. Polyhedron 2019,162,91-99.
CrossRef - JieLai,F.;LingChiu,L.;LingLee,L.;YiLu,W.;Yi-ChunLai;ShangwuDing;YingChen,H.;Kuo-Hui,W. Polymer 2019,182,121812.
CrossRef - Hassan,M.A.; Heakal, B.H.; Younis, A.; Bedair, M.A.; Elbialy, Z. I.; Abdelsalam, M.M. Egypt. J .Chem. 2019, 62(9), 1603 – 1624.
- Das,M.; Biswas, A.; Kund, B.K.; Charmier, M.AJ.; Mukherjee, A .; Mobin, S.M.; Udayabhanu, G.; Mukhopadhyay, S. Chem.Eng. J. 2019, 357, 447-457.
CrossRef - Arroudj, S.; Bouchouit, M.; Bouchouit, K.; Bouraiou, A.; Messaadia,L.; Kulyk,B.; Figa,V.; Bouacida,S.; Sofiani, Z.; Taboukhat,S. Opt. Mater. 2016, 56, 116-120.
CrossRef - Mondal, S .; Mandal, S.M.; Mondal,T.K.; Sinha, C. J. Mol. Struct. 2017, 1127, 557-567.
CrossRef - Rani, S.; Sumrra, S.H.; Chohan, Z.H. Russ. J. Gen. Chem. 2017, 87(8), 1834-1842.
CrossRef - Sharma, P.; Kumar, A.; Sharma, M. Indian J. Chem. 2006, 45A, 872.
- Bard, A.J.; Faulkner, L.R.; leddy, J.; Zoski, C.G. Wiley New York.1980,2.
- Meena,L.; Choudhary,P.; Varshney A.K.; Varshney,S.Port. Electrochim. Acta. 2019, 37, 271-283.
CrossRef - Noel, M.; Vasu, K.I. Aspect Publication,London.1990.
- Abdallah, M.; Alharbi ,A.; Morad, M.; Hameed, A.M.; Al-Juaid, S.S.; Foad, N.; Mabrouk ,E.M. Int. J. Electrochem. Sci.2020,15, 6522 – 6548.
- Aoki, K.J.; Taniguchi, S.; Chen, J. J.Am.Chem.Soc.2020, 5, 29447-29452.
CrossRef - Kumawat ,G.L. ;Choudhary, P.; Varshney, A.; Varshney, S. Orient.J.Chem. 2019, 35(3),1117-1124.
CrossRef - Davood, A.; Yoonesi, B.; Soleymanpour, A. Int. J. Electrochem. Sci.2010, 5, 459 – 477.
- Choudhary, P.; Kumawat, G.L.; Sharma R.; Varshney, S. Int. J. Pharm. Sci. & Res. 2018, 9(11), 4601-09.
- Andrew, F.P.; Ajibade, P.A. Int. J. Electrochem. Sci., 2021, 16, 150950.
CrossRef - Shaju, K. S.; Joby, T. K.; Raphael, V.P.; NimmyKuriakose,S.J.Appl.Chem. 2014,7(10), 64-68.
- Losada, J.; Del Peso, I.; Beyer, L.; Inorg. Chim. Acta. 2001, 321,107-115.
CrossRef - Dharmaraj, N.; Viswanathamurthi, P.; Natarajan, K. Transition Met. Chem. 2001, 26; 105-109.
CrossRef - Hassan, F.S.M.; .Mahmoud Fayez ,M.; Abdalla, N. Open J. Inorg. Non met. Mater. 2020, 10, 15-29.
CrossRef - Wanale, S.G.; Pachling, S.P. Res. J. Pharm. Biol. Chem. Sci. 2012, 3( 2), 64.

This work is licensed under a Creative Commons Attribution 4.0 International License.
About The Author
![]()
A New Edition of Web of Science
Journal Impact Factor
2022: 0.5
Five Year: 0.8
Journal is Indexed in

Cabells Whitelist
![]()


