Rheological Behavior of Ruminal Fluid Obtained from Barley Feed Sheep
Ioana Stanciu
University of Bucharest, Faculty of Chemistry, Department of Physical Chemistry, 4-12 Elisabeta Blvd, 030018, Bucharest, Romania.
Corresponding Author E-mail: Istanciu75@yahoo.com
DOI : http://dx.doi.org/10.13005/ojc/380228
Article Received on : 10-Feb-2022
Article Accepted on : 14-Apr-2022
Article Published : 20 Apr 2022
Reviewed by: Dr. Syed Ismail Ahmad
Second Review by: Dr. Vipan Kumar
Final Approval by: Dr. Dinesh Chand Sharma
This article presents the study of the rheological behavior of ruminal fluid in sheep obtained from barley feed and barley and yeast feed. We studied the influence of shear rate on the experimental values of shear stress and apparent viscosity for ruminal fluid obtained from feed with 40% barley. Measurements were made at 39° C, with a Physica MCR 300 rheometer, using the DG26.7 concentric cylinder measuring system. From the experimental data it can be seen that the best overlaps between the experimental data and the calculated curves are obtained when using the Herschel-Bulkley, Casson and Vocaldo models, ie precisely the models that propose the existence of a flow effort.
KEYWORDS:Rheology; Ruminal Fluid; sheep
Download this article as:| Copy the following to cite this article: Stanciu I. Rheological Behavior Of Ruminal Fluid Obtained From Barley Feed Sheep.Orient J Chem 2022;38(2). |
| Copy the following to cite this URL: Stanciu I. Rheological Behavior Of Ruminal Fluid Obtained From Barley Feed Sheep.Orient J Chem 2022;38(2). Available from: https://bit.ly/3vuDW5s |
Introduction
In general, fluids do not follow the mathematical model given by Newton’s law for flow, shown in Figure 1a:

where τ represents the shear stress, expressed in Pa, η – the dynamic viscosity, expressed in Pa · s and γ – shear rate, expressed in s-1. These are non-Newtonian fluids, for which the viscosity is no longer constant, but changes with shear rate (at constant composition and temperature).
Non-Newtonian fluids have the following types of flow: ideal, pseudoplastic and dilating plastic, which can be highlighted by the flow curves, also called rheograms, τ = f(γ) ,shown in Figure 1.
 |
Figure 1: Rheograms for: a – Newtonian flow; a ‘- ideal plastic; b – pseudoplastic with zero flow, b ‘- pseudoplastic with flow limit voltage; |
For the ideal plastic flow the rheogram is linear, as for the Newtonian one (figure 1a ‘), but the line meets the voltage axis at a certain value called limit or critical flow voltage, τ0 (figure 1a ‘). Such fluids are also called Bingham bodies, the mathematical relation that quantitatively describes this behavior being given by the Bingham model:
The flow limit stress – defined as the minimum stress that must be applied to a concentrated polymer solution to flow – is a very important parameter, causing the containers to flow due to their own weight when they are placed in the reverse or horizontal position.
The ideal plastic flow is found in thick greases and some oils that contain large amounts of dissolved polymers.
Pseudoplastic flow is characterized by the fact that the viscosity, called apparent, decreases with increasing shear rate (the solution becomes thinner). In this case, the rheogram does not show any linear portion, the viscosity of the solution being still constant (figure 1b, b ‘).
Pseudoplastic behavior can be explained by the existence of structures that are partially or completely destroyed during flow. Thus, the decrease in viscosity as the shear rate increases, respectively the shear stress, is due, in some cases, to the destruction of agglomerates formed by hydrogen bonds or van der Waals forces.
For dilating flow, the viscosity increases with increasing shear rate, as in Figure 1c, c ‘.
The following describes the mathematical models used to study pseudoplastic and dilating behavior.
The Ostwald-de Waele model, with the relation speed-tension of shear has the form:

where K is a constant called the consistency index or viscosity descriptor, and the exponent n is called the flow index or plasticity descriptor, describing the deviation of the flow from Newtonian behavior. Its value is between 0 and 1 for pseudoplastic fluids and greater than 1 for dilating fluids (n = 1 for Newtonian fluids). According to this model, the flow starts at zero shear stress. Apparent viscosities are determined from the tangent at each point in the rheogram.
Herschel-Bulkley model derived from the previous one, by completing a term τ0, to take into account the flow limit voltage:

The Ostwald-de Waele and Herschel-Bulkley models are also known as power law models and are used to describe the pseudoplastic behavior of concentrated solutions.
The Cross model describes the relationship between viscosity and shear rate as 1-3:

where η0 is the viscosity at the lowest shear rate, η∞ – viscosity at the highest shear rate, β – constant expressed in units of time, and m – dimensionless quantity called shear index. The degree of thinning of the sample (pseudoplasticity) is given by the value m: when it approaches zero the system approaches the Newtonian behavior, and when it approaches 1, the system approaches the pseudoplastic behavior 4.
Rheological models describing the behavior of ruminal fluid in sheep obtained from oat feed. Model Carreau:
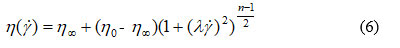
Where h0 viscosity at zero shear rate (Pa.s), h∞ viscosity at infinite shear rate (Pa.s), λ relaxation time (s) and n power index 5-11, 10-17.
Model Vocaldo:

Model Casson

where τ is the shear stress, τo – yield stress, η – viscosity, γ– shear rate, n – flow index and k – index of consistency.
Material and methods
The study of rheological behavior was done for ruminal fluid obtained from sheep feed with barley and feed with barley and yeast, fluid harvested after two diets: the classic diet (concentrated with 40% oats) and the classic diet with the addition of feed yeast 7-9. Measurements were made at 39°C, with a Physica MCR 300 rheometer, using the DG26.7 concentric cylinder measuring system.
Results and discussion
From the experimental data it is found that the viscosity values decrease as the shear rate increases, it appears that the ruminal fluid has a pseudoplastic fluid behavior in both types of diet. The appearance of the rheograms in figure 1 confirms the pseudoplastic character of this fluid.
For the interpretation of the experimental data it was assumed that the experimental dependence τ = f(γ) can be described by the model of the law of power (relation 1).
The expression of the law of power (relation 1) can be linearized by logarithm:

The graphical representation of this model, ṙṙṙfrom the intersection to the ordinate the value of ln K is obtained, and from the slope the value of n, as can be seen from figure 2. For the two types of fluids the results from table 1 were obtained. for K and n, the calculated values for the dependencies were obtained τ = f (γ) , respectively ηa = f(γ) .
 |
Figure 2: The influence of shear rate on the experimental values of shear stress and apparent viscosity for ruminal fluid obtained from feed with barley 40%. |
Continuous line – calculated dependency τ = f (γ) , dotted line – calculated dependency η = f(γ).
 |
Figure 3: Linearization of experimental dependence for the two ruminal fluids. |
As can be seen from Figure 2, the calculated dependencies overlap very well over the experimental values, which confirms that the power law model can be used to interpret the rheological behavior of ruminal fluid.
Table 1: Rheological characteristics of ruminal fluids obtained by linear regression applied to the linearized form of experimental dependence τ = f (γ).
|
Rheological characteristics |
The classic diet |
The classic diet with the addition of feed yeast |
|
n |
0.483±0.008 |
0.436±0.013 |
|
K (mPa . s) |
16.59±0.28 |
7.12±0.22 |
|
R |
0.9966 |
0.9873 |
For a more complete characterization, the data obtained were interpreted using the following rheological models: power law (figure 4), Cross (figure 5), Carreau (figure 6), Herschel-Bulkley (figure 7), Vocaldo (figure 8), and Casson (figure 9). It should be noted that in the mathematical expression of three models, namely Herschel-Bulkley, Casson and Vocaldo is found the flow effort τo.
The nonlinear regression method was used, using the Table Curve program. The Table Curve program allows the user to define a maximum of 50 nonlinear functions. A user-defined nonlinear function contains all the information needed to fit the function: the function name, the fitted parameters (constants), the function formula, the initial parameter estimates, the constraints for each parameter.
It is possible to graphically adjust the initial estimates to ensure better fit convergence. The model allows the introduction and adjustment of a maximum of 10 parameters, presented either as A, B, C, …, or in the form A0, A1, A2, …. The purpose of the graphical adjustment is to set the parameters in such a way that the start of fitting nonlinear to start with data closer to the values obtained. Partial derivatives of defined functions can be used to find insignificant parameters. If a partial derivative is constant, it must have the value 1, which means that it is a real constant (parameter) in the defined function. If a parameter has no significant contribution, this is a first indication that this parameter does not belong to the defined model.
The values of the rheological characteristics of the models used are those in table 2, and the curves calculated with the models used are presented graphically in figures 4-9.
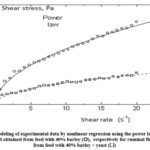 |
Figure 4: Modeling of experimental data by nonlinear regression using the power law model for ruminal fluid obtained from feed with 40% barley (), |
\
 |
Figure 5: Modeling of experimental data by nonlinear regression using the Cross model for ruminal fluid obtained from feed with 40% barley () |
 |
Figure 6. Modeling of experimental data by nonlinear regression using the Carreau model for ruminal fluid obtained from feed with 40% barley (). |
 |
Figure 7: Modeling of experimental data by nonlinear regression using the Herschel-Bulkley model for ruminal fluid obtained from feed with 40% barley (). |
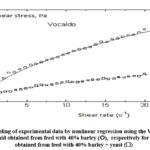 |
Figure 8: Modeling of experimental data by nonlinear regression using the Vocaldo model for ruminal fluid obtained from feed with 40% barley () |
 |
Figure 9: Modeling of experimental data by nonlinear regression using the Casson model for ruminal fluid obtained from feed with 40% barley () |
It can be seen that the best overlaps between the experimental data and the calculated curves are obtained when using the Herschel-Bulkley, Casson and Vocaldo models, ie precisely the models that propose the existence of a flow effort. It appears from table 2 that for each of the two studied fluids, the flow effort has similar values, regardless of the rheological model used.
Table 2: The values of the rheological characteristics obtained by nonlinear regression from the rheological models used.
|
Models rheological |
Rheological characteristics |
|
|
The classic diet |
The classic diet with the addition of feed yeast |
|
|
The law of power |
K = 17.16 mPa . sn n = 0.470 |
K = 7.12 mPa . sn n = 0.436 |
|
Cross |
ho = 28.3 mPa h∞ = 2.5 mPa k = 0.775 sn n = 1.106 |
ho = 688.4 mPa h∞ = 0.43 mPa k = 97.17 sn n = 0.677 |
|
Carreau |
ho = 34.0 mPa k = 4.31 s s = 0.495 |
ho = 8.17 mPa k = 4.85 s s = 0.395 |
|
Herschel-Bulkley |
ho = 8.5 mPa K = 9.5 mPa . sn n = 0.637 |
ho = 3.9 mPa K = 3.8 mPa . sn n = 0.605 |
|
Vocaldo |
ho = 10.6 mPa k = 4.8 mPa-n . s n = 0.571 |
ho = 6.3 mPa k = 0.11 mPa-n . s n = 0.587 |
|
Casson |
ho = 9.91 mPa k = 38.7 mPa . s-0.5 |
ho = 6.86 mPa k = 21.8 mPa . s-0.5 |
Conclusions
The following conclusions can be drawn from the experimental data. From the graphs it can be seen that the best overlaps between the experimental data and the calculated curves are obtained when using the Herschel-Bulkley, Casson and Vocaldo models, ie the models that propose the existence of a flow effort. It appears from table2 that for each of the two studied fluids, the flow effort has similar values, regardless of the rheological model used. The model that best describes the rheological behavior of sheep ruminal fluid is the model Herschel-Bulkley.
Conflict of Interest
There is no conflict of interest.
Funding Sources
There is no funding source.
References
- Cretescu I., Drinceanu D., Mateescu C. T., Caprita R., & Chereji R., 2009, Scientific Papers Animal Science and Biotechnologies, 42(1), 555-562.
- Sari W. N., Safika D., & Fahrimal Y., 2017, Veterinary world, 10(12), 1515.
CrossRef - Okuskhanova E., Rebezov M., Yessimbekov Z., Tazeddinova D., Shcherbakov P., Bezhinar T., … & Stuart M., 2018, Journal of Pharmaceutical Research International, 1-9.
- Leng R. A., 2017, Animal Production Science, 57(11), 2188-2203.
CrossRef - Adejoro F. A., Hassen A., & Thantsha M. S., 2018, PloS one, 13(10), e0206241.
CrossRef - Bava L., Rapett L., Crovetto, G. M., Tamburini A., Sandrucci A., Galassi G., & Succi G., 2001, Journal of Dairy Science, 84(11), 2450-2459.
CrossRef - Creţescu I. 2006, Cercetări asupra mecanicii fluidelor la nivelul tubului ndigestiv la rumegătorii mici, Teză doctorat, USAMVB Timişoara
- Cretescu I., Mateescu C., Caprita R., Drinceanu D., 2006. Rheological Characteristics of the Ruminat Fluid of the small Ruminants Feeded with Different Ratia of Barley, Lucrari Stiintifice, ser. Zootehnie, 49, 432-437
- Cretescu I., Drinceanu D., Caprita R., Mateescu C., Chereji R., 2005, YEA SACC1026 influence on some biophysical parameters of the ruminal fluid. Lucrari Stiintifice. Zootehnie si Biotehnologii Animaliere (Republica Moldova), 13, 315-317
- Hurtaud C., & Peyraud J. L., 2007, Journal of Dairy Science, 90(11), 5134-5145.
CrossRef - Ahmed J., Al-Salman F., & Almusallam A. S., 2013, Journal of Food Engineering, 119(3), 660-667.
CrossRef - Stanciu I., 2014, International Research Journal of Pure and Applied Chemistry, 531-540.
CrossRef - Stanciu I., 2013, Journal of Science and Arts, 13(4), 355.
CrossRef - Barnes H. A., 2000, A handbook of elementary rheology, Institute of Non-Newtonian Fluid Mechanics, Aberystwyth, UK.
- Stanciu I., 2018, Journal of Science and Arts, 3(44), 711-716.
- Stanciu I., 2019, Journal of Science and Arts,3(48), 703-708.
- Stanciu I., 2019, Journal of Science and Arts, 4(49), 938-988.

This work is licensed under a Creative Commons Attribution 4.0 International License.
About The Author
![]()
A New Edition of Web of Science
Journal Impact Factor
2022: 0.5
Five Year: 0.8
Journal is Indexed in

Cabells Whitelist
![]()


