Chemical and Physical Properties of Electrospinning Nanofibers of Different Concentrations of Polyacrylonitrile by Adding Octadecylamine
Alia Hindi1* , Said Abdul-Noor1 and Salah Al-Haj Omar2
1Department of Chemistry, Faculty of Science, University of Aleppo, Aleppo, Syria.
2Department of basic science, Mechanical Engineering College, University of Aleppo, Aleppo, Syria.
Corresponding Author E-mail: allyfirst1@hotmail.com
DOI : http://dx.doi.org/10.13005/ojc/380208
Article Received on : 14-Dec-2021
Article Accepted on : 13-Apr-2022
Article Published : 20 Apr 2022
Reviewed by: Dr. Suhaimi Suratman
Second Review by: Dr. Udara Sampath
Final Approval by: Dr. S.A. Iqbal
The viscosity of polyacrylonitrile solutions was determined at different concentrations and in the presence and absence of a specific concentration of the surfactant octadecylamine, which is ODA (5×10⁻⁵M), in order to determine the limiting concentration for the formation of the polymeric structure, and it was found that this concentration starts at (5%W). By weight, the prepared solutions were spun with a locally manufactured electrospinning device at a voltage of 20 KV and a flow of 0.5 ml/h, using X-ray diffraction spectrum and using Debye-Scherrer relationship. It was found that it ranged between (100-500) nm., using the complex impedance spectrum, it was found that the equivalent electrical circuit is resistance in parallel with a capacitor, then the relaxation time was calculated as a function of concentration, and it was found that the relaxation time increases with increasing concentration. Thus by using XRD spectroscopy, according to the average crystallization size of PAN by adding ODA, compared with pure PAN, a noticeable decrease was found in the average crystallization size after adding the surface-active substance.
KEYWORDS:Electrospinning; IS; Nanofibers; Octadecylamine; Polyacrylonitrile
Download this article as:| Copy the following to cite this article: Hindi A, Noor S. A, Omar S. A. H. Chemical and Physical Properties of Electrospinning Nanofibers of Different Concentrations of Polyacrylonitrile by Adding Octadecylamine. Orient J Chem 2022;38(2). |
| Copy the following to cite this URL: Hindi A, Noor S. A, Omar S. A. H. Chemical and Physical Properties of Electrospinning Nanofibers of Different Concentrations of Polyacrylonitrile by Adding Octadecylamine. Orient J Chem 2022;38(2). Available from: https://bit.ly/3v5Dn35 |
Introduction
The reason for the widespread production of PAN polyacrylonitrile fibers is due to the following important characteristics: the average molecular mass of the spun PAN, the distinctive physical and chemical properties of its spinning solutions, the relatively cheap polymerization process, and the ease of the heat treatment system. These qualities enable the control of the mechanical and structural properties required for the resulting fibers 1. Rheological properties are an important tool for the characterization of polymeric solutions. The study of the relationship of the viscosity of PAN with its concentration in a medium of dimethylformamide DMF, which is an organic solvent, showed the occurrence of severe association processes in the solution due to the mutual effects between the dipoles 2.
Electrospinning technology is considered a scientific revolution, and it is one of the modern and advanced technologies, and it is considered a scientific revolution in the field of producing polymeric nanofibers 3. The electrospinning mechanism relies on electrostatic forces in the production of polymeric fibers with nanoscale diameters, where these very small structures have the characteristics of important surface and structural properties, such as surface-to-volume ratio, high porosity, and mechanical and optical properties 4. The technique of electrospinning has begun to acquire a very great interest by researchers, and this can be attributed to the boom that occurred in the field of nanotechnology and its applications, as the number of universities, institutes, and research centers interested in this technology exceeded two hundred 5. Figure No. (1) shows the increasing rate of publication of research papers related to electrospinning applications from 1990 to 2019 6,7,8
 |
Figure 1: The rate of publication of research on electrospinning. |
This technique allowed the production of nanofibers with a wide range of applications, including: antibacterial by incorporating biocides into electrospinning solutions and wound dressings 4,8. It has also been used in the electrodes of solar cells and nanofibers can be used to purify liquids from particles with diameters less than a micron by filtering through electrically spun nanofibers 9. Because of the urgent need to search for new sources of pure water, electrospinning is at the forefront of current research to obtain clean water through the treatment of industrial and wastewater by Nano filtration 10, and nanofibers have also contributed to improving the properties of the electrodes of battery cells 11.
Although electrospinning is the simplest method for manufacturing polymeric nanofibers, there are some important factors that can have a significant impact on the structure and diameter formation of the generated nanofibers. Table (1) shows the most important factors affecting the electrospinning process: 12,13 .
Table 1: Factors affecting electrospinning technology.
|
|
The variables that influence the different factors |
|
Factors affecting the polymeric solution |
Viscosity, solution concentration, polymer molecular weight, solvent properties, surface tension, and electrical conductivity |
|
Factors affecting electrospinning technology |
Applied voltage, distance between injector head and collector, flow rate |
|
External factors |
temperature, relative humidity |
It is worth noting that the concentration of the polymer is a qualitative characteristic, related to the polymer itself, its molecular mass, and its viscosity [2,14]. The addition of surface-active colloids strongly affects the structural and mechanical properties of polymeric solutions, because the effectiveness of the mutual effects between the molecules of the polymer itself, is greatly affected by the presence of these materials, and the surface-active colloids also affect the shape and dimensions of the formed nanofibers [15].
The importance and purpose of the research
Research is accelerating in the last period to study the effect of adding some electrolytes, surface-active colloidal materials on the structural properties of polymer nanofibers prepared by the electrospinning method because of their importance in terms of controlling the diameter of the resulting nanofibers, thus increasing the surface area and increasing their mechanical strength and effectiveness in various applications [16].
Materials used
Polyacrylonitrile of known molecular mass is 100,000 g/mol
Dimethylformamide “DMF” solution with purity (GC) (99.5%) from MERCK company
Octadecylamine (C18H37NH2) ODA from Alfa Aesar
Devices used
The German-made falling ball viscosity device from HAAKE company, which complies with ISO 12058.
A locally manufactured electric spinning device.
X-ray diffraction device (XRD): Where an elevator made of copper was used that gives x-rays of a wavelength λ =1.5418 A0, Take measurements between angles 2q= (50-650).
Scanning Electron Microscopy” (SEM), an American-made Tuscan Veca 2 model, in collaboration with the University of Wisconsin in Milwaukee, USA. It has the following specifications: Scanning Electron Microscope Flex SEM 1000 II Accelerating Voltage: 20 kV, Secondary Electron (SE) Image, Magnification: 60,000X, Resolution: 4.0 nm
Impedance Spectroscope (IS): It is a programmable Gain Phase analyzer from SCHLUMBERGER CORPORATION No. (SI1253) that generates a spectrum of frequencies confined to the 0.01 HZ- (20000) range.
Method of work
Solutions of different concentrations of polyacrylonitrile were prepared by dissolving the samples in a dimethylformamide solution by continuous stirring on a magnetic mixer at laboratory temperature, until obtaining transparent polymeric solutions with the addition of ODA at a fixed concentration of (5×10⁻⁵M).
Prepare a solution of octadecylamine ODA at a concentration of 100 x 10-5 mol/l with a weight of 0.0269g of ODA, and put it in a volumetric flask with a capacity of 100ml with DMF solution.
Practical results and their discussion
Viscosity Measurement
The viscosity of the prepared solutions of different concentrations of PAN with a constant concentration of ODA (5×10⁻⁵M) was calculated, with the following relationship (1):
where k: device constant for the sphere: d1 the density of the sphere: d2 the density of the solution t: the time of the ball falling
Table (2) shows the results of measuring the viscosity of the solutions prepared in DMF solution at a temperature of 298K before and after adding a fixed concentration of ODA (5) ×10-5M), in Table (2).
Table 2: The viscosity of the solutions prepared at a temperature of 298K, before and after adding a fixed concentration of ODA is (5*10-5M).
|
Viscosity η (mPas) |
||
|
PAN W% |
With no addition |
With ODA (5×10⁻⁵M) |
|
1 |
1.495 |
0.886 |
|
3 |
8.831 |
3.231 |
|
5 |
30.902 |
14.902 |
|
8 |
109.333 |
81.333 |
|
10 |
264.968 |
228.012 |
|
12 |
530.7 |
468.227 |
|
15 |
1345 |
1159.5 |
|
18 |
2289 |
2038 |
Figure 3 shows the viscosity of the solutions prepared at 298K, before and after adding a fixed concentration (5×10⁻⁵M) of ODA.
 |
Figure 2: Viscosity of the prepared PAN solutions |
It is observed from Figure (2) that an exponential relationship at high concentrations of y = A.ebx relates the viscosity to the concentration in PAN solutions in the presence and absence of ODA. Where the viscosity increases with concentration linearly and slowly at small concentrations, but it begins to increase significantly starting with the marginal concentration to form the polymeric structure (approximately 5%w), that is, at this concentration, strong bonding bundles of polymeric molecules begin to form due to the presence of dipoles, and hydrogen bonds are formed, which in turn leads to a noticeable increase in viscosity, and a decrease in viscosity should be observed in general by adding ODA to different concentrations of PAN.
Electrospinning
The prepared samples were spun with the homemade electrospinning device shown in Figure (3).
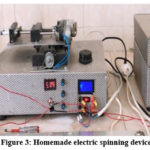 |
Figure 3: Homemade electric spinning device. |
The prepared PAN solutions were spun after adding a fixed concentration (5×10⁻⁵M) of ODA, and we found the following:
– Electrospinning of PAN/DMF solutions of concentrations between (5-18W%) was performed at specific parameters:
Solution flow rate: 0.5ml/h., Voltage lifter: 20 kv., Accumulator rotation speed:100 cy/min, The distance of the collector from the injector:10 cm, Diameter of the injector needle: 0.5 mm., Rotary cylindrical assembly.
A superficial study
Using a Scanning Electron Microscopy.” SEM, an American-made Tuscan Veca 2 model, a surface image of the prepared fibers was taken. Figure (4) shows the SEM electron microscopy images of the samples where the applied voltage is 5 kv and at a magnification of 15000. We conclude that the diameters of the resulting nanofibers range from (100-500) nm and Table (3) shows that the average diameters of the resulting nanofibers increase with increasing concentration.
 |
Figure 4: SEM electron microscopy images of spun PAN samples. |
Table (3) shows the increase in the average diameters of nanofibers for the prepared samples with increasing concentration.
Table 3: The average diameter of nanofibers for samples prepared at the concentration.
|
PAN, C % w+ ODA(5*10-5M) |
5 |
8 |
10 |
12 |
15 |
18 |
|
Av. fiber diameter(nm) |
115 |
155 |
200 |
255 |
340 |
450 |
Figure (5) shows the average diameter of the nanofibers of the prepared samples in terms of the concentration, and that the relationship between the average diameters of the nanofibers of the spun samples and the concentration is a linear relationship of the figure y = 26.093x – 43.219 due to the increase in the viscosity of the spun polymer solution 17. As for the concentrations (1,3%w), spinning was not done because the polymeric structure of polyacrylonitrile was not formed, and therefore the crystal structure of polyacrylonitrile begins to form at a concentration of 5% W of its concentration in DMF. 18
 |
Figure 5: The average diameter of the nanofibers of the prepared samples as a function of concentration. |
The X-ray diffraction spectrum (XRD) was studied using an anode-made copper X-ray spectrometer within an angular range of (50-650), for samples spun at room temperature T = 303 K in order to know the structural properties of the prepared sample. Figure (6) shows the X-ray diffraction spectrum of the samples spun.
The crystal structure was determined based on XRD studies. In all samples, the characteristic peaks of polyacrylonitrile were in the presence of ODA at peak 20max~17 , which was characteristic of the hexagonal structure of PAN [19], and because of the strong interaction between the polymer chains and the surfactant ODA that hinders their movement, thus limiting the process of increasing the crystallization size.
Determining the average size of the PAN crystals
The average size of the PAN crystals in the presence of ODA was determined from the XRD spectrum shown in Fig. (6), from the mid-width of the X-ray diffraction peak intensity, in the hexagonal plane of PAN [20] and Figure (6) shows the X-ray diffraction of the prepared samples, where a peak is observed at 20max~17 of the hexagonal plane of the PAN.
 |
Figure 6: XRD diagrams of the prepared samples. |
Using the following Debye-Scherer (2) relationship 19,21:
where: Lhlk average size of crystallization size β mid-intensity width of the plane-corresponding diffraction peak in one radian, κ: constant 0.89 in the case of crystal particles, λ = 1.5401 A° X-ray wavelength, θmax plane-corresponding diffraction angle peak (maximum peak).
Thus, Lhlk is given by the following relationship (3):
Where: β(Rad) = 0.026 as per the XRD plots of Figure (6).
The distance R between the polymeric chains of PAN polyacrylonitrile and the surfactant octadecylamine ODA was calculated, depending on the peak of the crystalline peak from the following relationship (4) 21:
From the Bragg relationship, the distance d between the polymeric chains within polyacrylonitrile (the spacing) was determined from the relationship (5):
where n is an integer of linear deviation.
The strain of the polymeric network (crystalline) ε was calculated from the following relationship (6):
The data on the crystal structure of the spun samples of pure polyacrylonitrile 20 were collected and compared with polyacrylonitrile by adding ODA in the following table (4):
Table 4: shows the crystallization volume decrease for PAN by adding ODA.
|
sample |
Diffraction Peak (2 |
L (nm) |
d-Spacing (Å) |
R (Å) |
e |
|
PAN[25] |
16.85 |
5.70 |
3.950 |
6.580 |
0.00092 |
|
PAN+ ODA |
17.00 |
5.27 |
3.907 |
6.511 |
0.00099 |
The results in Table (4) show a decrease in the crystallinity of polyacrylonitrile samples by adding octadecylamine compared with pure PAN, and consequently a decrease in the distance between the polymeric chains d.
AC measurements (Septal Impedance IS)
One of the most important methods for characterizing the electrical properties of materials is Impedance Spectroscope (IS). To use this technique to study and characterize the behavior of films in composite nanofibers 22. Where some coefficients affecting the electrical behavior of the material are calculated based on the nodal impedance spectrum, by applying an alternating current so that the studied sample placed between the condenser bulbs is connected to a gain phase analyzer with detection resistance Rd = 320 Ω, and an alternating signal of variable frequency is applied to the material. The Septal impedance is expressed by the following relationship (7): 23
Studying the effect of changing the concentration of the PAN samples at a constant temperature T=303K and a constant voltage V=4V on the nodal impedance spectrum IS
The nodal impedance spectra were taken for the samples prepared from PAN and after adding a fixed concentration (5*10-5M) of ODA, at a constant temperature T=303 K and a constant voltage V=4 Volt as shown in the following figure (7):
 |
Figure 7: The sum of the nodal impedance spectra of the six samples prepared from PAN and after adding a fixed concentration (5×10⁻⁵M). |
It is noticed from Figure (7) that the previous spectra consist of a regular and almost identical circular arc for all samples, which indicates that the material has regular crystals and that all dipoles have the same relaxation time for each of the studied samples 24
Relaxation time τp
The relaxation time τp was calculated for samples prepared from PAN and after adding a fixed concentration (5×10⁻⁵M) of ODA, at a constant temperature T=303 K and a constant voltage V=4 Volt as shown in the following table (5) using the following relationship (8):
By taking the value of the frequency corresponding to the highest value of (ω)
Table 5: Calculation of the relaxation time τp for samples prepared from PAN and after adding a constant concentration (5×10⁻⁵M) of ODA, at a constant temperature T=303 K and a constant voltage V=4 Volt.
|
PAN,C% w+ ODA (5×10⁻⁵M) |
5 |
8 |
10 |
12 |
15 |
18 |
|
(sec) |
0.000714 |
0.002105 |
0.002941 |
0.003846 |
0.005263 |
0.006667 |
Figure (8) presents the relationship of relaxation time with the concentration of the studied samples at a constant temperature T = 303 K and a constant voltage V = 4 Volt
 |
Figure 8: Relationship of the relaxation time to the concentration of the studied samples at a constant temperature T = 303 K and a constant voltage V = 4 Volt |
Figure (8) shows the relationship of relaxation time τp for the prepared samples in terms of concentration, and it is with a linear relationship of the form: y = 0.0005x – 0.0016. Which shows that increasing the concentration of prepared samples increases the relaxation time τp.
Loss factor
The loss factor was calculated according to the relationship (9), depending on the nodal impedance spectrum 25.
The following spectrums in Figure (9) show the relationship of the loss factor spectrum to the frequency dependency of the studied samples at a constant temperature T=303 K and a constant voltage V=4 Volt.
 |
Figure 9: The sum of the loss factor spectra with frequency dependence of the studied samples at a constant temperature T = 303 K and a constant voltage V = 4 Volt |
It is noticed from Figure (9) that the values of the loss factor increase at low frequencies until it reaches a maximum value of 222.9 HZ, after which its values begin to decrease, and this decrease is slightly at high frequencies, and this explains that when a changing electric field is applied to the insulator in the case of high frequencies, the polar molecules do not keep pace with the direction of the applied electric field and their frequency becomes different from the frequency of the applied field and a phase difference arises between the polarization and the field voltage when it is τ0≪1/ω, Then, the total change of polarization occurs, so the energy loss factor due to the relaxation of the dipoles is zero, and only the contribution of the loss due to the electronic relaxation appears. For electronic relaxation it decreases, while the losses due to relaxation of the dipoles take small values 26,27.
Conclusion
Samples of polyacrylonitrile were prepared with concentrations of (1-18) %W and their viscosity was studied before and after the addition of ODA surfactant colloid. It did not spin due to the lack of crystal structure formation, and therefore Taylor cone of droplet extrusion did not form. Also, for concentrations greater than 18% W, it did not spin due to very high viscosity at certain parameters, by calculating the average diameter of the fibers for each sample using the SEM device. In fact, it was observed that the average radii of the nanofibers of the samples increased with increasing concentration. By using XRD spectroscopy, according to the average crystallization size of PAN by adding ODA, compared with pure PAN, a noticeable decrease was found in the average crystallization size after adding the surface-active substance. Relaxation time τp by increasing the concentration.
Conflict of Interest
There is no conflict of interest.
Funding Sources
there is no funding source.
References
- IWAO T, Polymer solution. John Wiley & Sons, Inc., New York, 349.
- Qiang Xu,Lianghua Xu,Weiyu Cao,Sizhu Wu, A study on the orientation structure and mechanical properties of polyacrylonitrile precursors. Polymers for Advanced Technologies, Vol 16, Issue 8, (pp.642- 645), (2005).
CrossRef - Li, Z., & Wang, C., One-dimensional Nanostructures: Electrospinning Technique and Unique Nanofibers., j Springer Briefs in Materials, Library of Congress, (2013).
CrossRef - A. Greiner, J.H. Wendorff, Electrospinning: a fascinating method for the preparation of ultrathin fibers, Journal of German chemical society, Vol 46, Issue 30, (pp. 5670-5703), (2007).
CrossRef - Saikat Sinha Ray, Shiao-Shing Chen, Nguyen Cong Nguyen†, Hau Thi Nguyen, Electrospinning: a versatile fabrication technique for nanofibrous membranes for use in desalination, Nanoscale Materials in Water Purification, chapter 9, (pp.247-273), (2019).
CrossRef - Jaydevsinh M. Gohil, Rikarani R. Choudhury, Introduction to nanostructured and nano-enhanced polymeric membranes: preparation, function, and application for water purification, Nanoscale Materials in Water Purification, chapter 2, (pp. 25-57) (2019).
CrossRef - Yana Bagbi, Arvind Pandey, Pratima R. Solanki, Electrospun Nanofibrous Filtration Membranes for Heavy Metals and Dye Removal, Nanoscale Materials in Water Purification, (pp.275-288), (2019).
CrossRef - Yuan Gao, Yen Bach Truong, Yonggang Zhu, Ilias Louis Kyratzis, Electrospun Antibacterial Nanofibers: Production, Activity, and in Vivo Applications, J. APPL. POLYM. SCI, Vol 131, Issue 18, (2014).
CrossRef - Remi Roche, Fatma Yalcinkaya, Electrospun Polyacrylonitrile Nanofibrous Membranes for point of use Water and Air Cleaning, Chemistry Open, (pp.97–103), (2019).
CrossRef - Tlili, Tawfeeq Abdullah Alkanhal, Nanotechnology for water purification: electrospun nanofibrous membrane in water and wastewater treatment, Journal of Water Reuse and Desalination, Vol 9, Issue 3, (2019).
CrossRef - Roland Schierholz, Daniel Kr¨oger,a Henning Weinrich, Markus Gehring, Hermann Tempel, Hans Kungl, Joachim Mayer, R¨udiger-A. Eichel ,2019,The carbonization of polyacrylonitrile-derived electro spun carbon nanofibers studied by in situ transmission electron microscopy, RSC Adv., 9, (pp.6267–6277), (2019).
CrossRef - S. RAFIEI, S. MAGHSOODLOO, B. NOROOZI, V. MOTTAGHITALAB and A. K. HAGHI, Mathematical modeling in electrospinning process of nanofibers: A detailed Review, CELLULOSE CHEMISTRY AND TECHNOLOGY, (pp.323-338), (2013).
- Koyal Garg, Gary L. Bowlin, Electrospinning jets and Nano fibrous structures, Biomicrofluidics, Vol 5(1),.(2011)
CrossRef - Timo Grothe, Jan Lukas Storck, Marius Dotter, Andrea Ehrmann, 2020, Impact of solid content in the electrospinning solution on the physical and chemical properties of polyacrylonitrile (PAN) nanofibrous mats, Tekstilec,, Vol. 63(3), (pp.225–232), (2020).
CrossRef - Voyutsky S., Colloid Chemistry. Mir Publisher, Moscow (1978).
- Meizhou Sun a,1, Heling Guo a,1, Jiliang Zheng b, Yu Wang a, Xinghuan Liu, Qian Li Rongjie Wang, Xin Jia, 2020, Hydrophobic octadecylamine polyphenol film coated slow released urea via one-step spraying co-deposition, journal of. polymer testing. Vol 91, (2020).
CrossRef - Murat Şimşek, Zakir M O Rzayev and Ulviya Bunyatova, Multifunctional electroactive electrospun nanofiber structures from water solution blends of PVA/ODA–MMT and poly (maleic acid-alt-acrylic acid): effects of Ag, organoclay, structural rearrangement and NaOH doping factors, Adv. Nat. Sci.: Nanosci. Nanotechnology, Vol 7, (2016).
CrossRef - K. V. Khot, S. S. Mali et al., 2015, Simplistic Construction of Cadmium Sulfoselenide Thin Films Via a Hybrid Chemical Process for Enhanced Photo Electrochemical Performance, The Royal Society of Chemistry, P:1-4.
- Popescu, N.; Despa, V.; Ungureanu, D, et al, Structural analysis of PAN fiber by X-ray diffraction. J. Sci. Arts, (pp.89–94), (2010).
- Iwona Karbownik 1, Olga Rac-Rumijowska, Marta Fiedot-Toboła, Tomasz Rybicki, Teterycz , The Preparation and Characterization of Polyacrylonitrile-Polyaniline (PAN/PANI) Fibers, Materials, Vol 12(4), (2019).
CrossRef - Bhadra, S.; Khastgir, D. Determination of crystal structure of polyaniline and substituted polyanilines through powder X-ray diffraction analysis. Polymer. Testing., Vol 27, (pp.851–857), (2008).
CrossRef - B. Romero, G. D. Pozo, et al., Characterization of Organic and Perovskite Solar Cells by Impedance Spectroscopy, (2019).
CrossRef - Hag. Wafaa, Batal, Anwar, Nashed. Gasaan, studying electrical properties to ZnO, University of Aleppo, p54, (2009).
- Yu. Feldman, Yu. A. Gusev, M. A. Vasilyeva., Dielectric Relaxation Phenomena in Complex Systems, The Kazan Federal University, P: 13, (2012).
- M. A. Batal, G. Nashed, Fares Haj Jneed, 2012, Electrical Properties of Nanostructure Tin Oxide Thin Film Doped with Copper Prepared by Sol-Gel Method, Lat. Am. J. Phys. Educ. Vol. 6, No. 2, (2012).
CrossRef - Khemiri, N, Chaffar Akkari, et al., Studies of structural and optical properties of Cu-In-O thin films, Phys. Stat. Sol. A, (pp.1952-1956), (2008).
CrossRef - Asad. Ola, batal. Anwar, Preparing Perovskite Layer and Studying its Effect on Solar Cells Power Conversion Efficiency, Thesis PhD in Physics, University of Aleppo, (2021).

This work is licensed under a Creative Commons Attribution 4.0 International License.
About The Author
![]()
A New Edition of Web of Science
Journal Impact Factor
2022: 0.5
Five Year: 0.8
Journal is Indexed in

Cabells Whitelist
![]()


