Assessment of River Water Quality During a Religious Mass Bathing Festival at Sangam, Prayagraj
Anurag Samson Lall1* , Amit Chattree1, Tarence Thomas2, Saima Habib Khan1, Avinash Kumar Pandey3 and Jyoti Vandana Mani1
1Department of Chemistry, Sam Higginbottom University of Agriculture, Technology and Sciences, Prayagraj, Uttar Pradesh,211007, India.
2Department of Soil Science and Agricultural Chemistry, Sam Higginbottom University of Agriculture, Technology and Sciences, Prayagraj, Uttar Pradesh,211007, India.
3Department of Chemistry, GLA University, Chaumuhan, Mathura, Uttar Pradesh, 281406, India.
Corresponding Author E-mail: anuragsam7son@gmail.com
DOI : http://dx.doi.org/10.13005/ojc/380217
Article Received on : 14-Feb-2022
Article Accepted on : 15-Mar-2022
Article Published : 23 Mar 2022
Reviewed by: Dr. Khairul Nizam Mohamed
Second Review by: Dr. Ahmad Hamdani
Final Approval by: Dr. Yashas S. R.
Sangam, the confluence point of sacred Indian rivers Ganga and Yamuna, is an important site for different religious and cultural events. Surface water was collected from Sangam during the religious mass bathing festival, Kumbh Mela, from 10 January to 9 February, 2020 and the samples were investigated for 10 selected physicochemical parameters including chemical oxygen demand (COD), biochemical oxygen demand (BOD) and dissolved oxygen (DO). BOD and DO exceeded the recommended BIS permissible limits. Mass bathing significantly altered 6 of the parameters (p less than 0.05). The overall weighted arithmetic water quality index (WQI) during the sampling period was 80.07, indicating very poor quality of the river water. The mean WQI during the bath days (95.65 ± 19.84) was significantly higher (p less than 0.05) than that for non-bath days (64.49 ± 14.65). Stepwise multiple linear regression analysis revealed that the observed WQI values were significantly explained by the parameters COD, DO and BOD.
KEYWORDS:Mass Bath; Physicochemical Parameters; River; Sangam; Water Quality Index
Download this article as:| Copy the following to cite this article: Lall A. S, Chattree A, Thomas T, Khan S. H, Pandey A. K, Mani J. V. Assessment of River Water Quality During a Religious Mass Bathing Festival at Sangam, Prayagraj. Orient J Chem 2022;38(2). |
| Copy the following to cite this URL: Lall A. S, Chattree A, Thomas T, Khan S. H, Pandey A. K, Mani J. V. Assessment of River Water Quality During a Religious Mass Bathing Festival at Sangam, Prayagraj. Orient J Chem 2022;38(2). Available from: https://bit.ly/3D1WLQS |
Introduction
Water is one of the most important natural resource which is not only essential for supporting life, but also plays a crucial role in agricultural, industrial and economic development. However, extensive human population growth, unplanned and uncontrolled industrial activities as well as heedless environmental intervention has led to deterioration of various surface water bodies. Rivers are often considered as a major source of fresh water for different human needs including drinking, bathing, washing and other irrigational and industrial activities 1. Besides this, river water is also considered to have importance in various religions and traditions for attainment of peace through cleansing of mind and soul.
Usually, the towns located on both sides of a river release several untreated industrial, agricultural and urban runoffs into it 2. Taking things aside, there are myriad of agents which not only alter the physicochemical nature of water, but also worsen the water quality, like discarding wastes directly in water, defecating along the banks, cremation of dead bodies and religious mass bathing. Thus, an array of parameters including pH, electrical conductance, total dissolved solids, alkalinity, hardness, dissolved oxygen, biochemical oxygen demand, chlorides and nitrates aids in estimating the extent of contamination 3. Several government agencies and other regulatory bodies such as the World Health Organization (WHO) have established thresholds for these parameters in order to monitor and prevent pollution of rivers and other freshwater resources. However, estimating the degree of contamination using these parameters, yields enormous complex data and the individual interpretation of these parameters often leads to uncertainty 4. Therefore, the water quality index (WQI) serves as an appropriate tool to effectively represent the bulk information of these parameters and to reduce it into a single dimensionless value that helps in complete understanding of water for its human consumption and other industrial and agricultural purposes 5. Thus, WQI helps in expressing the complete data in a lucid manner that can be easily communicated to policy makers as well as common citizens 6. Multivariate statistical techniques such as multiple linear regression (MLR) may also be used to minimize bulk water quality data and to define the essential parameters that explain the variation in WQI, without losing the original information 7,8.
Prayagraj city, formerly known as Allahabad, in the state Uttar Pradesh of Northern India, is known for the confluence point of two sacred rivers Ganga and Yamuna, consequently making it a venue for various large-scale religious and cultural programs 9. Each year lakhs of devotees participate in different religious gatherings at Sangam, Prayagraj for mass bathing and offering prayers and flowers. Even though water resource contamination causes roughly 80% human diseases 1, there has been a lack of research regarding the quality of river water during religious mass bathing festivals, especially at this particular site of India.
Present manuscript aims to find out how mass bathing affects the water quality at Sangam, Prayagraj during the Magh Mela festival and defines a mathematical expression for WQI using multiple linear regression.
Materials and Methods
Sampling and analysis
Prayagraj city (25.4358ºN 81.8463ºE) is among the ancient most cities of India with immense religious importance for Hindus, because of the confluence of two sacred rivers Ganga and Yamuna 9. The city is often known as “Tiratharaj” in the language Hindi, which means “king of all pilgrimages”, and is a major site for various religious and cultural programs 10. The city is well connected to other important cities Lucknow and Kanpur via the National Highway (NH-2). Figure 1 shows the map of Prayagraj city, indicating the location of the sampling site.
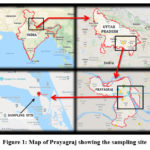 |
Figure 1: Map of Prayagraj showing the sampling site |
Samples were collected from the above-mentioned location (25º25′31.026″N 81º53′15.198″E) during the Magh Mela festival from 10 January to 9 February, 2020. Table 1 shows the list of religious mass baths held during this period. Collection of samples was performed during the evenings on the mentioned mass bathing dates and a day before these bathing dates, using sterile polyethylene bottles from a depth of 20 cm below the surface of water 2. The collected samples were immediately stored in portable ice-box and were refrigerated in laboratory at temperature below 4ºC until analysis 11. The physicochemical parameters were analyzed in agreement with the standard protocols given by American Public Health Association 12.
Table 1: List of religious mass baths during Kumb Mela festival.
|
Date |
Occassion |
|
10 January 2020 |
Paush Purnima |
|
15 January 2020 |
Makar Sankranti |
|
24 January 2020 |
Mauni Amavasya |
|
30 January 2020 |
Basant Panchami |
|
09 February 2020 |
Maghi Purnima |
Evaluation of Water Quality Index (WQI)
WQI assists as a valuable tool to measure the overall contamination status of water and its adequacy for specific human needs. The approach is based on normalization of bulk water quality data and transforming it into a single value, which can represent the whole data in more simplified manner 13,14. This technique was initially developed by Horton in 1965 15 and was further modified by Brown in 1970 16. In recent decades, a number of methods have been developed for evaluating WQI 4. Several recent studies have used the weighted arithmetic method for determining WQI for different Indian rivers 1, 5, 14, 17, 18.
The present manuscript employs the weighted arithmetic procedure for estimation of WQI at the sampling site using ten most common parameters including pH, electrical conductance (EC), total dissolved solids (TDS), total alkalinity (TA), total hardness (TH), chemical oxygen demand (COD), biochemical oxygen demand (BOD), dissolved oxygen (DO), chlorides (Cl) and nitrates (NO3), making use of following equation:
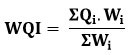
Where Qi and Wi are the quality rating scale and relative unit weight of each water quality parameter respectively.
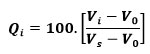
where Vi is the experimental value of the ith parameter, V0 is its ideal value in case of pure water [V0 = 0 for every parameter, except for pH (7.0) and DO (14.6)] and Vs is the recommended standard permissible value for this parameter.
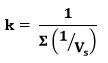
The unit weight (Wi) is evaluated by the formula

where k is the proportionality constant, which may be calculated as
Statistical Analysis
The obtained data was statistically analyzed with help of IBM SPSS (version 20.0) and Microsoft Excel (version 2010). Statistically significant difference between the data sets was analyzed using the parametric Student’s t-test as well as the non-parametric Mann-Whitney U test. Multiple linear regression (MLR) analysis was used to investigate relationship between the dependent variable and the predictor variables. Following equation was used for the MLR models:
Y= B0 + B1X1 + B2X2 + B3X3 + … + BnXn
where Y is the independent variable, B0 is the intercept on y axis and B1, B2, B3,…., Bn are the coefficients for the predictor variables X1, X2, X3,….., Xn respectively. The accuracy of the models was measured using the regression coefficient (R2).
The multi-collinearity criteria was observed with help of correlation coefficients between the predictor variables, which were lower than 0.8 8. The auto-correlation in the data for MLR models was investigated by Durbin-Watson test. Any value for Durbin-Watson static near 2.0 and within the range 1.5 – 2.5 was assumed to indicate no auto-correlation.
Results and Discussion
Measurement of physico-chemical parameters
Table 2 illustrates the overall descriptive statistics of various parameters for river water at Sangam, during the Magh Mela festival. The average measurements of pH, TDS, TA, TH, COD, BOD, DO, Cl¯, NO3¯ and EC were 7.7, 456.7, 185.9, 160.9, 10.9, 4.1, 7.6, 34.0, 0.2 mg/l and 231.7 µS cm-1 respectively.
Table 2: Overall descriptive statistics of various physico-chemical parameters
|
Parameter |
Mean ± SD (n = 10) |
Range |
Desirable value 19 |
|
pH |
7.7 ± 0.46 |
6.9 – 8.3 |
6.5 – 8.5 |
|
Electrical Conductance EC (µS cm-1) |
231.7 ± 25.10 |
196.4 – 262.0 |
250-750 |
|
Total dissolved solids TDS |
456.7 ± 92.76 |
328.2 – 573.1 |
500 |
|
Total alkalinity TA as CaCO3 |
185.9 ± 96.19 |
54.7 – 305.5 |
200 |
|
Total hardness TH as CaCO3 |
160.9 ± 29.75 |
109.0 – 210.3 |
200 |
|
Chemical oxygen demand COD |
10.9 ± 3.15 |
6.2 – 16.8 |
– |
|
Biochemical oxygen demand BOD |
4.1 ± 2.5 |
0.9 – 8.6 |
2 |
|
Dissolved oxygen DO |
7.6 ± 2.32 |
3.9 – 11.7 |
6 |
|
Chloride |
34.0 ± 12.75 |
17.6 – 49.9 |
250 |
|
Nitrate |
0.2 ± 0.18 |
0.0 – 0.5 |
45 |
Except EC and pH all values are in mg/l
Comparison of these values with the Bureau of Indian Standards (BIS) limits, reveals that BOD and DO levels were relatively higher while the chloride and nitrate concentrations were substantially lower than the recommended permissible limits. Higher BOD levels suggest accumulation of excess microbes due to release of human excretory matter, use of soaps, detergents and offerings of flowers and incense 10. The other parameters such as EC, TDS, TA and TH were well within the recommended range. Similarly the existence of excess phytoplanktons might explain the elevated DO levels 20.
Throughout the sampling duration, the pH readings indicated a slightly alkaline nature due presence of carbonates, bicarbonates and hydroxyl ions on account of erosion of limestone bedrock and certain other alkaline contaminants from domestic effluents as well as due to mass bathing activity during the festival. Nearly similar range of values for pH and DO were earlier reported at different sites of Prayagraj 1.
Correlation of parameters
The mutual relationship between the parameters was investigated with help of Pearson’s correlation matrix which has been depicted in Table 3. A glance at this table reveals that the parameters pH and DO exhibit negative correlation with rest of the parameters. The study also demonstrated a significantly strong correlation (r = 0.841, p < 0.01) between pH and DO indicating enhanced dissolution of oxygen at higher pH on account of unpropitious bacterial growth.
Table 3: Correlation matrix of physico-chemical parameters.
|
|
pH |
EC |
TDS |
TA |
TH |
COD |
BOD |
DO |
Cl |
NO3 |
|
pH |
1 |
|
|
|
|
|
|
|
|
|
|
EC |
-.514 |
1 |
|
|
|
|
|
|
|
|
|
TDS |
-.820** |
.443 |
1 |
|
|
|
|
|
|
|
|
TA |
-.734** |
.264 |
.937** |
1 |
|
|
|
|
|
|
|
TH |
-.428 |
-.023 |
.447 |
.505 |
1 |
|
|
|
|
|
|
COD |
-.712** |
.350 |
.636* |
.634* |
.742* |
1 |
|
|
|
|
|
BOD |
-.878** |
.674* |
.866** |
.726* |
.455 |
.703** |
1 |
|
|
|
|
DO |
.841** |
-.763* |
-.831** |
-.682* |
-.411 |
-.718** |
-.745** |
1 |
|
|
|
Cl |
-.827** |
.384 |
.989** |
.526 |
.486 |
.891* |
.880** |
-.825** |
1 |
|
|
NO3 |
-.809** |
.813** |
.760* |
.632 |
.358 |
.863* |
.939** |
-.903** |
.746* |
1 |
* Correlation is significant at 0.05 level (2-tailed)
** Correlation is significant at 0.01 level (2-tailed)
Similarly, it was noticed that TDS exhibited significantly higher positive correlation with TA and Cl, suggesting major contribution of hydroxide, bicarbonate, carbonate and also chloride ions towards the overall TDS of the surface water. Among other parameters, the variation in TH values (160.9 ± 29.75) is comparatively low and thus TH exhibits relatively weak correlation with other parameters.
Assessment of river water quality using WQI
The river water quality at Sangam was determined in terms of weighted arithmetic water quality index (WQI) using 10 selected parameters viz. pH, EC, TDS, TA, TH, COD, BOD, DO, Cl¯ and NO3¯. The evaluation of WQI involves transformation of each water quality parameter having different dimension to a common scale by assigning a unit relative weight Wi 5. The standard permissible values (Vs) and relative unit weights (Wi) of various parameters used for calculation of WQI have been illustrated in Table 4.
Table 4: Standard permissible values (Vs) and relative unit weights (Wi) of various parameters
|
Parameters |
Permissible Value (Vs)* |
Relative unit weight (Wi) |
|
pH |
8.5 |
0.195516 |
|
EC |
750 |
0.002216 |
|
TDS |
500 |
0.003324 |
|
TA |
120 |
0.013849 |
|
TH |
300 |
0.00554 |
|
COD |
10 |
0.166188 |
|
BOD |
5 |
0.332377 |
|
DO |
7 |
0.237412 |
|
Cl |
250 |
0.006648 |
|
NO3 |
45 |
0.036931 |
The overall status of water quality was decided on basis of WQI values viz, excellent (0 – 25), good (26 – 50), poor (51 – 75), very poor (76 – 100) and not suitable for drinking (> 100) respectively 1, 7. The overall mean value of WQI observed during the Magh Mela festival was 80.07, suggesting very poor quality of river water. Table 5 shows a comparison of weighted arithmetic WQI values obtained in present study with those reported in other studies for different Indian rivers. The table reveals that the WQI values obtained in present study lies well within the range of values reported in other studies.
Table 5: Comparison of WQI values with other studies in India.
|
S. No. |
Region |
mean WQI* (min – max) |
Reference |
|
|
1 |
River Ganga, Prayagraj, Uttar Pradesh |
103.72 (86.20 – 157.69) |
1 |
|
|
2 |
River Sabarmati, Gujrat |
74.49 (19.30 – 98.62) |
17 |
|
|
3 |
River Ganga, Haridwar, Uttrakhand |
64.83 (56.28 – 73.05) |
6 |
|
|
4 |
River Kolong, Assam |
72.23 (49.25 – 169.20) |
5 |
|
|
5 |
River Narmada, Madhya Pradesh |
45.74 (9.90 – 260.20) |
22 |
|
|
6 |
River Gomti, Lucknow, Uttar Pradesh |
69.50 (42.90 – 101.90) |
14 |
|
|
7 |
River Tungabhadra, Karnataka |
79.73 (38.60 – 156.70) |
23 |
|
|
8 |
River Sabarmati, Gujrat |
282.52 (139.87 – 647.01) |
24 |
|
|
9 |
Sangam, Prayagraj, Uttar Pradesh |
80.07 (44.37 – 121.75) |
Present Study |
|
*reported values are weighted arithmetic water quality index
Effect of mass bathing
Although mass bathing is considered a sacred tradition infused with several religious beliefs, however due to unintentional negligence of devotees, it poses a substantial threat to the water quality. Defecation, washing of clothes, use of detergent, soaps, fluoridated toothpastes and offering of milk, oil, flowers and incense have mainly degrade water during mass baths 25. In order to investigate the immediate effect of mass bathing on water quality, the measurement of water quality parameters and the evaluation of WQI were performed on respective bath dates as well as the non-bath dates i.e., one day preceding the corresponding bath dates.
Table 6 illustrates the effect of mass bathing on various water quality parameters. It is evident from the table that the mass bathing significantly altered the parameters pH, TDS, TA, BOD, DO and Cl¯ (p < 0.05). Due to excess accumulation of bioorganic matter and microbes, mass bathing caused significant reductions in the values of pH and DO 10, while the parameters TDS, TA, BOD and Cl¯ increased significantly (p < 0.05). Thus the overall quality of river water was affected, consequently, the average WQI during the bath dates (95.65 ± 19.84) was significantly higher (p < 0.05) than that on corresponding non-bath dates (64.49 ± 14.65).
Table 6: Effect of mass bathing activity on water quality at Sangam
|
Parameter |
Before bath |
On bath day |
p-value |
|
|
t-test |
Mann-Whitney |
|||
|
mean ± SD |
mean ± SD |
U test |
||
|
pH |
8.1*± 0.21 |
7.4 ± 0.35 |
0.008 |
0.012 |
|
EC (µS cm-1) |
228.4 ± 27.30 |
235.0 ± 25.4 |
0.704 |
0.754 |
|
TDS |
373.3 ± 33.1 |
540.1* ± 29.69 |
0 |
0.009 |
|
TA |
99.5 ± 36.74 |
272.4* ± 27.92 |
0 |
0.009 |
|
TH |
146.9 ± 26.00 |
174.9 ± 28.72 |
0.145 |
0.117 |
|
COD |
9.1 ± 2.25 |
12.7 ± 3.07 |
0.073 |
0.094 |
|
BOD |
2.4 ± 1.23 |
5.9* ± 2.33 |
0.025 |
0.028 |
|
DO |
9.1* ± 2.04 |
6.2 ± 1.67 |
0.042 |
0.047 |
|
Cl |
22.4 ± 3.66 |
45.6* ± 4.14 |
0 |
0.009 |
|
NO3 |
0.1 ± 0.12 |
0.3 ± 0.20 |
0.101 |
0.082 |
|
WQI |
64.49 ± 14.65 |
95.65* ± 19.84 |
0.024 |
0.028 |
Except EC and pH all values are in mg/l
*Statistically significant difference (p < 0.05)
The pattern of variation of WQI on successive mass baths has been depicted in Figure 2.
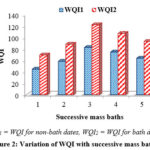 |
Figure 2: Variation of WQI with successive mass baths |
The figure reveals that the WQI values increased gradually and the maximum value was attained on third mass bath i.e., Mauni Amavasya on 24 January 2020. Thereafter a steady decrease was observed in the WQI values. The reason for observing highest WQI on Mauni Amavasya, may be attributed to the fact that this bath date is especially considered auspicious and holy, thus attracting a huge crowd of devotees 25.
Multiple linear regression (MLR) analysis
The present manuscript utilizes MLR in order to establish a mathematical relation to express the dependence of WQI on different water quality parameters by assuming a linear relationship between the response and the predictor variables. The relevancy of the MLR model was examined by the coefficient of determination (R2 value). Any cognizable autocorrelation in data was detected using the Durbin – Watson test. In order to scrutinize the most influential parameters, the variation of WQI was observed with respect to each parameter with help of scatterplots and corresponding R2 values. Figure 3 displays the plots of WQI as a function of parameters COD, BOD and DO. The R2 values obtained for these plots were > 0.8 suggesting the importance of these variables in deciding the overall WQI of the river water at Sangam.
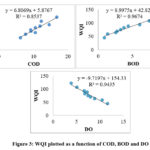 |
Figure 3: WQI plotted as a function of COD, BOD and DO |
Moreover, as evident from Table 3 these variables are mutually not too highly correlated (r < 0.8). Therefore, an MLR model was framed using these variables as predictors. The details of the model including the R2 value, Durbin – Watson statistic, the ANOVA results and the values of coefficients have been illustrated in Table 7.
Table 7: Details of MLR model
|
MODEL SUMMARY |
|||||
|
Predictors |
R |
R Square |
Adjusted R Square |
Std. Error |
Durbin Watson |
|
COD, BOD, DO |
.999 |
.999 |
.995 |
.61141 |
2.336 |
|
ANOVA RESULTS |
|||||
|
|
Sum of Squares |
df |
Mean Square |
F |
Sig. |
|
Regression |
4858.614 |
3 |
1619.538 |
4332.412 |
.000 |
|
Residual |
2.243 |
6 |
.374 |
|
|
|
Total |
4860.857 |
9 |
|
|
|
|
COEFFICIENTS |
|||||
|
|
Unstandardized Coefficients |
Standardized Coefficients |
t |
Sig. |
|
|
|
B |
Std. Error |
Beta |
||
|
(Constant) |
63.903 |
3.426 |
|
18.655 |
.000 |
|
COD |
1.509 |
.106 |
.205 |
14.230 |
.000 |
|
BOD |
5.121 |
.247 |
.560 |
20.760 |
.000 |
|
DO |
-2.812 |
.279 |
-.281 |
-10.097 |
.000 |
As evident from the table, the R2 value and the Adjusted R2 value for the model were 0.999 and 0.995 respectively which clearly points out that the model accurately predicted the WQI values. The Durbin – Watson statistic for the model was 2.336 i.e., well within the range 1.5 – 2.5 and close to the value 2.0, suggesting absence of any significant autocorrelation in the data. Moreover, the predictor variables used in the regression model exhibited high statistical significance (p < 0.01). Figure 4 (a) shows the normal probability plot obtained for the model revealing a comparison between model’s predicted WQI values and the observed WQI values. Examination of this plot indicated that the model clearly followed the experimental data. The predicted values were either slightly higher or slightly low, but the overall difference remained very small.
 |
Figure 4: (a). Normal probability plot, (b). Scatterplot of predicted values of WQI versus observed values. |
Similarly, the R2 value 0.9995 for the plot between predicted values and observed values of WQI in Figure 4 (b) further confirms this fact. Hence, the variation in WQI values was significantly explained by the predictor variables COD, BOD, DO and the water quality index may be expressed by following equation (R2 = 0.999):
WQI = 63.903 + 1.509COD + 5.121 BOD – 2.812 DO
Conclusion
Sangam, the confluence point of rivers Ganga and Yamuna, is one of the India’s most important holy sites. However, on account of unintentional negligence and inadequate sanitization, the gathering of huge crowds at this site, results in degradation of the water quality. Samples were brought from Sangam during the Magh Mela festival in the year 2020. WQI score was employed to measure the status of these samples. Among the different parameters, BOD and DO exceeded the prescribed Indian limits. The parameters pH and DO were highly correlated mutually as well as with other parameters, while TH exhibited relatively poor correlation with the other parameters. As a consequence of mass bathing, the parameters pH and DO decreased whereas TDS, TA, BOD and Cl¯ increased significantly. The overall mean WQI was 80.07 reflecting a very poor status of the water. The average WQI on bath days was significantly higher than that for non-bath days and the highest value of WQI was observed on the auspicious bath day, Mauni Amavasya, due to huge gathering of devotees. According to MLR analysis, the variation of WQI throughout the bath festival may be described quantitatively using the parameters COD, DO and BOD. Certain measures by the local authorities, such as construction of appropriate sanitation facilities, waste management and general awareness program regarding importance of sanitation can substantially improve the river water status.
Acknowledgement
The authors declare no conflict of interest associated with this manuscript. The present study did not receive any financial support. Authors gratefully acknowledge Vice-Chancellor, Sam Higginbottom University of Agriculture, Technology and Sciences, Prayagraj, UP, India, for providing necessary facilities. Authors are also thankful to Mr. Manish Kumar Pandey, Analytical Division, Biotech Park, Lucknow, UP, India, for providing technical support during the analysis of samples.
Conflict of Interest
There is no conflict of interest.
Funding Sources
There is no funding source.
References
- Sharma, P.; Meher, P.K.; Kumar, A.; Gautam, Y.P.; Mishra, K.P. Sustainability of Water Quality and Ecology, 2014, 3, 67-76.
CrossRef - Kamboj, N.; Kamboj, V. Water Science,2019, 33(1), 65-74.
CrossRef - Rahmanian, N.; Ali, S.H.B.; Homayoonfard, M.; Ali, N.J.; Rehan, M.; Sadef, Y.; Nizami, A.S. Journal of Chemistry, 2015, 2015, https://doi.org/10.1155/2015/716125.
CrossRef - Kadam, A.K.; Wagh, V.M.; Muley, A.A.; Umrikar, B.N.; Sankhua, R.N. Modeling Earth Systems and Environment, 2019, 5(3), 951-962.
CrossRef - Bora, M.; Goswami, D.C. Applied Water Science, 2017, 7(6), 3125-3135.
CrossRef - Bhutiani, R.; Khanna, D.R.; Kulkarni, D.B.; Ruhela, M. Applied Water Science, 2016, 6(2),107-113.
CrossRef - Ewaid, S.H.; Abed, S.A. The Egyptian Journal of Aquatic Research, 2017, 43(2),117-122.
CrossRef - Ewaid, S.H.; Abed, S.A.; Kadhum, S.A. Environmental Technology & Innovation, 2018, 11, 390-398.
CrossRef - Dwivedi, S.; Chauhan, P. S.; Mishra, S.; Kumar, A.; Singh, P. K.; Kamthan, M.; Nautiyal, C. S. Environmental Monitoring and Assessment, 2020, 192(4), 1-15.
CrossRef - Srivastava, R.K.; Sinha, A.K.; Pande, D.P.; Singh, K.P.; Chandra, H. Environmental Toxicology and Water Quality: An International Journal, 1996, 11(1),1-5.
CrossRef - APHA (American Public Health Association), Standard Methods for the Examination of Water and Wastewater, 2012, 27th Ed. Washington, DC.
- Tyagi, S.; Sharma, B.; Singh, P.; Dobhal, R. American Journal of Water Resources, 2013, 1(3), 34-38.
CrossRef - Goel, P.; Saxena, A.; Singh, D.S.; Verma, D. Curr. Sci., 2018, 114, 650-654.
CrossRef - Horton, R.K. Journal of Water Pollution Control Federation, 1965, 37(3), 300-306.
- Brown, R.M.; McClelland, N.I.; Deininger, R.A.; Tozer, R.G. Water and Sewage Works, 1970, 117(10).
- Shah, K.A.; Joshi, G.S. Applied Water Science, 2017, 7(3), 1349-1358.
CrossRef - Dutta, S.; Dwivedi, A.; Kumar, M.S. Environmental Monitoring and Assessment, 2018, 190(12), 718-734.
CrossRef - BIS (Bureau of Indian Standards) 10500, Specification for Drinking Water. Indian Standards Institution, New Delhi, 2012,pp. 1–5.
- Fouzia, I.; Amir, K. World Journal of Fish and Marine Sciences, 2013, 5(3), 322-334.
- WHO, Guidelines for Drinking-Water Quality. World Health Organization, Geneva, Switzerland, 2011, 216, 303-304.
- Gupta, N.; Pandey, P.; Hussain, J. Water Science, 2017, 31(1), 11-23.
CrossRef - Ranjith, S.; Shivapur, A.V.; Kumar, P.S.K.; Hiremath, C.G.; Dhungana, S. International Journal of Innovative Technology and Exploring Engineering, 2019, 8(9), 247-253.
- Khatri, N.; Tyagi, S.; Rawtani, D.; Tharmavaram, M. Sustainable Water Resources Management, 2020, 6(6), 1-11.
CrossRef - Shukla, S.; Gupta, S. Journal of Research in Engineering and Technology, 2013, 4(10), 313-319.

This work is licensed under a Creative Commons Attribution 4.0 International License.
About The Author
![]()
A New Edition of Web of Science
Journal Impact Factor
2022: 0.5
Five Year: 0.8
Journal is Indexed in

Cabells Whitelist
![]()


