The Adosrption Study for the Removal of Rhodamine-B from Artificial Aquatic Solution by Using Activated Hygrophila Auriculata Nano Carbon
M. Ajith kumar and S. Arivoli*
Department of Chemistry, Poompuhar College(AU), (Affiliated to Bharathidasan University), Melaiyur-609107, Tamilnadu, India.
Corresponding Author E-mail: arivu6363@gmail.com
DOI : http://dx.doi.org/10.13005/ojc/380119
Article Received on : 17-Jan-2022
Article Accepted on : 25-Feb-2022
Article Published : 28 Feb 2022
Reviewed by: Dr. Sangeeta Jha
Second Review by: Dr. S.Y. Pang
Final Approval by: Dr. S. Aftab Iqbal
To study the adsorption of Rhodamine-B dye (Rh-B) from artificial aquatic solution by using activated Hygrophila auriculata nano carbon under batch adsorption mode. Activated nano carbon was synthesized from Hygrophila auriculata and it was characterised by analytical methods such as BET(BJH), XRD, FTIR, and SEM with EDX. The equilibrium adsorption data were calculated and it was interrelated using Freundlich, Langmuir, Temkin, Hurkins-Jura, Halsay, Radlich-Peterson, Dubinin-Radushkevich, Jovanovic, and Brunauer Emmett Teller (BET) isotherm models. The kinetics of the adsorption technique was examined via pseudo- second order, Elovich mode and intraparticle diffusion methods. Thermodynamic parameters like change of free energy (ΔG°), change of enthalpy (ΔH°), and change of entropy (ΔS°) has been estimated. The value of regression coefficient (R2) indicates that Langmuir isotherm suitable to designate the process. The maximum adsorption capacity of monolayer is 204.11mg/g at 40°C. Based on the R2 value the adsorption mechanism was fitting to the pseudo-second order model. Thermodynamic factors obtained (ΔG° ranged from -4429.50 to -640.26 kJ/mol; ΔH° ranged from 5.38 to 12.84 kJ/mol; and ΔS° ranged from 19.82 to 50.23 J/K/mol, correspondingly) representing the Rh-B dye removal from artificial aquatic solutions by AHANC is there spontaneous, endothermic and possible in nature respectively. The outcomes point out that AHANC could be used as low-price and an effective adsorbent for the removal of Rh-B dye from artificial aqueous solution.
KEYWORDS:Activated Hygrophila auriculata activated nano carbon (AHANC); Adsorption isotherms; Equilibrium Kinetics; Rhodamine-B dye (Rh-B); Thermodynamic parameters
Download this article as:| Copy the following to cite this article: Ajithkumar M, Arivoli S. The Adosrption Study for the Removal of Rhodamine-B from Artificial Aquatic Solution by Using Activated Hygrophila Auriculata Nano Carbon. Orient J Chem 2022;38(1). |
| Copy the following to cite this URL: Ajithkumar M, Arivoli S. The Adosrption Study for the Removal of Rhodamine-B from Artificial Aquatic Solution by Using Activated Hygrophila Auriculata Nano Carbon. Orient J Chem 2022;38(1).Available from: https://bit.ly/3K36Uik |
Introduction
The industries have been growing tremendously over the past few years. The consequence is the release of wastewater from factories into the environment without treatment. Water resources are highly polluted due to such kind of wastewater. Metals and organic dyes are often the main causes of water pollution, and also it is impossible for the dyes to decompose very easily. Aquatic organisms and micro-organisms are also affected due to its adverse effects and thus human beings are pushed to the worst condition by the food chain. The removal of dyes is important for the wastewater treatment 1,2. The conventional techniques based on the biochemical, physical, and chemical properties which are employed to remove dyes from aqueous solution by process of adsorption, flocculation, chemical oxidation, reverse osmosis, chemical precipitation, photocatalytic degradation, ion exchange and membrane filtration. However, adsorption technology has much attraction for its advantages such as simplicity, eco-friendliness and recyclability of adsorbents. The activated carbons have been widely functional an adsorbents for removal of dyes due to its low cost and efficiency 3-5.
The review literature displays that not at all used activated Hygrophila auriculata nano carbon in place of an adsorbent to remove water pollutants from the artificial aqueous solution. Present work, adsorption of organic dye such as Rh-B dye into activated nano carbon prepared by carbonation of Hygrophila auriculata with sulfuric acid. The amount and rate of adsorption of Rh-B dye were measured using AHANC from the aqueous solution by batch method. The obtained equilibrium isotherms and kinetics of adsorption data were used to illustrate the efficiency of adsorbent.
Table 1: Nomenclature
|
% R |
-Percentage of removal of Rh-B (%) |
|
C0 |
– Initial concentration of Rh-B (mg/L) |
|
Ct |
-Concentration at time ‘t’ of Rh-B (mg/L) |
|
Ce |
-Equilibrium concentration of Rh-B (mg/L) |
|
qe |
-Quantity of adsorbed Rh-B at equilibrium (mg/L) |
|
-Volume of solution Rh-B (L) |
|
|
-AHANC weight (g) |
|
|
Kf |
-Adsorption capacity of Freundlich (L/mg) |
|
nF |
-Adsorption intensity of Freundlich |
|
qm |
-Maximum Rh-B removal (mg/g) |
|
KL |
-Adsorption capacity of Langmuir (L/mg) |
|
RL |
-Dimensionless constant Separation factor |
|
R |
-Gas constant of (8.314 J/K/mol) |
|
T |
-Temperature (K) |
|
bT |
-Connected to sorption heat (J/mol) |
|
KT |
-Temkin isotherm constant (L/g) |
|
BH & AH |
-Harkin Jura isotherm constants |
|
KHa & nHa |
-Halsey isotherm constants |
|
G |
-Radlich Peterson isotherm exponent |
|
KR |
-Redlich Peterson isotherm constant (L/g) |
|
qD |
-Dubinin-Radushkevich isotherm saturation capacity (mg/g) |
|
BD |
-Dubinin-Radushkevich isotherm constant (mol2/kJ2) |
|
-Potential of Polanyi (J/mol) |
|
|
qJ |
-Jovanovich maximum adsorbate uptake (mg/g) |
|
KJ |
-Jovanovich constant (L/g) |
|
CBET |
-Surface binding energy (L/mg) |
|
qs |
-BET isotherm saturation capacity theoretically (mg/g) |
|
Cs |
-Adsorbate monolayer saturation (mg/L) |
|
qt |
-Amount of adsorbed Rh-B at any time (mg/g) |
|
k2 |
-Pseudo-second order rate constant for adsorption (g/mg/min) |
|
T |
-Time (min) |
|
H |
-Pseudo second order initial adsorption rate (mg/g min) |
|
Α |
-Rate of initial adsorption (mg/g/min) |
|
Β |
-Elovich model constant (g/mg) |
|
R2 |
-Correlation co-efficient |
|
kid |
-Intra-particle diffusion rate constant (mg/g/min1/2) |
|
ɑ |
-Constant that depicts the adsorption mechanism |
|
Ko |
-Thermodynamic constant at equilibrium |
|
Csolid |
-Concentration at equilibrium for solid phase (mg/L) |
|
Cliquid |
-Concentration at equilibrium for liquid phase (mg/L) |
|
ΔH0 |
-Change in enthalpy (kJ/mol) |
|
ΔS0 |
-Change in entropy (J/mol/K) |
|
ΔG0 |
-Change in Gibbs free energy (kJ/mol) |
|
Ea |
-Energy of activation (KJ/mol) |
|
Θ |
-Surface coverage |
|
S* |
-Sticking probability |
Methodology
Rhodamine-B dye solution
Analytical grade (AR) chemicals are used on this experiment were obtained from Sree Sabari Scienntifics in Mayiladuthurai, Tamilnadu-606 001. The stock solution of Rh-B was made at 1000 ppm by stirring constantly at room temperature in order to liquefy the dye molecules completely using deionized water. The experimental solution was prepared by diluting the 1000 ppm solution to required concentration. The physicochemical properties of adsorbate (Rh-B) are listed in Table 2 (a).
Synthesis of AHANC
The Hygrophila auriculata is used as an adsorbent in this research work and it is collected from nearby Poompuhar, Mayiladuthurai, Tamilnadu – 609 107. The stem of Hygrophila auriculata is washed by purified water to eliminate mud also dust then dried using hot-air-oven at 110°C. Then, carbonization of the Hygrophila auriculata stem was adding w/v ratio Con. Sulfuric acid to get the primary carbon. In that point activated to 6 hours at 1000°C in muffle furnace in direction of obtain AHANC. The physico chemical properties of adsorbent (AHANC) are listed in Table 2(b).
Table 2: (a). Character table of Rh-B.
|
Name (IUPAC) |
[9-(2-carboxyphenyl)-6 -diethylamino-3-xanthenylidene]-diethylammonium chloride |
|
Another name |
Rhodamine-610 |
|
Dye type |
Cationic dye |
|
Chemical formula |
C28H31ClN2O3 |
|
Molar mass (g/mol) |
479.02 |
|
Appearance |
Red to violet powder |
Table 2: (b). Character table of AHANC
|
Name |
Activated Hygrophila auriculata Nano Carbon |
|
Diameter (nm) |
116.5 |
|
Surface Area (m²/g) |
90.067 |
|
Micropore volume (cc/g) |
0.257 |
|
Micropore area (m²/g) |
636.727 |
|
pHZPC |
6 |
Characterization performances
The particle diameter, surface area, micro pore volume, micro pore area, frequency of function groups, molecular arrangements, surface morphology and elemental compositions of the adsorbent was analysed by using the following instrumentations such as particle analyzer, Brunauer Emmett Teller (BET), Spectroscopy of Fourier Transform Infrared (FTIR), X-Ray Diffraction (XRD), Scanning Electron Microscope (SEM) with Energy Dispersive X-Ray (EDX).
Experimental procedure of batch adsorption
The adsorption experiments had been finished in a batch method [6] at 303, 313, 323 and 323K. The noted weight of AHANC was added into 50 mL of the experimental Rh-B solution with 25 ppm of initial concentration at known pH. The stuffing were shaken using a motorized shaker rotary with 120 rpm until equilibrium reached. Then the solution was filtered at fixed time and then measured the Rh-B concentration of tested solution using UV Visible spectrometer at 554 nm. An amount of adsorbed Rh-B as well as the removal percentage of Rh-B can be calculated as following relationships in equation 1 and 2.

Active parameters
Interactive time
The influence of interactive time 7 among the AHANC and adsorbate for to remove the Rh-B from artificial aquatic solution is determined by keeping origin dye concentration, adsorbent dose, pH, in addition temperature as constant using at different time intervals.
Dose of adsorbent
The different doses comprising of the AHANC respectively mixed with Rh-B solutions and the subjects are rotated in motorized shaker. The capacities of adsorption for different dose is determined at certain time intervals by keeping all other constraints are constant.
Origin pH
The experiment of adsorption process was carried out in between pH solutions of 3 and 9. Acidic and basic pHs of solution kept by adding the mandatory volume of dil. HCl and dil. NaOH solution. Even though factors of interactive time, adsorbent dose, temperature and Rh-B dye concentration were kept constant throughout the experiment.
Other ionic strength
Adsorption of Rh-B tested experimentally in the presence of chloride ion. This leads to resolve the percentage of Rh-B adsorbed from 25 ppm of origin concentration of Rh-B solution through changing concentration of the added chloride ion keeping all other factors are constant.
Adsorption isotherm
Adsorption isotherms [8] designate exactly how adsorbate molecules assign among the solid and aquatic phase at the minute of adsorption process which extends to an equilibrium state. Quite a lot of isotherms had been used in the adsorption study to define experimental information of adsorption isotherms. Designed at this study, the following isotherm models such as; Freundlich, Langmuir, Temkin, Hurkins-Jura, Halsay, Radlich-Peterson, Dubinin-Radushkevich, Jovanovic and Brunauer-Emmett-Teller isotherm. These equations of isotherm models are given in equation 3 to 11 respectively.

Kinetics studies
Kinetics is the most important physical characteristic in its efficiency of an adsorption machanism 9. Many parameters are generally well thought out in the study of adsorption process kinetics. Three recognized kinetic models, such as the pseudo-second order, Elovich, and intra-particle diffusion method are used to represent dynamic of adsorption mechanism. Equations for these operating models are given in equation 12 to 14.

Thermodynamics estimation
The state function of thermodynamics such as free energy change, enthalpy change and entropy change are significant pointers when evaluating the mechanisms of the adsorption mechanism [10]. Thermodynamic factors obtained using the given equations are 15 and 16.

Results and Discussions
BET, XRD, FTIR, SEM and EDX studies
Physical parameters such as particle size, area-surface, volume-pore and micropore area for adsorbent (AHANC) were determined using particle analyzer and BET (BJH) method and this data provided by Table 2(b). The XRD analysis of AHANC was shown in Figure 1(a), strong and weak peaks emerged at 2θ = 25 and 2θ = 40 respectively. This result indicates that the adsorbent structure nature for crystalline and bear a resemblance to the structure of graphite. The FT-IR model was an important tool to identify some significant frequencies of functional groups on the adsorbent, which are capable of adsorbing the adsorbate. The FTIR spectrometer was measured the wavenumber range 500 to 4000 cm-1 for AHANC and it’s shown in Figure 1(b). The peak frequency point; 2500 to 4000 cm-1 specifies single bond (Carbon-Hydrogen, Oxygen-Hydrogen, Nitrogen-Hydrogen), 2000 to 2500 cm-1 specifies triple bond (Carbon≡Carbon, Carbon≡Nitrogen), 1500 to 2000 cm-1 specifies double bond (Carbon=Carbon, Carbon=Nitrogen, Carbon=Oxygen) and 500 to 1500 cm-1 specifies the area of the fingerprint region. The SEM image is charity for the morphological analysis of AHANC and porous structure of AHANC of SEM image shown in Figure 1(c). The chemical composition of adsorbent was determined by EDX analysis, the EDX results shown as Figure 1(d) as well as data presented in Table 3.
Table 3: The EDX result of AHANC
|
Elements |
Mass( %) |
Atom(%) |
Errors(%) |
Kratio |
|
C K |
85.60 |
89.70 |
4.40 |
0.595 |
|
O K |
11.70 |
9.20 |
13.90 |
0.013 |
|
Mg K |
0.50 |
0.20 |
13.20 |
0.002 |
|
Al K |
0.40 |
0.20 |
13.20 |
0.002 |
|
Si K |
0.70 |
0.30 |
7.20 |
0.005 |
|
S K |
0.30 |
0.10 |
18.30 |
0.002 |
|
Cl K |
0.40 |
0.10 |
19.90 |
0.003 |
|
Ca K |
0.40 |
0.10 |
27.70 |
0.003 |
 |
Figure 1: (a) XRD of AHANC, (b) FTIR of AHANC, (c) SEM image of AHANC, and (d) EDX of AHANC |
Effect of active parameters
Influence of interactive time
Influence of interactive time 11 was examined at 25 ppm of Rh-B solution, 25 mg of AHANC dose, 303 K and known pH. As can be seen in Figure 2(a), while contact time was increases, the adsorption was not significantly increases. The removal of Rh-B occurred very hastily at the starting of the experiment duration of first 30 min, then marginal increases up to 60 min. The maximum removal of Rh-B onto AHANC was observed, it can be said that at beyond that there is almost no further increases in removal of the Rh-B in addition is therefore fixed because the equilibrium contact time and the equilibrium data have been presented in the Table 4.
Table 4: Equilibrium parameters for adsorption of Rh-B dye onto AHANC
|
C0 |
Ce |
qe |
%Removal |
|||||||||
|
303K |
313K |
323K |
333K |
303K |
313K |
323K |
333K |
303K |
313K |
323K |
333K |
|
|
25 |
5.25 |
4.94 |
4.21 |
4.20 |
39.50 |
40.13 |
41.57 |
41.60 |
79.00 |
80.26 |
83.15 |
83.20 |
|
50 |
13.65 |
12.60 |
11.59 |
9.45 |
72.70 |
74.79 |
76.81 |
81.09 |
72.70 |
74.79 |
76.81 |
81.09 |
|
75 |
25.29 |
22.89 |
19.95 |
18.48 |
99.43 |
104.21 |
110.10 |
113.03 |
66.28 |
69.47 |
73.40 |
75.35 |
|
100 |
36.84 |
33.69 |
31.96 |
29.97 |
126.32 |
132.62 |
136.09 |
140.05 |
63.16 |
66.31 |
68.04 |
70.03 |
|
125 |
54.60 |
52.71 |
51.54 |
48.48 |
140.80 |
144.59 |
146.91 |
153.04 |
56.32 |
57.84 |
58.77 |
61.21 |
Influence of adsorbent dose
This experiment was voted for out to observe the effect of AHANC dose on removal of Rh-B from aquatic solution. The result obtained as shown in Figure 2(b), this one can be realistic the elimination of the Rh-B increases by way of increasing AHANC dose as follows: 10, 25, 50, 100, 200, and 250 mg in 50 mL test solution AHANC, which is readily available and easily accessible to the Rh-B. The dye removal percentage increase was not significant when the AHANC dose increasing after 25 mg. At this point it was expected that concentrations of Rh-B on the surface of AHANC would be high. The AHANC dose of 25 mg was considered optimal for future studies and its corresponding efficiency of removal was found as 83%.
Influence of origin pH
The Rh-B solution pH has been widely used because of its essential parameter in the adsorption process. The functional groups of AHANC surface are control for the interaction between the Rh-B with AHANC. The adsorbent can be added H+ or added OH– to different charges surface in solution at various pH. Therefore, the effect of pH of origin solution was studied in the pH range of 3 to 9 on removal of Rh-B from the artificial aquatic solution. The percentage removal increased from about 46% to 83% while slowly decreasing after pH 6, which is pH-ZPC (zero point charge) shown in Figure 2(c). The pH-ZPC of AHANC is a very significant characteristic that controls the pH at surface has net neutral. At lower pH values (pH<pHzpc), the surface of AHANC can take on a positive charge, for that intention increases the adsorption of Rh-B due to the electrostatic force of an adsorbent as a support for maximum adsorbing Rh-B from the aquatic solution as resulting initial pH was optimized to pH 6.
Influence of other ionic strength
As shown in Figure 2(d), Rh-B adsorption onto AHANC is less when small amounts of NaCl solution are added. The influence of strength of ionic for adsorbing of Rh-B onto surface of AHANC was investigated in different concentrations of NaCl solution with 60 minutes of contact time, 25 mg adsorbent dose and 50 mL Rh-B solution with 25 ppm. If the electrostatic forces among the AHANC surface and Rh-B were striking, increases in the ionic strength would theoretically reduce the adsorption capacity, for this reason the competition of the dye molecules, Na+ and Cl- ions, investigational data commencing this work follow this agreement, as the removal of Rh-B onto AHANC decreased with the addition of NaCl solution12
 |
Figure 2: (a) Influence of interactive time on Rh-B removal, (b) Influence of adsorbent dose on Rh-B removal, (c) Influence of origin pH on Rh-B removal, and (d) Influence of other ionic strength on Rh-B removal |
Isotherm of Adsorption
The equilibrium of adsorption Rh-B could be quantified using recognized adsorption isotherms 13. The parameters achieved from the various isotherms; provided essential statistics about the adsorption mechanism of Rh-B in addition onto surface, properties and empathies of AHANC. The experimental data were tested with the Freundlich, Langmuir, Temkin, Hurkins- Jura, Halsay, Radlich-Peterson, Dubinin-Radushkevich, Jovanovic and Brunauer-Emmett-Teller isotherm; in addition, the plots were given in Figure 3(a-i), respectively. The isotherm parameters were given in Table 5 and regression coefficients is commonly used in determining the supreme of appropriate isotherm for removing Rh-B onto AHANC, at that point applicability of the isotherms is compared using the correlation coefficient rule. From this sustainability of the isotherms, the indispensable properties of Langmuir isotherm could be communicated with the method of the Dimensionless Separation Factor Constant (RL) by the equation 4(i).
Table 5: Parameter of Isotherms for adsorption of Rh-B onto AHANC
|
Model |
Constant |
T (K) |
|||
|
303 |
313 |
323 |
333 |
||
|
Freundlich |
Kf (mg/g) (L/mg)1/n |
16.36 |
17.32 |
20.71 |
21.75 |
|
nF |
1.80 |
1.79 |
1.90 |
1.87 |
|
|
R2 |
0.99 |
0.98 |
0.97 |
0.95 |
|
|
Langmuir |
qm (mg/g) |
199.51 |
204.11 |
195.66 |
203.37 |
|
KL (L/mg) |
0.04 |
0.05 |
0.06 |
0.07 |
|
|
R2 |
0.99 |
0.99 |
0.99 |
1.00 |
|
|
Temkin |
bT (J/mol) |
57.01 |
56.53 |
60.38 |
59.10 |
|
KT (L/mg) |
0.43 |
0.45 |
0.57 |
0.60 |
|
|
R2 |
0.99 |
0.99 |
0.98 |
0.99 |
|
|
Hurkins Jura |
AH (g2/L) |
-1733.07 |
-1803.66 |
-2042.39 |
-2105.27 |
|
BH (mg2/L) |
-1.67 |
-1.64 |
-1.62 |
-1.59 |
|
|
R2 |
0.86 |
0.84 |
0.84 |
0.77 |
|
|
Halsay |
KHa (mg/L) |
154.85 |
162.94 |
316.72 |
316.05 |
|
nHa |
1.80 |
1.79 |
1.90 |
1.87 |
|
|
R2 |
0.99 |
0.98 |
0.97 |
0.95 |
|
|
Radlich Peterson |
g |
0.45 |
0.44 |
0.47 |
0.46 |
|
KR (L/g) |
0.06 |
0.06 |
0.05 |
0.05 |
|
|
R2 |
0.99 |
0.97 |
0.97 |
0.94 |
|
|
Dubinin Radushkevich |
qD (mg/g) |
115.44 |
120.57 |
123.13 |
131.80 |
|
BD(mol2/kJ2) |
-5.79E-06 |
-4.98E-06 |
-3.45E-06 |
-3.44E-06 |
|
|
R2 |
0.86 |
0.87 |
0.86 |
0.92 |
|
|
Jovanovic |
KJ (L/g) |
0.02 |
0.02 |
0.02 |
0.03 |
|
qJ (mg/g) |
45.55 |
48.22 |
52.54 |
54.76 |
|
|
R2 |
0.83 |
0.79 |
0.75 |
0.72 |
|
|
BET |
CBET (L/mg) |
-13.65 |
-59.11 |
-33.84 |
15.80 |
|
qs (mg/g) |
36.65 |
45.31 |
49.48 |
65.80 |
|
|
R2 |
0.73 |
0.69 |
0.75 |
0.68 |
|
 |
Figure 3: Isotherm models for removal of Rh-B; (a) Freundlich, (b) Langmuir, (c) Temkin, (d) Hurkins-Jura, (e) Halsay, (f) Radlich-Peterson, (g) Dubinin-Radushkevich, (h) Jovanovic, and (i) Brunauer-Emmett-Teller (BET) |
The parameter RL indicates the dimensionless constant separation factor. RL > 1 stands negative adsorption; 0 < RL < 1 stands fortunate adsorption; RL = 0 stands irrevocable adsorption; RL = 1 stands in lines adsorption. The RL values in the middle of 0 to 1 indicate fortunate adsorption for all original concentration (Co) and temperature calculated. The deliberate RL values are specified in the Table 6.
Table 6: Rh-B adsorption onto AHANC of Dimensionless Separation Factor (RL)
|
C0 |
Temperature °C |
|||
|
303 K |
313 K |
323 K |
333 K |
|
|
25 |
0.48 |
0.45 |
0.39 |
0.37 |
|
50 |
0.31 |
0.29 |
0.24 |
0.23 |
|
75 |
0.23 |
0.22 |
0.18 |
0.17 |
|
100 |
0.19 |
0.17 |
0.14 |
0.13 |
|
125 |
0.15 |
0.14 |
0.11 |
0.11 |
Kinetics studies
Quite a lot of steps can be used to study the mechanisms of control the adsorption mechanism like diffusion mechanism, mass transmission and chemical reaction; the kinetic models [14] ware used to investigate data of Rh-B adsorption onto AHANC. The kinetics of Rh-B adsorption onto AHANC is essential to select ideal functioning circumstances for the large- scale batch adsorption. Kinetic factors, useful for the estimate of the adsorption rate, provide essential statistics for design with modeling Rh-B adsorption. As a result, adsorption kinetics Rh-B adsorption onto AHANC were investigated using plots of the pseudo-second order, Elovich model and intra-particle diffusion kinetic models shown as Figures4 (a-e), 5 (a-e), and 6 (a-e), correspondingly as a specific concentrations, and these data provided in Table 7.
Table 7: Kinetics factors for adsorbing Rh-B dye onto AHANC
|
C0 |
T (K) |
Pseudo-Second Order |
Elovich Model |
Intraparticle Diffusion |
|||||||
|
qe |
k2 |
R2 |
h |
a |
b |
R2 |
ɑ |
Kid |
R2 |
||
|
25 |
303 |
63.72 |
3.87E-04 |
0.95 |
1.57 |
3.19 |
6.84E-02 |
0.96 |
5.38E-01 |
8.45 |
0.99 |
|
313 |
59.38 |
5.24E-04 |
0.96 |
1.85 |
3.73 |
7.27E-02 |
0.96 |
4.80E-01 |
10.91 |
0.99 |
|
|
323 |
53.85 |
9.13E-04 |
0.98 |
2.65 |
5.94 |
8.52E-02 |
0.96 |
3.67E-01 |
17.98 |
0.98 |
|
|
333 |
53.78 |
9.21E-04 |
0.98 |
2.66 |
6.00 |
8.55E-02 |
0.96 |
3.65E-01 |
18.12 |
0.98 |
|
|
50 |
303 |
96.06 |
4.40E-04 |
0.94 |
4.06 |
9.07 |
4.77E-02 |
0.91 |
3.83E-01 |
14.30 |
0.95 |
|
313 |
94.83 |
5.42E-04 |
0.96 |
4.88 |
11.66 |
4.99E-02 |
0.93 |
3.45E-01 |
17.40 |
0.96 |
|
|
323 |
96.91 |
6.42E-04 |
0.98 |
6.03 |
14.74 |
4.93E-02 |
0.95 |
3.26E-01 |
20.34 |
0.96 |
|
|
333 |
93.25 |
8.68E-04 |
0.97 |
7.55 |
29.39 |
6.07E-02 |
0.88 |
2.47E-01 |
28.04 |
0.92 |
|
|
75 |
303 |
117.02 |
6.04E-04 |
0.96 |
8.28 |
30.30 |
4.75E-02 |
0.85 |
2.58E-01 |
21.72 |
0.89 |
|
313 |
124.13 |
6.76E-04 |
0.99 |
10.42 |
35.52 |
4.37E-02 |
0.94 |
2.60E-01 |
23.96 |
0.95 |
|
|
323 |
134.26 |
5.48E-04 |
0.99 |
9.87 |
27.28 |
3.75E-02 |
0.97 |
2.93E-01 |
22.15 |
0.98 |
|
|
333 |
129.51 |
8.97E-04 |
1.00 |
15.05 |
59.74 |
4.42E-02 |
0.99 |
2.34E-01 |
29.54 |
0.98 |
|
|
100 |
303 |
151.80 |
5.85E-04 |
1.00 |
13.47 |
34.56 |
3.24E-02 |
0.97 |
2.94E-01 |
19.68 |
0.96 |
|
313 |
158.03 |
5.58E-04 |
1.00 |
13.94 |
37.83 |
3.18E-02 |
0.99 |
2.87E-01 |
20.99 |
0.98 |
|
|
323 |
159.77 |
6.19E-04 |
1.00 |
15.80 |
46.92 |
3.26E-02 |
0.98 |
2.69E-01 |
23.23 |
0.97 |
|
|
333 |
163.43 |
6.32E-04 |
1.00 |
16.88 |
53.54 |
3.26E-02 |
0.98 |
2.60E-01 |
24.85 |
0.97 |
|
|
125 |
303 |
174.25 |
2.97E-04 |
0.93 |
9.00 |
22.52 |
2.77E-02 |
0.86 |
3.33E-01 |
13.40 |
0.91 |
|
313 |
178.51 |
2.96E-04 |
0.93 |
9.42 |
24.01 |
2.73E-02 |
0.86 |
3.28E-01 |
14.10 |
0.91 |
|
|
323 |
176.70 |
3.39E-04 |
0.94 |
10.60 |
30.33 |
2.89E-02 |
0.86 |
2.98E-01 |
16.21 |
0.90 |
|
|
333 |
185.12 |
3.07E-04 |
0.93 |
10.52 |
28.61 |
2.70E-02 |
0.84 |
3.10E-01 |
16.01 |
0.89 |
|
The correlation coefficients of pseudo-second order kinetic model were near to unity, leading to certainty of pseudo-second order model as long as a good correlation for the removal of Rh-B onto AHANC. The Elovich model indicate initial adsorption (α) increasing with temperatures, similarly to t the initial adsorption rate (h) in pseudo-second order kinetic model. This could be because of the boom with inside the pores or the energetic active Centre at the AHANC adsorbent
Then it is depend on the fact that rate controlling step could be intra-particle diffusion. Furthermost widely used method for ascertaining the mechanism intricate in adsorption mechanism is to use intra-particle diffusion model, which perform an vital role in adsorbing Rh-B to AHANC.
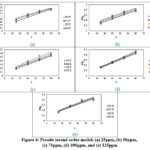 |
Figure 4: Pseudo second order model; (a) 25ppm, (b) 50ppm, (c) 75ppm, (d) 100ppm, and (e) 125ppm |
 |
Figure 5: Elovich model; (a) 25ppm, (b) 50ppm, (c) 75ppm, (d) 100ppm, and (e) 125ppm |
 |
Figure 6: Intra-particle diffusion model; 25ppm, (b) 50ppm, (c) 7ppm, (d) 100ppm, and (e) 125ppm |
Thermodynamic estimation
The thermodynamic parameters [15] relating to adsorption, through the standard Gibbs free energy change (∆G°), standard enthalpy change (∆H°) and standard entropy change (∆S°) were intended and specified in the Table 8. Datas of ΔS° and ΔH° could be achieved by the slope and intersection of a line graph between lnKo and 1/T shown in Figure 7(a). The ΔG° is negative values at different temperatures show the possibility of the process and the spontaneity of adsorption. The change of the enthalpy of adsorption for physisorption is between 20 and 40 (kJ mol1). The positive values of ΔH° reveal adsorption is endo-thermic as well as physical nature. In addition, the positive values of ΔS° specify to raise uncertainty of AHANC/Rh-B solution during adsorption.
Table 8: Adsorption of Rh-B dye onto AHANCof Thermodynamic Parameters
|
C0 |
∆Go |
DH° |
DS° |
Ea |
S* |
|||
|
303K |
313K |
323K |
333K |
|||||
|
10 |
-3337.68 |
-3650.02 |
-4286.65 |
-4429.50 |
8.58 |
39.32 |
6970.31 |
1.32E-02 |
|
20 |
-2467.39 |
-2829.88 |
-3216.37 |
-4031.55 |
12.84 |
50.23 |
9877.61 |
5.56E-03 |
|
30 |
-1702.95 |
-2140.06 |
-2725.70 |
-3094.11 |
12.74 |
47.67 |
9046.67 |
9.32E-03 |
|
40 |
-1358.23 |
-1762.24 |
-2029.64 |
-2349.10 |
8.46 |
32.51 |
5641.86 |
3.90E-02 |
|
50 |
-640.26 |
-822.37 |
-951.41 |
-1263.38 |
5.38 |
19.82 |
3162.62 |
1.25E-01 |
Were calculated the energy of activation (Ea) and the probability of adhesion (S*) by the graph between ln(1-Θ) and 1/T, it was shown in the Figure 7(b) also values given in Table 8,. Positive values of Ea designate adsorption was endo-thermic nature, the agreement through ΔH° positive values. The probability of sticking (S*) values are less than unity, which designate that the possibility of Rh-B ions onto AHANC surface was enormous as long S*<<<1 so, as these values authorize the sorption was physical adsorption.
 |
Figure 7: (a) Vant Hoff’s Plot, and (b) Plot of Activation energy (Ea) and Sticking probability(S*) |
Performance comparison
Table 9, summarizes the adsorption capacity, at an optimum volume and pH of the various adsorbents. In this present study, the high comparable capacity for Rh-B adsorption is 204.11 mg/g for AHANC. This maximum removal of Rh-B dye reflects the maximum superficial active site for adsorption matched with former adsorbent resources listed in Table 9.
Table 9: Assessment of different adsorbent adsorption capacities
|
S.No |
Adsorbent |
qm (mg/g) |
Reference |
|
1 |
-Ligno Sulfonate Fe3O4 Cr(VI) |
022.47 |
[16] |
|
2 |
-Furfural Residue (FR) |
037.93 |
[17] |
|
3 |
-ZIF – 67 / AC |
046.20 |
[18] |
|
4 |
-Polyamide Branches Grafted onto Carbon Microspheres |
019.90 |
[19] |
|
5 |
-NiO / SiO2 nanocomposites |
068.00 |
[20] |
|
6 |
–Activated Hygrophila auriculata nano carbon (AHANC) |
204.11 |
Present study |
Conclusion
Results of this research work; conventional the possibility, low cost, obtainability, ease of planning and eco-friendly nature of activated Hygrophila auriculata nano carbon (AHANC) as a promising and maintainable adsorbent for efficient Rh-B removal from aquatic solution. Adsorption was highly influenced through various effective factors, such as: interactive time, adsorbent dose, origin pH, and other ionic strength. The maximum adsorption percentage of Rh- B by AHANC was found as 83.20% at 0.025 g of AHANC stirred with 50 ml /25 ppm solution Rh-B dye solution about 60 minutes on pH 6. The adsorbent is investigated through particle analyzer, Brunauer-Emmett-Teller (BET), X-Ray diffraction (XRD), Spectroscopy of Fourier Transform Infrared (FTIR), and Scanning electron microscope (SEM) with Energy dispersive X- Ray (EDX) revealed important adsorption characteristics present in this low cost adsorbent. The isotherms of Freundlich, Langmuir, Temkin, Hurkins-Jura, Halsay, Radlich-Peterson, Dubinin-Radushkevich, Jovanovic, and Brunauer-Emmett-Teller were used in fitting equilibrium data. The isothermal data’s were fine fitted with the Langmuir isothermal with the maximum capacity of adsorption for the monolayer was originate as 204.11 mg/g, at 40°C. The pseudo-second order kinetics, Elovich equation and also intra-particle diffusion methods through kinetic studies displayed the datas are well explained by pseudo second order kinetics with a very good regression-coefficient close to 1 and mechanism of intra-particle diffusion involved rate controlling step of adsorption. The thermodynamic parameters are the negative value of ΔG° denotes the spontaneity of adsorption mechanism of Rh-B and ΔH° & ΔS° positive value displays endo-thermic character.
Acknowledgement
The authors earnestly thank to the Tamil Nadu Government Adi-Dravidar and Tribal Welfare Department for sanction Full Time Ph.D Scholars incentive Scheme.
Conflict Interest
The author declares that we have no conflict of interest.
Funding Sources
References
- Singh S.; Kumar A.; Gupta H.; Applied Water Science. 2020, 10(8), 185, 1-8.
CrossRef - Wong S.; Ghafar N.A.; Ngadi N.; Razmi F.A.; Inuwa I.M.; Mat R.; Amin N.A.S.; Scientific Reports. 2020, 10(1), 2928, 1-13.
CrossRef - Abdolrahimi N.; Tadjarodi A.; Proceedings. 2019, 41(1), 51, 1-4.
CrossRef - Jinendra U.; Bilehal D.; Nagabhushana B.M.; Kumar A.P.; Heliyon. 2021, 7(4), e06851, 1-9.
CrossRef - Bello O.S.; Alabi E.O.; Adegoke K.A.; Adegboyega S.A.; Inyinbor A.A.; Dada A.O.; Heliyon. 2020, 6(1), e02872, 1-13.
CrossRef - Li A.; Huang W.; Qiu N.; Mou F.; Wang F.; Materials Research Express. 2020, 7(5), 055505, 1-13.
CrossRef - Oyekanmi A.A.; Ahmad A.; Hossain K.; Rafatullah M.; PLoS ONE. 2019, 14(5), e0216878, 1-20.
CrossRef - Bello O.S.; Adegoke K.A.; Inyinbor A.A.; Dada A.O.; Water Environment Research. 2021, 93(10), 2308-2328.
CrossRef - Zhao Y.; Yang H.; Sun J.; Zhang Y.; Xia S.; ACS Omega. 2021, 6(26), 17086–17094.
CrossRef - Aslam Z.; Yousaf I.; Zahir A.; Akhtar A.; Turkish Journal of Chemistry. 2021, 45(4), 1189-1200.
CrossRef - Baddouh A.; Brahim E.I.; Elhassan A.; Mohamed M.R.; Lahcen B.; Hilali M.; Journal of Chemistry. 2019, Article ID: 1424797, 1-10.
CrossRef - Alakhras F.; Ouachtak H.; Alhajri E.; Rehman R.; Al-Mazaideh G.; Anastopoulos I.; Lima E.C.; Separation Science and Technology. 2021, 57(4), 542-554.
CrossRef - Du J.; Yang X.; Xiong H.; Dong Z.; Wang Z.; Chen Z.; Zhao L.; Journal of Chemical & Engineering Data. 2021, 66(3), 1264–1272.
CrossRef - Al-Gheethi A.A.; Azhar Q.M.; Senthil Kumar P.; Yusuf A.A.; Al-Buriahi A.K.; Radin Mohamed R.M.S.; Al-shaibani M.M.; Chemosphere. 2022, 287, 132080, 1-11.
CrossRef - Alhogbi B.G.; Altayeb S.; Bahaidarah E.A.; Zawrah M.F.; Processes. 2021, 9(3) 416, 1-20.
CrossRef - Geng J.; Gu F.; Chang J.M.; Journal of Hazardous Materials. 2019, 375, 174–181.
CrossRef - Chen X.; Li H.; Liu W.; Zhang X.; Wu Z.; Bi S.; Zhang W.; Zhan H.; Colloids and Surfaces A: Physicochemical and Engineering Aspects. 2019, 583, 123976, 1-9.
CrossRef - Li Y.; Yan X.; Hu X.; Feng R.; Zhou M.; Chemical Engineering Journal. 2019, 375, 122003, 1-7.
CrossRef - Saleh T.A.; Ali I.; Journal of Environmental Chemical Engineering. 2018, 6(4), 5361–5368.
CrossRef - Rubab R.; Ali S.; Rehman A.U.; Khan S.A.; Khan A.M.; Colloids and Surfaces A: Physicochemical and Engineering Aspects. 2021, 615, 126253, 1-10.
CrossRef

This work is licensed under a Creative Commons Attribution 4.0 International License.
About The Author
![]()
A New Edition of Web of Science
Journal Impact Factor
2022: 0.5
Five Year: 0.8
Journal is Indexed in

Cabells Whitelist
![]()


