Study of Seasonal, Spatial Deviation and Pollution Indices of Groundwater by Tannery Activities in Vaniyambadi, Vellore district, Tamilnadu, India.
S. Vasanthan1* , A. Murugesan2 and A. Selvam1
1Department of Chemistry, Panimalar Institute of Technology, Chennai, Tamilnadu, India.
2Department of Chemistry, Government Arts College, Ariyalur, Tamilnadu, India.
Corresponding Author E-mail: vasanthchem84@gmail.com
DOI : http://dx.doi.org/10.13005/ojc/380106
Article Received on : 01-Dec-2022
Article Accepted on : 15-Jan-2022
Article Published : 03 Feb 2022
Reviewed by: Dr. Vijay Bhamare
Second Review by: Dr Subhadra Rajpoot
Final Approval by: Dr. S. A. Iqbal
The purpose of this study was to investigate the physicochemical properties and the presence of heavy metals in groundwater samples. This study was carried out on the site of a tanneries of Vaniyambadi Taluk in the Vellore district. Evaluate the pollution index and risk assessment to assess the suitability of groundwater for human consumption. The information absorbed Physico-chemical properties and heavy metals like., Copper, Chromium, Lead, Zinc, Nickel, Aluminum, Cadmium contamination of groundwater samples. Flame AAS (Atomic Absorption Spectrometer) method used to assess the heavy metals concentration, The metal strength of groundwater in the area of the tanneries is rather high. As a result of the analysis, it was found that the chromium concentration was quite high in the groundwater samples from the tanneries, and the strengths of copper, chromium, lead, zinc, nickel, aluminum, and cadmium metals were also found slightly higher in groundwater in the tannery area. The calculated pollution indices, the Contamination Index (CI) and the Environmental risk Index (IER) for heavy metals, indicate that the majority of the groundwater samples studied are in severely contaminated areas. All physicochemical properties are within the normal range and metal contamination of groundwater is responsible for maintaining the harmfulness of crops and household needs.
KEYWORDS:Heavy Metals; Physico-Chemical Properties; Pollution Indices; Vaniyambadi; Vellore District
Download this article as:| Copy the following to cite this article: Vasanthan S, Murugesan A, Selvam A. Study of Seasonal, Spatial Deviation and Pollution Indices of Groundwater by Tannery Activities in Vaniyambadi, Vellore district, Tamilnadu, India. Orient J Chem 2022;38(1). |
| Copy the following to cite this URL: Vasanthan S, Murugesan A, Selvam A. Study of Seasonal, Spatial Deviation and Pollution Indices of Groundwater by Tannery Activities in Vaniyambadi, Vellore district, Tamilnadu, India. Orient J Chem 2022;38(1). Available from: https://bit.ly/3oozkuP |
Introduction
Ground water is the significant wellspring of water supply for household, water system and mechanical uses in Tamilnadu because of the regularly expanding interest to fulfill the necessities of a developing populace and close – add up to use of accessible surface water assets 1-3. Three fourths of the state is underlain by Achaean crystalline rocks, which form aquifers with limited groundwater prospects. Increased groundwater removal from these aquifers rather than recharge has resulted in overuse of groundwater resources in many areas of the state 4. In addition, pollution of groundwater resources by agricultural practices and industrialization also poses a serious constraint in several parts of the state for its sustainable development and management. Water because of extraordinary dissolvable power, is always compromised to get contaminated effectively. Contamination in wide sense alludes to any change which causes misbalance in the characteristic nature of the earth achieved through physical, synthetic or organic procedures 5,6.
Vellore area is comprehensively arranged into uneven territories and plain locales. For the most part sub– tropical atmosphere beats the locale. The ordinary normal yearly precipitation from four seasons is gotten. It is assumed that the quality of the water is determined by the results of tests of groundwater taken from wells in the Vellore region. Numerous tanneries located in the Vellore region have changed the water quality 7. In this way, it is fundamental to know the result of land manifestations and horticultural/mechanical exercises on groundwater science. Groundwater quality is the principle factor characterizing its propriety for utilization, household, cultivating and mechanical duties 8. The groundwater quality appraisal has been done by assessing the physico-chemical properties, for example, pH, Electrical conductivity, total dissolved salts, Total hardness, alkalinity, Calcium, Sodium, Magnesium, Potassium, Chloride, Nitrate, Nitrite. Barium, ammonia, heavy metals like Copper, Chromium, Lead, Zinc, Nickel, Aluminum, Cadmium. Natural contamination is a noteworthy risk to humankind in perspective of expanding industrialization, urbanization and populace development. Tanning industry has turned into a genuine ecological risk everywhere throughout the world [9 -10]. Ground water quality for the most part relies upon the land development of basic strata, the aquifers measure and the examining position. The sewage liquid and solid wastes hold significant amounts of chromium and added substantial harmful metals, natural issue, lime and sulfide 11,23. Other than the labourers, agriculturists, youngsters and angler are predominantly influenced by contaminated water. Industries in these area have a noteworthy impact in sullying 12. Three classifications of waste are discharged inside the leather business: wastewater (fluid), strong squanders (solids), and air emanations (vaporous). Information demonstrates that 50-150 liters of water is utilized for the transformation of 1 kg of crude skin into cowhide. After finish of the procedure, a similar amount is additionally depleted out 13 – 15. Tannery works in these towns are genuinely influenced from word related sicknesses, for example, diabetes, asthma, chromium ulcers and skin maladies because of delayed utilization of polluted water 16 – 20 . The convenient and spatial deviation of nature of the groundwater is assessed and the outcomes uncovers that the vast majority of the examples are observed to be not reasonable for local and water system purposes and post storm water tests were more debased than pre monsoon water tests. In light of these parameters, groundwater has been evaluated in not support of its appropriateness for drinking and water system reason.
Pollution Indices and Risk Assessment
The prominent contamination files in particular contamination index (CI) and list environmental risk (IER) used to survey the upgrade of substantial metals and the possibility of unfriendly bearing on condition because of high centralization of toxic metallic element. deliberate centralizations of distinct components also most extreme reasonable value established by BIS 2012 is used to ascertain the contamination records (pollution index and environmental risk index).
Contamination Index (CI)
Contamination Index is determined to survey the improvement of overwhelming metals in groundwater tests as for most extreme allowable points of confinement of BIS 2012 for discrete component utilizing
C.I = {(Cr ÷ 0.05) + (Cu ÷ 1.5) + (Zn ÷ 15) + (Fe ÷ 1.0) + (Cd ÷ 0.003) + (Ni ÷ 0.02) + (Mn ÷ 0.5) + (Pb ÷ 0.01) + (Al ÷ 0.2)} ÷ 7 Eq. (1).
where the contamination index value, and Cr, Pb, Zn, Cu, Fe, Cd, Ni, Mn and Al are the deliberate fixation at separately examining place isolated through most extreme admissible limit used for component. CI takes characterized to three classes in particular CI < 1 (not debased); CI 1-5 (marginally tainted) and CI > 5 (polluted).
Index of Environmental Risk (IER)
Index of Environmental Risk (IER) is a numerical esteem used to anticipate the likelihood of the event of the negative effect on condition by methods for explicit defilements (Rapant and Kordík, 2003). In the current examination, IER is determined to survey the extent of antagonistic effect of convergences of overwhelming metals on the water and to describe by and large pollution state in the Khetri copper mine area. IER for distinct groundwater test is determined through accompanying conditions (Eq. 2 and 3):
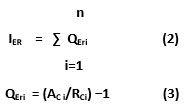
Where “IER” is the general record of natural danger of the example, QEri remains index of environmental risk quotient of the ith component, ACi stands deliberate convergence of the ith component and RCi is the greatest admissible focus limit (BIS, 2012) of ith component.
Experimental
Sample Collection and Processing
The ten water samples were collected close to tanning industrial areas of Vaniyambadi taluks in Vellore district. The sampling bottles remained saturated with 10% HCl for twenty-four hours, so totally clean and rinsed with water. Sampling bottles made of high-quality plastic bottle with 1 liter capacity rinsing with distilled water. groundwater samples were hold on at a pair of – 6°C temperature before analysis within the workplace.
Physico-chemical properties
The detailed procedures were implied by American Public Health Association [APHA]. Temperature was determined by Yokogawa TX 10-01 digital Thermometer. pH determined by electrometric technique by using Fisher brand – Hydrus 100 pH meter. Electrical Conductivity measured by Conductivity meter (Conductivity Meter: Model ELIC) , Turbidity was measured by using Turbidity meter -Nephelometer: Model CL 520 . Carbonate and bicarbonate determined by Acid – Base titration method using Phenolphthalein and Methyl Orange indicators, Total alkalinity measured by Potentiometric titration method. The concentration of NH3 was determined by using Flame Photometer: Model ELICO CL-378. TDS evaluated by Gravimetric technique. Chloride ion concentration measured by Argentometric method using Standard Silver nitrate link solution and Potassium chromate indicator, Sulphate (SO42-) measured by Colorimetric method using UV-Visible Spectrometer – Model:Specord-200/Plus , Nitrate (NO3–) was analyzed by Kjeldhal method using Kjeldhal (long neck flask) apparatus, Fluoride concentration was measured by Alizarin method. Calcium (Ca2+) and Magnesium (Mg2+) were determined by EDTA titration technique with Eriochrome Black-T (EBT) indicator and Ammonia Buffer.
Heavy Metal Analysis
Fe, Ni, Cr, Pb Zn, Cu, Mn, Al, Cd determined by spectrometric technique using Atomic Absorption Spectrometer – Model: PerkinElmer-Analyst -400. ABC Techno Labs Pvt. Ltd, SIDCO industrial estate, Ambattur, Chennai-600 098, Tamil Nadu. The obtained results were formulated, estimated and mentioned according to the values of ‘Indian standard drinking water specification IS 10500: 1992’ of Bureau of Indian Standards.
Result and Discussion
Table 1: Observed Physico – Chemical properties of ground water samples in Pre-Monsoon.
|
S.No |
Physico –chemicals |
VN-1 |
VN –2 |
VN –3 |
VN –4 |
VN–5 |
VN –6 |
VN–7 |
VN-8 |
VN-9 |
VN-10 |
|
1 |
pH |
7.98 |
8.05 |
6.95 |
6.51 |
6.94 |
8.02 |
6.72 |
7.28 |
7.21 |
8.28 |
|
2 |
EC |
1980 |
2056 |
1685 |
2408 |
2640 |
2010 |
2900 |
2385 |
2450 |
1546 |
|
3 |
Turbidity |
4.9 |
8.4 |
5 |
5.6 |
3.5 |
5.7 |
6.8 |
3.5 |
8.8 |
5.8 |
|
4 |
Alkalinity |
587 |
488 |
564 |
648 |
587 |
450 |
395 |
684 |
854 |
456 |
|
5 |
TDS |
1785 |
1258 |
1327 |
1175 |
1785 |
1647 |
1730 |
2340 |
1530 |
1254 |
|
6 |
Total Hardness |
485 |
387 |
284 |
365 |
485 |
320 |
256 |
510 |
356 |
258 |
|
7 |
Calcium |
315 |
286 |
186 |
232 |
315 |
456 |
254 |
315 |
304 |
369 |
|
8 |
Magnesium |
73 |
56 |
96 |
85 |
73 |
53 |
32 |
45 |
65 |
92 |
|
9 |
Sodium |
172 |
105 |
86 |
93 |
172 |
99 |
121 |
189 |
105 |
95 |
|
10 |
Potassium |
15.75 |
13.83 |
22.82 |
12.71 |
15.75 |
16.52 |
11.47 |
15.75 |
13.83 |
22.82 |
|
11 |
Barium |
9.32 |
11.54 |
13.52 |
18.26 |
9.32 |
9.57 |
7.83 |
8.54 |
11.62 |
13.52 |
|
12 |
Free NH3 |
0.29 |
0.32 |
0.24 |
0.35 |
0.29 |
0.86 |
0.38 |
0.09 |
0.25 |
0.65 |
|
13 |
Nitrate |
37.3 |
28.5 |
18.59 |
34.5 |
37.3 |
17.7 |
19.4 |
37.3 |
32.64 |
22.8 |
|
14 |
Chloride |
942 |
763 |
455 |
890 |
942 |
562 |
744 |
948 |
754 |
389 |
|
15 |
Fluoride |
0.78 |
0.73 |
0.56 |
0.65 |
0.78 |
0.85 |
0.67 |
0.59 |
0.56 |
0.98 |
|
16 |
Sulphate |
459 |
386 |
536 |
358 |
518 |
564 |
585 |
218 |
386 |
562 |
|
17 |
Phosphate |
0.452 |
0.112 |
0.387 |
0.215 |
0.459 |
0.148 |
0.348 |
0.459 |
0.204 |
0.387 |
Note : Unit of all parameters = mg/L, but unit for Electrical Conductivity – µmho/cm, Turbidity – NTU & for pH – No unit
Table 2: Observed Physico – Chemical properties of ground water samples during post-Monsoon
|
S.No |
Parameters |
PRE – MONSOON |
POST- MONSOON |
||||||
|
Min |
Max |
Mean |
Sd |
Min |
Max |
Mean |
Sd |
||
|
1. |
pH |
6.51 |
8.28 |
7.087 |
0.645 |
6.88 |
9.34 |
7.87 |
0.65 |
|
2. |
EC |
1544 |
2955 |
2323.66 |
426.67 |
1700 |
3100 |
2520.33 |
416.63 |
|
3. |
Turbidity |
3.5 |
9.2 |
5.8 |
1.8 |
2.8 |
10.6 |
5.447 |
2.464 |
|
4. |
Alkalinity |
395 |
854 |
547.57 |
111.71 |
328 |
787 |
480.57 |
111.71 |
|
5. |
TDS |
1175 |
2340 |
1574.85 |
305 |
937 |
1622 |
1336.85 |
305 |
|
6. |
Tot. Hardness |
256 |
564 |
380.38 |
91.91 |
210 |
518 |
334.38 |
91.91 |
|
7. |
Calcium |
186 |
568 |
334.61 |
86.94 |
139 |
520 |
287.61 |
86.79 |
|
8. |
Magnesium |
32 |
98 |
66.66 |
20.41 |
17.11 |
89.06 |
53.65 |
20.23 |
|
9. |
Sodium |
80.25 |
189 |
122.25 |
36.78 |
64 |
150 |
100.47 |
31.92 |
|
10 |
Potassium |
10.84 |
22.82 |
15.42 |
3.19 |
6.26 |
18.55 |
10.90 |
3.29 |
|
11 |
Barium |
7.83 |
18.26 |
11.11 |
2.92 |
4.65 |
15.08 |
7.89 |
2.907 |
|
12 |
Free NH3 |
0.09 |
0.86 |
0.323 |
0.106 |
0.08 |
0.51 |
0.194 |
0.092 |
|
13 |
Nitrate (NO3) |
12.56 |
37.3 |
27.13 |
8.29 |
8.18 |
32.92 |
22.755 |
8.295 |
|
14 |
Chloride |
389 |
948 |
749.85 |
181.26 |
345 |
893 |
698.76 |
178.75 |
|
15 |
Fluoride |
0.35 |
0.98 |
0.685 |
0.151 |
0.18 |
0.81 |
0.514 |
0.16 |
|
16 |
Sulphate |
218 |
652 |
452 |
123.98 |
164 |
595 |
394.38 |
122.9 |
|
17 |
Phosphate |
0.112 |
0.702 |
0.357 |
0.151 |
0.088 |
0.556 |
0.262 |
0.144 |
Note : Unit for all mg/Kg except pH
 |
Figure 1: Comparison of Physico chemical parameters of groundwater in both monsoon |
Hydrogen Ion Concentration (pH)
We observed that the pH estimation of water tests in the Vaniyambadi territory is inside as far as possible ran from 6.51 to 8.28 in the Pre monsoon and 6.88 to 9.35 in the post monsoon seasons portrayed by somewhat acidic to marginally soluble.
Electrical Conductivity (EC)
In the Vaniyambadi taluk examine region, the estimation of conductivity extended between 1544 µScm-1 to 2955 µScm-1 in the Pre monsoon and 1700 µScm-1 to 3100 µScm-1 in the Post monsoon seasons in groundwater
Turbidity
We observed that shifted from 3.5 to 9.2 NTU in the Pre monsoon and 2.8 to 10.6 NTU in the Post monsoon seasons Vaniyambadi taluk ponder zone
Total Alkalinity
In the Vaniyambadi taluk-ponder region, we observed that the range of increase in alkalinity of the groundwater test increased during the monsoon period from 395 mg/L to 854 mg/L and from 328 mg/L to 787 mg/L. in the post-monsoon period.
Total Dissolved Solids (TDS)
TDS fixation in a large portion of the groundwater tests at Vaniyambadi territory are surpasses the alluring furthest reaches of 500 mg/L and up to 1500 mg/L is most extreme allowable limit. It fluctuated from extended from 1175 mg/L to 2340 mg/L in the Pre monsoon and 937 mg/L to 1622 mg/L in the Post monsoon.
Total Hardness (TH)
In Vaniyambadi taluk the aggregate hardness was found in the examples was gone from 256 mg/L to 564 mg/L in the Pre monsoon and 210 mg/L to 518 mg/L in the Post monsoon in ground water
Calcium (Ca2+)
In the Vaniyambadi taluk contemplate territory, we observed that convergence of Calcium in the ground water are differed from 186 mg/L to 568 mg/L in monsoon and 139 mg/L to 520 mg/L in the Post monsoon which demonstrates all groundwater tests of the examination region surpasses the attractive furthest reaches of 75 – 200 mg/L
Magnesium (Mg2+)
In the Vaniyambadi taluk examine territory, we observed that centralization of Magnesium in the ground water are differed from changed from 32.0 mg/L to 98.0 mg/L in monsoon and 17.11 mg/L to 89.06 mg/L in the Post monsoon which demonstrates all the groundwater tests of the investigation region not surpassed the attractive furthest reaches of 30 – 100 mg/L
Sodium (Na+)
In the Vaniyambadi examine zone the we observed that grouping of Sodium in the ground changed from fluctuated from 80.25 mg/L to 189 mg/L in Pre monsoon and 64 mg/L to 150 mg/L in the Post monsoon which demonstrates all the groundwater tests of the investigation region not surpassed the attractive furthest reaches of Sodium is 50 – 200 mg/L
Potassium (K+)
In the Vaniyambadi examine region the we observed that grouping of Potassium in the ground shifted from changed from 10.84 mg/L to 22.84 mg/L in monsoon and 6.26 mg/L to 18.55 mg/L in the Post monsoon which demonstrates all the groundwater tests of the investigation region not surpassed the attractive furthest reaches of Potassium is 50 – 200 mg/L
Barium (Ba2+)
In the Vaniyambadi think about region the we observed that convergence of Barium in the ground changed from fluctuated from 7.83 mg/L to 18.26 mg/L in the Pre monsoon and 4.65 mg/L to 717 mg/L in the Post monsoon which demonstrates all the groundwater tests of the investigation zone not surpassed the alluring furthest reaches of Barium is 50 – 200 mg/L
Free Ammonia (NH3)
The admissible furthest reaches of Ammonia is 10 mg/L. In the investigation zone we observed that convergence of Ammonia in ground water at Vaniyambadi taluk shifted from differed from 0.09 mg/L to 0.86 mg/L in the Pre monsoon and 0.08 mg/L to 0.51 mg/L in the Post monsoon. The allowable furthest reaches of Ammonia is 10 mg/L. Demonstrating that all examples not surpassed as far as possible (10 mg/L).
Nitrate
In the examination territory, we observed that convergence of Nitrate in ground water at Vaniyambadi taluk fluctuated from differed from 12.56 mg/L to 37.3 mg/L in the Pre monsoon and 8.18 mg/L to 32.92 mg/L in the Post monsoon. The allowable furthest reaches of Nitrate are 100 mg/L. Demonstrating that all examples not surpassed as far as possible (100 mg/L).
Chloride (Cl–)
The chloride fixation in the Vaniyambadi examine territory fluctuated from 389 mg/L to 948 mg/L in monsoon and 345 mg/L to 893 mg/L in the Post monsoon (Table 5.3 and Fig 5.3). High grouping of CI may damage to a few people experiencing infections of the heart and kidney, taste, acid reflux; consumption and acceptability are influenced. Chloride Plays a vital job in adjusting dimension of electrolytes in blood plasma, yet higher focus can create hypertension danger of stork, left ventricular hypertrophy, osteoporosis, rental and asthma 21-22.
Fluoride
In the investigation zone of Vaniyambadi taluk, we observed that centralization of Fluoride esteems differed from 0.35 mg/L to 0.98 mg/L in the Pre monsoon and 0.18 mg/L to 0.81 mg/L in the Post monsoon (Table 5.3 and Fig 5.3). The passable furthest reaches of fluoride in drinking water are 0.6 – 1.2 mg/L as indicated by bureau of Indian standard (BIS). Demonstrating that the vast majority of the example beneath as far as possible.
Sulphate (SO42-)
In the investigation region of Vaniyambadi taluk, we observed that convergence of Sulphate in ground water at Ambur taluk differed from 380 mg/L to 784 mg/L in the Pre monsoon and 313 mg/L to 717 mg/L in the Post monsoon. Demonstrating that the vast majority of the examples over as far as possible (400 mg/L).
Phosphate (PO42-)
We observed that grouping of Phosphate in ground water at Vaniyambadi taluk changed from 0.112 mg/L to 0.702 mg/L in the Pre monsoon and 0.088 mg/L to 0.556 mg/L in the Post monsoon. We found that Phosphate fixation isn’t higher in the majority of the examples at Vaniyambadi taluk.
Table 4: Observed heavy metal concentration in groundwater samples during Pre-Monsoon.
|
S.No |
Heavy metals |
BIS Limits |
VN-1 |
VN-2 |
VN-3 |
VN-4 |
VN-5 |
VN-6 |
VN-7 |
VN-8 |
VN-9 |
VN-10 |
|
1. |
Chromium |
0.05 |
1.022 |
0.931 |
0.838 |
0.408 |
1.182 |
0.284 |
0.605 |
0.584 |
0.826 |
0.734 |
|
2. |
Lead |
0.01 |
0.318 |
0.252 |
0.302 |
0.168 |
0.224 |
0.169 |
0.411 |
0.115 |
0.32 |
0.422 |
|
3. |
Zinc |
5 – 15 |
5.38 |
10.05 |
16.42 |
10.08 |
14.43 |
9.24 |
8.66 |
9.38 |
13.56 |
10.38 |
|
4. |
Iron |
0.3-1.0 |
1.21 |
1.34 |
1.28 |
1.65 |
2.16 |
1.58 |
2.08 |
1.21 |
1.34 |
1.28 |
|
5. |
Manganese |
0.1 – 0.5 |
0.192 |
0.422 |
0.441 |
0.185 |
0.474 |
0.189 |
0.472 |
0.192 |
0.422 |
0.441 |
|
6. |
Nickel |
0.02 |
0.024 |
0.057 |
0.034 |
0.094 |
0.112 |
0.056 |
0.072 |
0.062 |
0.038 |
0.045 |
|
7. |
Aluminium |
0.03 – 0.2 |
0.275 |
0.828 |
0.542 |
0.634 |
0.967 |
0.952 |
0.556 |
0.464 |
0.524 |
0.342 |
|
8. |
Cadmium |
0.003 |
0.008 |
0.008 |
0.003 |
0.008 |
0.009 |
0.008 |
0.007 |
0.004 |
0.005 |
0.006 |
|
9. |
Copper |
0.05 – 1.5 |
5.45 |
7.84 |
3.58 |
4.32 |
6.56 |
5.54 |
8.55 |
5.28 |
4.32 |
6.02 |
Note: Unit of all heavy metal concentration – mg/L
Table 5: Observed heavy metal concentration in groundwater samples during Post-Monsoon.
|
S.No |
Heavy metals |
BIS Limits |
VN-1 |
VN-2 |
VN-3 |
VN-4 |
VN-5 |
VN-6 |
VN-7 |
VN-8 |
VN-9 |
VN-10 |
|
1. |
Chromium |
0.05 |
0.995 |
0.604 |
0.511 |
0.081 |
0.855 |
0.122 |
0.278 |
0.584 |
0.826 |
0.734 |
|
2. |
Lead |
0.01 |
0.285 |
0.094 |
0.269 |
0.135 |
0.191 |
0.136 |
0.068 |
0.115 |
0.32 |
0.422 |
|
3. |
Zinc |
5 – 15 |
2.99 |
7.66 |
14.03 |
7.69 |
12.04 |
6.85 |
6.27 |
9.38 |
13.56 |
10.38 |
|
4. |
Iron |
0.3-1.0 |
1.145 |
0.782 |
1.219 |
1.584 |
0.586 |
1.512 |
2.014 |
1.210 |
1.340 |
0.858 |
|
5. |
Manganese |
0.1 – 0.5 |
0.147 |
0.377 |
0.396 |
0.14 |
0.429 |
0.144 |
0.427 |
0.192 |
0.422 |
0.441 |
|
6. |
Nickel |
0.02 |
0.004 |
0.037 |
0.014 |
0.074 |
0.092 |
0.038 |
0.052 |
0.064 |
0.038 |
0.046 |
|
7. |
Aluminium |
0.03 – 0.2 |
0.104 |
0.783 |
0.497 |
0.589 |
0.922 |
0.907 |
0.516 |
0.464 |
0.524 |
0.342 |
|
8. |
Cadmium |
0.003 |
0.006 |
0.004 |
0.006 |
0.007 |
0.008 |
0.007 |
0.009 |
0.004 |
0.005 |
0.006 |
|
9. |
Copper |
0.05 – 1.5 |
4.28 |
6.67 |
2.41 |
3.15 |
5.39 |
8.26 |
7.38 |
5.28 |
4.32 |
6.02 |
Table 6: Statistical description of heavy metal concentration in groundwater samples in both monsoon.
|
S.No |
Heavy metals |
PRE – MONSOON (N = 10) |
POST – MONSOON (N= 10) |
||||||
|
Min |
Max |
MEAN |
SD |
Min |
Max |
MEAN |
Sd |
||
|
1 |
Chromium |
0.284 |
1.46 |
0.776 |
0.295 |
0.081 |
1.46 |
0.648 |
0.35 |
|
2 |
Lead |
0.032 |
0.422 |
0.205 |
0.119 |
0.032 |
0.422 |
0.173 |
0.111 |
|
3 |
Cadmium |
5.26 |
16.42 |
10.54 |
2.828 |
2.99 |
14.16 |
9.747 |
3.027 |
|
4 |
Iron |
0.76 |
2.16 |
1.379 |
0.373 |
0.586 |
2.014 |
1.226 |
0.413 |
|
5 |
Manganese |
0.185 |
1.182 |
0.449 |
0.236 |
0.14 |
1.182 |
0.434 |
0.244 |
|
6 |
Nickel |
0.018 |
0.678 |
0.088 |
0.134 |
0.004 |
0.678 |
0.0827 |
0.135 |
|
7 |
Copper |
0.246 |
0.967 |
0.588 |
0.195 |
0.104 |
0.922 |
0.567 |
0.202 |
|
8 |
Zinc |
0.003 |
0.009 |
0.0059 |
0.0019 |
0.003 |
0.009 |
0.0057 |
0.0016 |
|
9 |
Aluminium |
2.46 |
8.55 |
4.896 |
1.681 |
1.86 |
8.52 |
4.823 |
1.982 |
 |
Figure 2: Comparison of heavy metal concentration of groundwater in both season |
Analysis of pollution using Contamination Index(CI) in Vaniyambadi region
 |
Figure 3: Comparison of contamination index during in both season |
Table 7: Analysis of pollution using Index of Environmental Risk(IER) in Vaniyambadi region
|
Sample Code |
Sample Location |
Pre monsoon(IER) |
Post Monsoon(IER) |
|
Vnb-W1 |
Vaniyambadi Urban |
54.07 |
46.61 |
|
Vnb-W2 |
Agaramcherri |
52.56 |
26.07 |
|
Vnb-W3 |
Alangayam |
49.01 |
37.86 |
|
Vnb-W4 |
Amburpettai |
32.07 |
19.58 |
|
Vnb-W5 |
Devalapuram |
58.92 |
44.92 |
|
Vnb-W6 |
Muslimpur |
30.07 |
23.57 |
|
Vnb-W7 |
Noorullahpet |
62.21 |
19.75 |
|
Vnb-W8 |
Periavarikkam |
26.67 |
26.77 |
|
Vnb-W9 |
Perumalpet |
51.67 |
51.67 |
|
Vnb-W10 |
Perumapattu |
60.71 |
60.34 |
 |
Figure 4: Comparison of index of Environment risk in in both season |
Table 8: Correlation coefficient of heavy metals in both season.
|
Pre monsoon |
|||||||||||
|
|
pH |
EC |
Cr |
Pb |
Zn |
Fe |
Mn |
Ni |
Al |
Cd |
Cu |
|
pH |
1 |
-0.672 |
-0.165 |
0.166 |
-0.282 |
-0.225 |
-0.025 |
-0.122 |
-0.201 |
0.062 |
0.415 |
|
EC |
|
1 |
0.126 |
0.015 |
-0.019 |
0.400 |
-0.153 |
0.201 |
0.253 |
0.325 |
-0.159 |
|
Cr |
|
|
1 |
0.112 |
0.031 |
-0.045 |
0.028 |
0.015 |
0.062 |
0.282 |
0.308 |
|
Pb |
|
|
|
1 |
0.031 |
0.033 |
-0.261 |
-0.235 |
-0.119 |
0.294 |
0.101 |
|
Zn |
|
|
|
|
1 |
-0.045 |
0.063 |
0.011 |
0.145 |
-0.245 |
-0.225 |
|
Fe |
|
|
|
|
|
1 |
0.028 |
0.336 |
0.267 |
0.428 |
0.519 |
|
Mn |
|
|
|
|
|
|
1 |
0.015 |
-0.343 |
-0.149 |
0.078 |
|
Ni |
|
|
|
|
|
|
|
1 |
0.062 |
-0.220 |
0.160 |
|
Al |
|
|
|
|
|
|
|
|
1 |
0.282 |
0.029 |
|
Cd |
|
|
|
|
|
|
|
|
|
1 |
0.308 |
|
Cu |
|
|
|
|
|
|
|
|
|
|
1 |
|
Post Monsoon |
|||||||||||
|
pH |
1 |
-0.714 |
-0.174 |
-0.037 |
-0.438 |
-0.425 |
0.104 |
-0.168 |
0.037 |
0.057 |
0.083 |
|
EC |
|
1 |
0.461 |
0.114 |
0.361 |
0.171 |
-0.097 |
0.349 |
-0.150 |
-0.067 |
-0.043 |
|
Cr |
|
|
1 |
-0.282 |
-0.027 |
0.191 |
0.029 |
0.013 |
0.538 |
-0.116 |
-0.138 |
|
Pb |
|
|
|
1 |
-0.027 |
-0.093 |
-0.230 |
-0.364 |
-0.263 |
-0.099 |
-0.327 |
|
Zn |
|
|
|
|
1 |
0.191 |
-0.323 |
-0.210 |
-0.473 |
0.200 |
-0.437 |
|
Fe |
|
|
|
|
|
1 |
0.029 |
-0.058 |
-0.189 |
-0.197 |
-0.020 |
|
Mn |
|
|
|
|
|
|
1 |
0.0134 |
-0.1069 |
-0.016 |
0.3104 |
|
Ni |
|
|
|
|
|
|
|
1 |
0.538 |
0.011 |
0.269 |
|
Al |
|
|
|
|
|
|
|
|
1 |
-0.116 |
0.449 |
|
Cd |
|
|
|
|
|
|
|
|
|
1 |
-0.138 |
|
Cu |
|
|
|
|
|
|
|
|
|
|
1 |
Table 9: The number of ground water sample falling in different risk range
|
IER values |
Risk magnitude |
Sample within the range of IER value (n=21) |
|
0 |
No risk |
_ |
|
≤ 1 |
Very Low risk |
_ |
|
≤ 3 |
Low risk |
_ |
|
≤ 5 |
medium risk |
_ |
|
≤ 10 |
high risk |
_ |
|
≤ 15 |
Very high risk |
_ |
|
≥ 15 |
Extreely high risk |
Vn-1, Vn-2, Vn-3, Vn-4, Vn-5, Vn-6, Vn-W7, Vn-8, Vn-9, Vn-10, Vn-11, Vn-12, Vn-13, Vn-14, Vn-15. |
Pollution Indices and Risk Assessment
The wealth and appropriation of heavy metals alone are not adequate to survey their conceivable ecological effects; in this manner distinctive kinds of contamination records were determined to evaluate the heavy metal contamination status of groundwater. The contamination dimension of groundwater tests is ordered into various classes based on scales given in writing which gives more insights concerning the status of contamination. All the considered examples of Vaniyambadi area are in the profoundly sullying reach (≥ 15). Consequently, the two periods of test locales are very defiled based on determined CI esteems. Regarding IER values the water quality is exceptionally debased (≥15) for every one of the examples. The subtleties of the examples falling in various classes of natural hazard are given in Table 8. The most astounding IER values 62.21 and 60.71 are found at Noorullahpet Village and Ammur Perumapattu separately and mutually reduction in the amazingly high hazard (≥15) zone.
Conclusion
The grouping of various particles in groundwater tests was studied by the Bureau of India Standards (BIS), with a few examples being exceeded as much as possible. It has been discovered that groundwater in our examination region is unfit for local utilization dependent on the significant particle and follow investigation did in this examination. We observed that all the ground water tests collected in the Vaniyambadi taluks of Vellore locale were clear with no noticeable shading, smell and turbidity. The heavy metal (Cr, Pb, Zn, Fe, Mn, Ni, Al, Cd, and Cu) focuses information on groundwater tests for both pre and post monsoon from the Vaniyambadi locale demonstrates that their plenitudes in lion’s share of the examples exceeds as far as possible set by BIS, 2012. However, Cr is found in a lot higher fixation (pre and post monsoon separately) and exceeds as far as possible (BIS) in every one of the examples in both the seasons, which is because of draining of chromium-rich sulphides. What’s more, Cr is added versatile in groundwater in respect to Cu because of high affectability to oxidation-reduction conditions. The connection framework demonstrates an anthropogenic source for Cu, Ni and Mn in the groundwater of the zone. Absence of relationship among’s Cr and heavy metals is because of event of Cr as Sulphide, anyhow sulphides and additionally its high affectability to evolving condition. pH indicates remarkable negative relationship with Cr, Fe, Ni and Cu and confirms the diminishing in pH of water with the pollution, while EC does not demonstrate any solid connection with the heavy metal as EC remains for the most part controlled by the significant particle science. The determined contamination records in particular CI and IER show that a large portion of the considered groundwater tests are in the very polluted zone and to a great degree hazard zone (>15).
Acknowledgement
I wish to thank Dr.A.Murugesan, Management, Principal and Department Head who permitted and supported me to carry out my investigation in the chemistry laboratory and also express my sincere thanks to Faculty members of chemistry department for their valuable support.
Conflict of Interest
The Authors declare that they have no conflict of interest.
Funding Sources
There is no funding source
References
- Boakye, E. S.; N. Odai, K. A.; Adjei, F. O. Euro. J. Sci. Res., 2008, 21(4), 617-626.
- Saravanakumar, K.; Ranjith Kumar, R. Ind. J. Sci. Tec., 2011, 5, 660-662.
CrossRef - Ramesh, K.; Seetha, K., Int. J. Res. Chem. Envi., 2013, 3, 36-47.
- Pranavam, T. S., Dhiviyaa, T.; Venkatesa Rao, L.; Punithavathi, S.; Karunanithi, Bhaskaran, A Ind. J. Sci. Tech., 2011, 4(1), 9-21.
- Cruz, A. G.; R. N. Cavalcanti, L.; M. R. Guerreiro, A. S.; Sant’Ana, L. C.; Nogueira, C. A. F.; Oliveira, R.; Deliza, R. L.; Cunha, J. A. F.; Faria, H. Bolini, B. M. J. food Eng., 2013, 114(3), 323-330.
CrossRef - Waldmann,; Thomas,; Amaia Iturrondobeitia,; Michael Kasper,; Niloofar Ghanbari,; Frédéric Aguesse,; Emilie Bekaert,; Lise Daniel et al., J. Elec. Soc., 2016, 163(10), 2149-2164.
CrossRef - Vennila, G.T.; Subramani, L., Elango., Int. Quarterly. Sci. J., 2008, 7(4), 585-592.
- Mondal, N. C.; Singh, V. P., J. Hydro. 2011, 405(3-4), 235-247.
CrossRef - S.R. Tariq, M.H.; Shah, N.; Shaheen, A.; Khalique, S.; Manzoor, Jaffar, M. J. Hazad. Mat. 2005, 122, 17-22.
CrossRef - Fitzgerald, W.F. Intern. Conf. Heavy Metals Environ. Toronto, CEP, Edinburgh, 1993, 320.
- Geier, A.; Leather Shoes.; Kanerva, A. Handbook of Occupational Dermatology. Springer, Heidelberg, Germany, 2004, 637-643.
CrossRef - Pruett, S. B.; Myers, L. P.; Keil, D.E. J Toxicol Environ Health B Crit Rev. 2001, 4(2), 207–222.
CrossRef - Davis, M.D.; Wang, M. Z.; Yiannias, J. A.; Keeling, J. H., et al, Mayo clinic. Dermatitis 2001, 22, 256-271.
CrossRef - Gentiana Shegani. Int. J.Sci. Basic and App. Res. 2014,14(1), 115-124.
- Gilcreas, F. W. Am J Public Health Nations Health. 1966, 56(3):387-88.
CrossRef - Hilbert, M.S. Am J Public Health Nations Health. 1967, 57(2), 275-280.
- BIS, Indian standard for drinking water specification – 10500. Bureau of Indian Standards, New Delhi., 1992.
CrossRef - Berrow, M.L.; Mitchell, R.L. Trans. R. Soc. Edinburgh: Ear. Sci., 1993, 17, 103-121.
- Buckley, D.E.; Cranston, R.E.; Chem. Geol. 1971, 7,273-284.
- Tiwari T. N.; Mishra M. A.; Indian J. Environ Prot., 1985, 5, 276-279.
CrossRef - Upadhyay, A. Int. J. Inn. Res. Sci. Eng. Tech., 2014, 3(9), 15986-15990.
CrossRef - Kistan, A.; Kanchana. V.; Geetha, N K. Orient. J. Chem., 2021. 37(3), 735-745.
CrossRef

This work is licensed under a Creative Commons Attribution 4.0 International License.
About The Author
![]()
A New Edition of Web of Science
Journal Impact Factor
2022: 0.5
Five Year: 0.8
Journal is Indexed in

Cabells Whitelist
![]()


