Sol Gel Synthesis and Characterization of Strontium Titanates
Ramanjeet Kaur1* and Anand K Tyagi2
1Department of Applied Sciences, SBSSTC, I. K. Gujral Punjab Technical University, Kapurthala, 144603 (Punjab) India.
2Mahatma Gandhi Kashi Vidyapith,Varanasi (UP) India.
Corresponding Author E-mail: ramanjeetgill99@gmail.com
DOI : http://dx.doi.org/10.13005/ojc/380111
Article Received on : 05-01-2022
Article Accepted on :
Article Published : 22 Jan 2022
Reviewed by: Dr. Richa Kamboj
Second Review by: Dr. Mohsen Mhadhbi
Final Approval by: Dr. Pounraj Thanasekaran
Pure strontium titanates have been successfully fabricated in this work via sol gel route. The obtained powders were calcined at various temperatures and effects of calcination and sintering on phase development, crystallite size, lattice parameters, microstructure etc. were investigated by XRD and SEM techniques. The development of phase with temperature has been investigated using DTA/TG technique. The dielectric and electrical parameters were analyzed and effects of temperature and frequency variation on these parameters were studied.
KEYWORDS:Characterization; Sol Gel; Synthesis; Strontium Titanates
Download this article as:| Copy the following to cite this article: Kaur R, Tyagi A. K. Sol Gel Synthesis and Characterization of Strontium Titanates . Orient J Chem 2022;38(1). |
| Copy the following to cite this URL: Kaur R, Tyagi A. K. Sol Gel Synthesis and Characterization of Strontium Titanates . Orient J Chem 2022;38(1). Available from: https://bit.ly/35etQfy |
Introduction
Various types of materials have been investigated by different research groups as anode, cathode and electrolyte materials. From these, the oxides with perovskite structure draw considerable attention owing to their stability in reducing atmospheres, capability to withstand the sulfur contamination and carbon deposition etc. during SOFCs operation. Strontium titanates, lanthanum chromites and their doped forms are the emerging perovskite structured oxides that had been widely studied. Strontium titanate, both in pure and derived forms, is growing candidate as SOFC material as it offers many advantages over other materials like high stability in oxygen, carbon, and sulfur containing atmospheres 1-3, remarkably active for methane (CH4) oxidation at high temperature in the absence of excess steam 3, high conductivity (mainly in doped forms) 4-11, stable dimensionally and chemically upon redox cycling etc.
In this work we have synthesized pure strontium titanates via low temperature environment friendly sol gel technique. The main objective of the present work is to study the phase development with calcination at various temperatures; and other structural, micro-structural and electrical/dielectric properties. Furthermore the importance of these titanates for applications in SOFCs will be analyzed.
Experimental Work
SrTiO3-δ; STO has been synthesized via sol gel route 12 using strontium acetate {Sr(CH3COO)2}, titanium tetra isopropoxide {Ti(OC3H7)4}; both from Alfa AesarTM, as metal precursors; hydrochloric acid (HCl) as catalyst; propanol and distilled water as solvents using the metallurgical reaction (1).
Sr(CH3COO)2 + Ti(OC3H7)4 → SrTiO3-δ +…………(1)
The powders obtained after drying and crushing the alcogel were calcined at 600oC, 800oC, 920oC, 1000o C, 1100o C, 1150oC and 1250oC for 2 hours to obtain mono-phase powders. The calcinations were done in High Temperature Muffle Furnace with power rating 5.0 KW and 220 Volt ac supply at SBSSTC research lab. The powders were pelletized, calcined at 600oC to expel the binder and then, further sintered at 1250oC for two hours. The flow chart representing the whole experimental procedure is given in fig.1.The obtained samples were analyzed using DTA/TG, XRD, SEM, LCR Hitester techniques.
 |
Figure 1: Flow chart for synthesis of SrTiO3-dsamples |
DTA/TGA/DTG analysis was carried out using EXSTAR TG/DTA 6300. The nitrogen atmosphere (200ml/min) was kept during all the experiments. The amount of the sample used was 10.540 mg. The alumina powder (Al2O3) was used as reference material. The heating of sample was done from 35oC to 1200oC temperature. X ray diffraction of SrTiO3-δ ceramic samples obtained after calcination at various temperatures was carried out using a XPERT-PRO X-RAY diffractometer; type 0000000011023505. The machine was operated with a beam current of generator settings 40 mA and 45 kV power. The radiation used was Kα1 having wavelength 1.54060Å using Cu as target and nickel metal was used as β filter. The goniometer used was PW3050/60. The micro structural properties were investigated using JSM-6510 instrument. The instrument provides various magnification powers e. g. 5000xs, 10000xs; 20000xs etc. and operates at accelerating voltage 15 kV. The sample thickness used in SEM analysis is lesser than 2 mm. The samples were coated with gold layer of thickness ~ 100Å to avoid the charging effects using Auto Fine Coater at 20A for 40 sec. The impedance analysis was carried out on SOLARTRON (SI1260) impedance analyzer. Various parameters like real – imaginary components of impedance and relative permittivity were measured by the instrument at various temperatures i.e. at room temperature and from 48oC to 400oC. The frequency range used in the analysis was from 100 Hz to 1 MHz.
Results and Discussion
Thermal Analysis
 |
Figure 2: DTA/TG/DTG thermo-gram for uncalcined powder of SrTiO3-dsample |
DTA/TG/DTG thermo-grams obtained for uncalcined powder of SrTiO3-d are shown in fig. 2. The curve can be divided mainly in three parts. First part of TG curve corresponds to heavy weight loss; 99.98% to 78.7% in temperature range 26oC to 239oC having two endothermic peaks at 78oC and 146oC. This weight loss is due to the evaporation of some remainders of solvents with rise in the temperature. The second part of TG curve corresponds to weight loss from 78.7% to 61.5% in the temperature range from 239oC to 814oC and exothermic peak at 476oC due to decomposition of organic compounds and nitrates. The third part of the curve corresponds to weight loss from 59.3% to 52.44% in the temperature range from 815oC to 1288oC with two small endothermic peaks at 815o C and 827o C. This region of thermo-gram corresponds to the development of SrTiO3 phase 12-14.
XRD Analysis
The XRD peak patterns for SrTiO3-δ powders calcined at different temperatures 600oC, 800oC, 920oC, 1000oC, 1100oC, 1150oC and 1250oC are shown in fig. 3. It can be depicted from the figure that XRD peaks are sharp; well defined and indexing of peaks has been done considering the cubic symmetry of structure using mathematical method 15. Sr(OH)2, SrCO3, TiO2 and SrO are present as impurity or intermediate phases at lower temperatures whereas XRD peak patterns at temperature 1250oC has peaks mainly corresponding to SrTiO3-δ.
 |
Figure 3: X ray Diffraction peaks for SrTiO3-δ calcined at various temperatures. |
The variation in the amounts of impurities and required phase with temperature is given in fig. 4. Herein, the graphs have been plotted using normalized intensities. The intensities of peaks of impurity and intermediate phases have been normalized by 2778, the intensity of (101) peak of TiO2, which is highest among all peaks of impurity and intermediate phases, whereas, intensities of all the peaks of the desired compound i.e. SrTiO3-δ,have been normalized by 14807, the intensity of (110) reflection of SrTiO3-δ at 1100oC temperature, which is the highest value of intensity in the XRD pattern.
 |
Figure 4: Variation of amount of SrTiO3-δ phase and intermediate phases with rise in the temperature |
 |
Figure 5: Variation of percentage amount of SrTiO3-δ phase with temperature |
It can be easily inferred from the graph that the intensiy of the desired SrTiO3-δ phase increases with rise in the temperature whereas that of intermediate phases and impuritiesi.e. SrCO3, TiO2,Sr(OH)2 decreases with rise in the temperature. The percentage amount of the required SrTiO3-δ phase has been calculated at various temperatures using the relation (2). The graphical variation of percentage amount with temperature has been shown in fig. 5 which clearly indicates that amount of SrTiO3-δ phase increases with rise in temperature; with highest value 97% for samples sintered at 1250oC.

Here X (SrTiO3-δ) is the percentage amount of SrTiO3-δ phase and I(SrTiO3-δ), I(SrCO3), I(TiO2)and I{Sr(OH)2} are intensities of SrTiO3-δ, SrCO3, TiO2 and Sr(OH)2 phases obtained from XRD diffraction peaks respectively.
Lattice parameter ‘a’ values for SrTiO3-δ at various temperatures, as calculated using mathematical method for cubic crystals 15 are given in table 1. For cubic systems, relation between ϴ, wavelength (λ), lattice parameters and miller indices (h k l) is given by equation (3).
Here λ= 1.5406Å. Clearly, as depicted by table (1), the lattice parameter ‘a’ decreases with rise in temperature and the average value of ‘a’ is determined to be 3.9087 Å which is very close to theoretical value of ‘a’ 3.91 Å 16.The crystallite sizes, as calculated for SrTiO3-δ samples obtained after calcination at various temperatures, using the Scherrer’s equation are given in table 1 17. These have been determined for (110), (211) and (310) reflection peaks in the XRD patterns. Clearly, as depicted from table 1, the crystallite size for the reflection peaks (110), (211) and (310) increases with temperature up to 1100oC, then it slightly decreases at temperature 1150oC; then again it increases up to 1250oC. The increase in crystallite size suggests the ongoing process of crystallization with increase in the temperature. The slight crystallite size decrement at 1150oC may be because of inter-planar shift of atoms.
Table 1: Variation of crystallite size and lattice parameter for SrTiO3-δwith temperature
|
Temperature (oC) |
Crystallite Size (nm ) |
Lattice Parameter (Å) |
|||
|
(110) |
(310) |
(211) |
Experimental value |
Measurement Error |
|
|
600 |
54.93 |
41.48 |
44.47 |
3.9222 |
-0.0122 |
|
800 |
53.99 |
30.21 |
35.18 |
3.9072 |
0.0028 |
|
920 |
56.97 |
35.04 |
44.78 |
3.9035 |
0.0065 |
|
1000 |
81.09 |
74.21 |
88.93 |
3.9192 |
0.0092 |
|
1100 |
139.04 |
132.71 |
140.04 |
3.9023 |
-0.0077 |
|
1150 |
128.86 |
126.91 |
127.99 |
3.9021 |
-0.0079 |
|
1250 |
135.42 |
137.79 |
140.29 |
3.8980 |
-0.0120 |
SEM Analysis
SEM analysis was carried out for both, calcined (at 600oC) and sintered (at 12500C), pure SrTiO3-d pellets and effect of sintering on microstructure and grain size distribution was studied.SEM microstructures of SrTiO3-δsample obtained after calcination at 600oC for 2 hours are given in fig. 6 (a and b) whereas the fig. 6 (c) depicts the microstructure of pure SrTiO3-δ sample obtained after 2 hour sintering of pellets at 1250oC.It can be revealed that microstructure of SrTiO3-d samples obtained after calcination at 600oC was almost homogeneous but a little cluster formation and merged grain boundaries were observed. The grains were polyhedral shaped and nano sized; from 407 nm to 972 nm. Whereas the pure SrTiO3-d samples obtained after sintering the pellets at 1250oC had homogeneous microstructure with well developed, small angular grains having well defined, smooth and clear grain boundaries, edges, corners, faces having cubiodal shapes. The sintered SrTiO3-d samples showed good sinterabiltiy with marginal inter-granular porosity and average grain size was 728 nm. Thus sintering led to well developed microstructure for the synthesized samples. The sol gel method produces very fine powders and furthermore, the sintering temperature employed here is also low (1250oC); which lead to nano-sized ceramic samples 18-19.
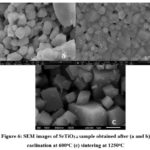 |
Figure 6: SEM images of SrTiO3-δ sample obtained after (a and b) caclination at 600oC (c) sintering at 1250oC |
Electrical and dielectric characterization
 |
Figure 7: Variation of dielectric constant (a) with log (frequency) at room temperature (RT) (b) with temperature at frequencies 10 KHz and 100 KHz for SrTiO3-δ sample |
The dependence of εreal on frequency for STO sample at room temperature is shown in fig.7 (a). The dielectric constant decreases very sharply up to frequency 1 KHz and then remains almost constant above that 20-21. The variations of dielectric constant with temperature ranging from 50 to 400oC at frequencies 10 KHz and 100 KHz for SrTiO3-δ ;STO sample is shown in fig. 7 (b). The dielectric constant remains almost constant up to a certain temperature and then, increases rapidly with increasing temperature which may be due to space charge polarization 22. The high values of dielectric constant at room temperature for this STO sample may be attributed to the presence of all kinds of polarizations at room temperature which can lead to irregular increase in the permittivity 23-24.The dielectric constant value for pure sample was measured to be ~ 64 at frequency 1 KHz and temperature 400oC.
Fig. 8 shows the frequency dependence of imaginary dielectric constant (εimg) for pure SrTiO3 (STO) sample. εimg shows the similar trends as that of εreal i.e. increase with temperature and decrease with frequency. There is no loss peak in the whole frequency spectrum of εimg. The values of εimg are high only at low frequencies (below 1KHz) and at high temperature (300oC to 400oC) owing to the interfacial build up of the free charges either within the sample; termed as Maxwell Wagner (MW) polarization 25 or between electrodes and sample; termed as Space Charge (SC) polarization. The imaginary component of dielectric constant (εimg) for pure undoped sample is 0.340 at frequency 10 KHz and temperature 108oC.
 |
Figure 8: Variation of imaginary part of dielectric constant (εimg) with log (frequency) at RT for SrTiO3-δ sample |
The frequency variation of loss tangent factor (tanδ) for STO sample at room temperature (RT) is shown in fig. 9(a). While the fig. 9 (b) depicts the temperature dependence of loss factor at 1000 KHz and 100 KHz frequencies from 50 to 400oC. From all these plots, the decrease in loss factor with frequency and increase in it with temperature can be revealed easily.
 |
Figure 9: Variation of loss tangent factor (a) with log (frequency)at RT (b) with temperature at various frequencies for SrTiO3-δ sample |
The dielectric loss for the SrTiO3-dmeasured at temperature below 250oC was very small e.g. 0.00604 at frequency 10 KHz and temperature 108oC; but by increasing the temperature from 250oC to 400oC, the dielectric loss value increased.
The variation trends of ac conductivity (σac) with frequency at room temperature (RT) and with temperature at 10 KHz and 100 KHz frequencies for synthesized STO sample are included in figures 10 (a) and 10 (b) respectively. It can be easily depicted that ac conductivity for the SrTiO3-d sample was almost constant at lower frequencies; while at higher temperatures and frequencies there was sharp enhancement in ac conductivity acquiring approximately 4.6 x 10⁻⁴ value at frequency 1 MHz and temperature 400oC; this increase may be due to the strong hopping mechanism 26.
 |
Figure 10: Variation of ac conductivity (σac) (a) with log (frequency) at RT (b) with temperature at frequencies 10KHz and 100KHz for STO sample. |
 |
Figure 11: Variation of (a) real component of impedance (Zreal) with log (frequency) at RT and at higher tempertaures (b) imaginary component of impedance (Z’’) with log (frequency) at various temperatures for STO sample |
Fig. 11 (a) includes the change in real part of impedance (Z’) for STO sample with frequency at room temperature, 108, 209, 309 and 400oC respectively. The decrement in Z’ with frequency as well as with temperature can be easily depicted from the figure. The decrease in Z¢ with rise in temperature is very clear at low frequencies in fig. 11 (a) whereas Z′ values at various temperatures coincide at high frequency. The decrease of impedance with temperature reveals the fact that synthesized materials possess negative temperature coefficient of resistance. The rise in temperature reduces the barrier which in turn leads to increase in ac conductivity and thus decrement in Z′ e.g. the real impedance value for the pure sample reduced from 582883 (at room temperature) to 251586 (at 400oC); both determined at frequency 1KHz. Fig. 11 (b) includes the frequency dependence of imaginary component of impedance (Z¢¢) for pure STO sample at various temperatures. It can be easily depicted from the curves that Z¢¢ values show a maximum value at low frequency which decreases with temperature. The values of Z¢¢ merge at high frequencies, as clearly visible from the plots; the space charge build up within the sample may be reason for that 27-29. Fig. 12 shows the Cole-Cole plots of STO sample at room and other higher temperatures. The grain effects in the samples are indicated by presence of semicircle; furthermore, the decrement in semicircle radius with increasing temperature can be observed; inferring the decrease in the resistivity with rise of temperature 26.
 |
Figure 12: Cole-Cole plots between real and imaginary part of impedance at room and higher temperatures for STO sample |
Conclusion
Here, in this work, we have successfully synthesized the strontium titanates with required cubic structure employing novel sol gel technique. The impurities in the powders go on decreasing with increase in calcination temperature and phase pure samples have been obtained after sintering at 1250oC. The obtained samples were phase pure, homogeneous and having well-developed morphology as revealed by XRD and SEM techniques. The synthesized samples possess good electrical and dielectric properties which make this material suitable for applications in SOFCs.
Acknowledgements
One of the authors Ms. Ramanjeet Kaur highly acknowledges IKGPTU (Inder Kumar Gujral Punjab Technical University), Kapurthala, Punjab, India for providing facilities in this course. The authors are also very thankful to TEQIP, MHRD/World Bank Project, IIC, I.I.T. Roorkee, MRC, MNIT Jaipur, Thapar University, Patiala and S B S State Technical Campus, Ferozepur for help and support in this whole work.
Conflict of Interest
There is no Conflict of Interest.
Funding Sources
There is no funding Source.
References
- R., Mukundan; E. L., Brosha; F. H., Garzon, Electrochem. Solid-State Lett.,2004, 7, A5–A7.
CrossRef - Z., Cheng; S.,Zha; M., Liu, Journal of Electrochemical Society, 2006,153, A1302– A1309.
CrossRef - J. C., Ruiz-Morales; J., Canales-Vázquez ; C., Savaniu ; D., Marrero López; W., Zhou ; J. T. S., Irvine, Nature, 2006, 439, 568.
CrossRef - S., Hui; A., Petric, J. Eur. Ceram. Soc., 2002, 22, 1673–1681.
CrossRef - S., Hui; A., Petric, J. Electrochem. Soc., 2002, 149, J1–J10.
CrossRef - Q. X., Fu; F., Tietz; D., Stover, J. Electrochem. Soc., 2006, 153, D74-D83.
- J. C., Ruiz-Morales; J., Canales-Vázquez; C., Savaniu; D., Marrero López; W., Zhou; J. T. S., Irvine; Nature, 2006, 439, 568.
CrossRef - S. W., Tao; J. T. S., Irvine; Nat. Mater., 2003, 2, 320.
CrossRef - S. W., Tao; J. T. S., Irvine; J. Electrochem. Soc., 2004, 151, A252-A259.
- H., Yang; T., Zhong; Z., Chen; X., Wang; N., Ai; et al., Ceramics International, 2022.
- D., Kim; I., Jeong; K. J., Kim; K. T., Bae; D. Kim; J. Koo; H., Yu; K. T., Lee; Journal of Korean Ceramic Society, 2022.
- A., Rocca; A.,Licciulli; M.,Politi; D.,Diso; International Scholarly Research Network Ceramics, 2012.
CrossRef - B., Li; C., Wang; C., Liu; W., Zhong;R., An, Materials Letters, 2012, 75, 207–210.
CrossRef - S., Ueno; K., Nakashima; Y. Sakamoto; S., Wada;Nanomaterials, 2015, 5, 386-397.
CrossRef - Laboratory Module, Indexing X-Ray Diffraction Patterns.
- L., Zhang; T., Tosho; N.,Okinaka; T., Akiyama,Mater. Trans, 2007, 48, 2088-2093.
CrossRef - B. D.,Cullity; Elements of X-Ray Diffraction Addison-Wesley, 1978.
- L., Zhang; T., Tosho; N., Okinaka; T., Akiyama, Materials Transactions, 2007, 48(8), 2088-2093.
CrossRef - H. C., Wang; W. C., Lei; W. B., Su; J., Liu; Y., Sun; H., Peng; L. M., Mei; J. Am. Ceram. Soc., 2011, 94, 838–842.
CrossRef - A., Verma; O. P., Thakur; C., Prakash; T. C., Goel; R. G.,Mendiratta, Mater. Sci. Eng.,2005, B116.
CrossRef - T.,Badapanda; R. K.,Harichandan; A., Mishra; S., Anwar, J. Adv. Dielectr.,2013,3, 1350013.
CrossRef - P., Abhijit; B., Amitabha;J. Mater. Sci.: Mater. Electron., 2013, 24, 1855–1862.
CrossRef - X., Wang; B., Zhang; L., Xu; Y., Hu; G., Shen; L., Sun;Sci. Rep., 2017, 7, 8517
CrossRef - A., Ray; B., Behera; T.,Basuy; S.,Vajandarz; S. K.,Satpathy;Nayak, J. Adv. Dielectr., 2018,85, 1850031.
- S., Kumar; K. B. R., Varma, Solid State Commun., 2008,147, 457–460.
- K. C. B., Naidu; T. S.,Sarmash; T., Subbarao;Int. J. Eng. Res. Technol.,2014, 3.
- T.,Badapanda; R. K.,Harichandan; S. S., Nayak; A., Mishra; S., Anwar; T.,Badapanda;Process. Appl. Ceram.,2014,8, 145–153.
CrossRef - S., Sahoo; U., Dash; S. K. S., Parashar; S. M., All, J. Adv. Ceram.,2013, 2, 291–300.
CrossRef - A., V.,Murugan; S. C.,Navale; V., Ravi, Materials Letters, 2006, 60, 1023–1025.
CrossRef

This work is licensed under a Creative Commons Attribution 4.0 International License.
About The Author
![]()
A New Edition of Web of Science
Journal Impact Factor
2022: 0.5
Five Year: 0.8
Journal is Indexed in

Cabells Whitelist
![]()


