Pre-Stages of the Formation of Ge3N4 on the Surface of Syngle-Crystal Germanium in Hydrazne Vapors (short note)
Irakli Nakhutsrishvili* , Revaz Kokhreidze and Giorgi Kakhniashvili
V.Chavchanidze Institute of Cybernetics of Georgian Technical University, Tbilisi, Georgia
Corresponding Author E-mail: iraklinakhutsrishvili52@gmail.com
DOI : http://dx.doi.org/10.13005/ojc/380128
Article Received on : 06-Jan-2022
Article Accepted on :
Article Published : 24 Jan 2022
Reviewed by: Dr. Soon Min Ho
Second Review by: Dr. Ioana Stanciu
Final Approval by: Dr. Abdul Wahab Omri
The interaction of hydrazine vapors with single-crystal germanium was studied by using the thermogravimetric method. The article considers the processes taking place on the surface of Ge up to the formation of Ge3N4 nitride, in particular, the accumulation of N2H4+H2O vapors and their etching with water vapor contained in hydrazine.
KEYWORDS:Germanium Nitride; Hydrazine; Mass Change
Download this article as:| Copy the following to cite this article: Nakhutsrishvili I, Kokhreidze R, Kakhniashvili G. Pre-Stages of the Formation of Ge3N4 on the Surface of Syngle-Crystal Germanium in Hydrazne Vapors (short note). Orient J Chem 2022;38(1). |
| Copy the following to cite this URL: Nakhutsrishvili I, Kokhreidze R, Kakhniashvili G. Pre-Stages of the Formation of Ge3N4 on the Surface of Syngle-Crystal Germanium in Hydrazne Vapors (short note). Orient J Chem 2022;38(1). Available from: https://bit.ly/3G0Jdol |
Introduction
The interaction of hydrazine vapors with elemental germanium is one of the ways to obtain of germanium nitride (3Ge(s)+2N2H4(g)→Ge3N4(s)+4H2(g)), a promising material in electronics, photocatalysis, luminescence, energy storage and others1-4. In5, the kinetics of interaction of hydrazine vapors with the surface of single-crystal germanium was studied using thermogravimetry. It was shown that the process consists of several successive stages: accumulation of N2H4+H2O vapors on the sample surface, etching of the Ge surface with water vapors contained in hydrazine, and the formation of Ge3N4 with its simultaneous sublimation. The kinetic curve ( mass change of sample – time) of the process, reflecting all the indicated stages, is shown in Fig.1 from5. Curves of this shape were obtained at temperatures of process of 700<T<750. This communication provides data on the interaction of hydrazine vapors with the surface of single-crystal germanium at lower temperatures (450≤T≤700) to study the initial stages of the process in detail.
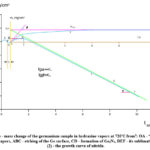 |
Figure 1: (1) – mass change of the germanium sample in hydrazine vapors at 720 from5: OA – “adsorption” of vapors, ABC – etching of the Ge surface, CD – formation of Ge3N4, DEF – its sublimation; (2) – the growth curve of nitride. |
Experimental
In the experiments, we used plates of single-crystal germanium doped with Sb (concentration of charge carriers ≅2×1014cm-3, resistivity ≅35 Ohm·cm, orientation {111}). They were successively degreased in boiling toluene, dried in the air, etched in a liquid etchant HF: HNO3:CH3COOH = 1:15:1 for (4-5) min and, washed in running distilled water, followed by drying. Commercial hydrazine-hydrate (50 mol% or 64 wt% N2H4) was dehydrated by Raschig’s method6 with modification: before distillation, it was boiled with NaOH in an inert N2 atmosphere at 120 ℃ for 2 hours. The resulting liquid had a density (at 20 ℃) of ≅1.008 g/cm3 and a refractive index of ≅1.471. It should be noted that the literature data on the physical characteristics of hydrazine (by which the concentration of water in it is estimated) differ from each other. This is apparently due to the well-known difficulties in the precise determination of the physical characteristics of highly hygroscopic hydrazine. (So, the above value of the refractive index, according to the literature, corresponds to 100% N2H4.) Therefore, the degree of moisture content in the hydrazine we use should be judged only approximately. It should also be noted that during storage of dehydrated hydrazine in a special ampoule under vacuum, no change in its physical characteristics was observed for several months. However, a significant difference was found in the kinetics of the interaction of its vapors with germanium under the same other conditions (Fig. 2). The curves shown in this Figure show a regular increase in the amount of “adsorbed” vapors and the etching rate of the germanium surface with increasing storage time. Since the etching process is caused by water vapor contained in hydrazine (Ge(s)+H2O(g)→GeO(g)+H2(g))7, it can be assumed that hydrazine is gradually moistened during its storage. (We point out again that the change the degree of moisture cannot be determined by the physical characteristics of hydrazine.) Subsequently, a satisfactory reproduction of the kinetic curves was observed and, a series of experiments were carried out at different temperatures. The weighing of the samples was carried out on a rocker microbalance with electromagnetic compensation of the mass change of the sample (sensitivity ≅10-6g). The inlet pressure of hydrazine vapors was ≅1.6×10³Pa, which increased (1.7÷2.9) times during the process depending on temperature.
 |
Figure 2: (a) Kinetic curves of interaction of hydrazine vapors with germanium at 720: (1) – the process carried out immediately after distillation of hydrazine-hydrate, (2) – two weeks after distillation, (3) – after month; (b) – initial sections of curves from Fig. 2 (a). |
Hydrazine is called “high purity” when it contains no more than 1 mass % (7 mol%) of water and “ultra pure” at maximum 0.5 mass% (3.5 mol%) H2O.
Results and Discussion
Figure 3 shows the kinetic curves obtained at temperatures where only the accumulation of N2H4+H2O vapors occurs on the germanium surface (450≤T<600 ℃). The process is completely reversible and reproducible, which indicates its physical nature. With an increase in temperature, the “adsorption” branch of the curves is gradually suppressed (for example, at 740℃, this branch disappears completely) due to the etching of the germanium surface (Fig.4). However, by eliminating the contribution of this process to the mass change of the sample, it is possible to plot the “adsorption” curve graphically (inset to Fig.4). These curves are described by the asymptotic equation m = mmax (1 – exp( -kt)) , where m is the sample mass gain over time t, mmax is its limiting value, k=(αμ+μ1)/μ2 is the adsorption rate constant (α is the accommodation coefficient, μ and μ1 is the number of molecules hitting and evaporating r/s cm2 of the surface per 1 sec, μ2 is the number of gas molecules in a monolayer per cm2 of the surface). The value mmax , determined graphically, regularly decreased from 0.26 to 0.11 mg/cm2 with increasing of temperature; the value of the constant k was calculated according to the above equation, taking into account the experimental data on the dependence (m – t) and amounted to (3.09÷3.89) × 10-4 sec-1. The temperature dependence of this constant (Fig.5) gives almost zero value of the activation energy of the process, which serves as an additional argument to confirm its physical nature. Control experiments were also carried out using single-crystal silicon at temperatures not conjugated with forming a surface or volatile compound (650÷850 ℃). These experiments gave simillar results (Figures 3 and 5).
 |
Figure 3: Kinetic curves of interaction of hydrazine vapors with germanium at: (1) 450, (2) 500, (3) 550 and with silicon at (4) 650, (5) 750, (6) 850. |
 |
Figure 4: Kinetic curves of the interaction of hydrazine vapors with germanium at: (1) 600, (2) 650, (3) 675 and (4) 700 (curve 4 = curve 3 from Fig. 2 (a)). On inset – (1) initial section of curve 2 and (2) graphically plotted “adsorption” curve. |
 |
Figure 5: Temperature dependences of the “adsorption” rate constant for (1) germanium, (2) silicon, and (3) etching rates of the germanium surface: [k] = sec-1, [V] = g/cm2sec. |
Same Figure 5 shows the temperature dependence of the etching rate of the germanium surface by water vapor contained in hydrazine. These velocities are calculated both according to Fig.4 (for 600÷700 ℃) and according to the data obtained at higher temperatures. (Since this process corresponds to a rectilinear mass decrease, the etching rate constant coincides with this rate.) The activation energy of the etching process is ≅53 kcal/mol, which agrees with the literature data on the heat of vaporization of germanium monoxide GeO (48÷55 kcal/mol).
Conclusion
So, the processes of accumulation of N2H4+H2O vapors on the germanium surface and etching of the given surface are researched. These processes activate the surface for further nitridation and nitride formation. As the kinetic dependences of the sample mass change evidence, the growth of Ge3N4 is seen as a gradual mass increase following the processes of “adsorption” and etching.
Acknowledgement
Autors tranks the senior researcher of Georgian Technical University Dr. Giorgi Mumladze for useful participating of discussing of the note.
Conflicting Interest
There is no conflicting interest in this study.
Funding Sources
There is no funding source.
References
- Mallem,K.; Jagadeesh Chandra,S.V.; Ju,M. et al. Nanosci. Nanotechn., 2020, 20, 1039-1045.
CrossRef - Ma,Y.; Wang,M.; Zhou,X. Energy Chem., 2020, 44, 24-32.
CrossRef - Huang,Z.; Su,R.; Yan,H. et al. Ceramics International, 2018, 44, 10858-10862.
CrossRef - Kim,Sh.; Hwang,G.; Jang,L.W. et al. Advanced Functional Mater., 2017, 27, 1605975.
CrossRef - Nakhutsrishvili,I. Oriental J. Chemistry, 2020, 36, 850-854.
CrossRef - Audrieth,L.F. and Ogg,B.A. The chemistry of hydrazines, Wiley&Sons, Inc. New York, 1951, 225.
- Jishiashvili,A.; Shiolashvili,Z.; Makhatadze,N. et al. Oriental J. Chemistry, 2017, 33, 1103-1110.
CrossRef

This work is licensed under a Creative Commons Attribution 4.0 International License.
About The Author
![]()
A New Edition of Web of Science
Journal Impact Factor
2022: 0.5
Five Year: 0.8
Journal is Indexed in

Cabells Whitelist
![]()


