Physical, Thermal and Electrochemical Descant of Soil
P. Jeyaseeli1*, F Jeyamangalam1 , D. Muthuraj2 and S. C. Vella Durai3
1Department of Physics, Sarah Tucker College (Autonomous), Tirunelveli – 627007, Tamilnadu, India.
2Department of Physics, The M.D.T Hindu College, Tirunelveli – 627010, Tamilnadu, India.
3Department of Physics, JP College of Arts and Science, Agarakattu, Tenkasi – 627852, Tamilnadu, India. (Affiliated to Manonmaniam Sundaranar University, Tirunelveli-627012, Tamilnadu, India).
DOI : http://dx.doi.org/10.13005/ojc/380122
Article Received on : 02-Feb-2022
Article Accepted on : 13-Feb-2022
Article Published : 23 Feb 2022
Reviewed by: Dr. Ayssar Nahle
Second Review by: Dr. Ioana Stanciu
Final Approval by: Dr. MGH Zaidi
To accomplish organic nourishment for the fleetly growing population in India can hold creating purposeful events at fostering the wise use of organic manures in crop productivity. Soil is one in all the foremost necessary physical factors dominant the flow and preservation of water, solutes, gases and biota in agriculture and natural environment. An understanding of physical condition of any soil is crucial for implementation of variable fields across the landscape. The field work is designed in South India of Tamil Nadu by planting the sweet corn at Karisalpatti village, Tirunelveli in 2018. It is gauged using single, double and triple manure combination of amendment at varied concentration to evaluates the physical properties of sandy loam soil. The field was set to go in randomised block style with 3 replications. A considerable enhancement in well being of soil was ascertained with reference to nourishing the convenience of physical steadiness using vermicompost manure. The increase in porosity has been attributed to extend the amount of pores within the soil. The physical changes of soil due to the time and temperature was assistance by thermo gravimetric and differential thermal methodology. Fourier transform infrared spectroscopy confirms the presence of organic mineral inside the soil. UV-Diffuse reflectance spectroscopy works out the structure and colourizes the sandy soil. Characterize the electrochemical system of soil using Cyclic Voltammeter spectroscopy. The result shows that thanks to the addition of organic manure there's robust OH bond absorption and stumps up high yield contribution to corn crop.
KEYWORDS:Electro-Chemical; FTIR; Physical; TG/DTA
Download this article as:| Copy the following to cite this article: Jeyaseeli P, Jeyamangalam F, Muthuraj D, Durai S. C. V. Physical, Thermal and Electrochemical Descant of Soil. Orient J Chem 2022;38(1). |
| Copy the following to cite this URL: Jeyaseeli P, Jeyamangalam F, Muthuraj D, Durai S. C. V. Physical, Thermal and Electrochemical Descant of Soil. Orient J Chem 2022;38(1). Available from: https://bit.ly/3BG9TdK |
Introduction
Organic farming will increase the small nutrients within the sandy loam soil for crop production. The soil fertility is replenished by raising the physical properties exploitation of organic amendments. The soil’s high pH prevents the iron gift within the soil and reduces the Nutrients. Application of various sorts of natural amendment decreased the acidulous quantity of soils1. Vermicompost could be a good soil conditioner or modification attributable to microorganism activity, water-holding capability, drainage, aeration and high consistency2. Significant metallic contagion was shorter in vermicompost added soil apart from accepting the opposite treatments3. The soil enriched with vermicompost had considerably low electrical conductivity in comparison to unamended plots4. Manure considerably redoubled total consistency, soil moisten level and bring down the bulked density of the sandy loam soil5. Rossel6 maintained the soil spectrum collection and expected the soil structure by its mineral properties like organic composition and contents of iron in the soil. The recent water- extractible soil organic manure from the sandy loam soil was not considerable by means of fertilization7. TGA and DTA have been applied widely in thermal stability of soil biotic matter which associated to surface-usage types, cultivation practices8-9. Soil chemical and physical properties have been predicated by reflectance spectroscopy10. UV diffuse reflectance spectroscopy characterizes the soil color by the presence of hydroxide metals and iron content in the soil. FTIR provides wide range of information of sandy loam soil chemical composition11. Cyclic voltammeter regulates the electrochemical reaction and the oxidant capability of the soil12. Vermicompost added soil have more hydroxyl assemble which prominent the oxidation rate in the sandy loam soil 13. Sandy loam soil requires persistent soaking and implantation to develop the nutrient heightening. The sandy loam soil originates at light yellow to dark brown. The size of sand grains in sandy loam is measured in millimeters.
Experimental Method
Experimental field work was administrated in Karisalpatti village is at 8.600 latitude and 77.580 longitudes, Tirunelveli. The field was droppings with vermicompost (VC) at 7.5, 12.5, 17.5 t ha-1 and also their combination of goat manure (GM) and farm yard manure (FYM) respectively. A controlled scenario whereas not appealing organic droppings was grasping in the soil. Entirely thirteen plots were contemplated. The field consists of sandy loam soil texture during which planted the corn. Physical properties of soils were expressed using KR box14. Hydraulic conductivity, permeability and porosity were measured using Constant Pressure Head Method. The electrical conductivity and potential of hydrogen were noted with potentiometry method stated by Jackson15. The results obtained were statistically verified using SPSS software (Statistical Package for Social Sciences). Spectrum studies like Fourier transform infrared spectroscopy, UV-diffuse reflectance spectroscopy, cyclic voltammeter analysis, temperature and differential thermal analysis were studied for the most effective yield plot like vermicompost at 17.5 t ha-1 and the controlled scheme. The functional group of sandy loam soil was found using FTIR (Perkin Elmer of Spectrum 2 model). The wavelength of the FTIR analysis is 4000-400 cm–1. The color and moisture content of the soil sample was found by using UV DRS spectroscopy (PAN analytical/X Pert3 Powder). In typical cyclic voltammetry, a solution component is electrolyzed (oxidized or reduced) by placing the solution in contact with an electrode surface, and then imposing sufficiently the positive or negative potential on that surface using a triangle potential waveform to force electron transfer. In simple cases, the electrode surface is started at a particular potential to a reference. The electrode potential is swept to a higher or lower value at a linear rate and finally, the potential will sweep rate back to the original value at the same linear rate.
Cyclic voltammeter of the sandy loam soil was measured using CV analyzer (Princeton Applied Research, Model: versa STAT MC). The applied frequency of cyclic voltammeter was 1 Hz to 1 M Hz. The temperature and differential thermal analysis of the soil were detected using TG/DTA – EXSTAR/6300.
Results And Discussion
Bulk Density and Particle Density
Table 1 and 2 shows that upsides of BD and PD had diminished in every one of the plots than the control plot esteem. Before reap the worth of BD was least as1.1722 gm cm-3 with VC+FYM amendment at 7.5 t ha -1 which as 23.8% not exactly the control plot. After reap the worth of BD was most reduced as1.1699 gm cm-3 with VC+FYM+GM amendment at 7.5 t ha-1 which was 20.5% not exactly the control plot. Additionally the worth of PD was most minimal as 1.7556 gm cm-3 with VC+GM amendment at 7.5 t ha-1 which was 23.8% not exactly the controlled scheme appeared in table 1.
Water holding capacity and hydraulic conductivity
The WHC and HC had expanded subsequent to molding of natural excrement when contrasted with the control plot appeared in Table 1 and 2. Before harvest the WHC in VC+FYM+GM at 17.5 t ha-1 is 34.7635% further prominent than the controlled scheme as23.0237%.The HC most extreme worth discovered to be2.2258cm hr-1 for VC+FYM at 17.5t ha-1 more worthy than the controlled scenario as1.8301 cm hr-1. After harvest the WHC in VC+FYM+GM at 7.5 t ha-1is 41.1705% which was 31.57 % more prominent than the controlled scheme. After reap the HC in VC+FYM at 12.5 t ha-1 is 2.3529 cm hr-1 which was 25.53% further prominent than the controlled scheme16.
Pore space and Saturated Moisture
The PS of the soil changed with VC+FYM with concentration 7.5, 12.5 and 17.5t ha-1 expanded as 36.1232, 37.894 and 46.6297 %. In the current examination for VC+FYM at 17.5 t ha-1 the pore space has most elevated worth as 46.6297 %which was 23.03 % more than the control plot. The SM of the soil amended with VC at 12.5 t ha-1 has high worth as 31.1320 % which was 38.18 % higher than the control plot in table 3.1. After harvest the PS of the soil amended with VC+FYM+GM at17.5t ha-1 has higher worth as 52.6502 % which was 30.94 % higher than the control plot. After harvest the SM of the soil amended with VC+FYM+GM at17.5t ha-1 has high value as 40.9563 % which was 51.14 % higher than the control plot.
Table 1: VC along with FYM & GM (Before Harvest).
|
Manure |
Bulk Density g cm-3 |
Particle density g cm-3 |
Water holding capacity(%) |
Pore space (%) |
Saturated Moisture (%) |
Hydraulic Conductivity cm hr-1 |
Permeability mm hr-1 |
Porosity % |
|
VC |
1.3233 |
2.1255 |
31.4897 |
40.9633 |
25.0609 |
1.9608 |
0.1786 |
5.0037 |
|
VC |
1.3080 |
1.9286 |
32.9422 |
40.1369 |
31.1320 |
2.1672 |
0.1974 |
4.8916 |
|
VC |
1.2183 |
1.7667 |
33.2364 |
37.6579 |
28.2247 |
2.1116 |
0.1923 |
5.0422 |
|
VC+ FYM |
1.1722 |
1.7556 |
32.8298 |
36.1232 |
24.1334 |
2.1116 |
0.1923 |
5.0422 |
|
VC+FYM |
1.4721 |
2.1992 |
27.5060 |
37.8940 |
24.9567 |
2.1672 |
0.1974 |
4.9658 |
|
VC+FYM |
1.3127 |
2.2096 |
32.7338 |
46.6297 |
29.6089 |
2.2258 |
0.2027 |
4.9284 |
|
VC+GM |
1.3694 |
2.0386 |
27.5862 |
36.4774 |
22.1259 |
2.0086 |
0.1829 |
5.0422 |
|
VC+GM |
1.2797 |
2.0209 |
31.8265 |
39.1925 |
24.1143 |
2.1116 |
0.1923 |
4.9658 |
|
VC+GM |
1.2785 |
2.0131 |
32.5023 |
39.0745 |
24.4898 |
1.9608 |
0.1786 |
5.0812 |
|
VC+FYM+GM |
1.2419 |
1.9371 |
31.1787 |
37.6579 |
21.5449 |
1.9152 |
0.1744 |
5.0422 |
|
VC+FYM+GM |
1.2383 |
1.8753 |
31.2678 |
37.3037 |
24.3762 |
2.0588 |
0.1875 |
5.0037 |
|
VC+FYM+GM |
1.3481 |
2.0880 |
34.7635 |
38.6023 |
26.3372 |
2.0086 |
0.1829 |
5.0422 |
|
Control |
1.5382 |
2.3052 |
23.0237 |
35.8871 |
19.2434 |
1.8301 |
0.1667 |
4.7845 |
|
Grand Mean |
1.3154 |
2.0202 |
30.9912 |
38.7384 |
25.0267 |
2.0490 |
.1866 |
4.9873 |
|
Significance) |
NS |
NS |
** |
NS |
NS |
** |
** |
** |
|
Standard Deviation |
.1009 |
.1672 |
3.1630 |
2.8092 |
3.2474 |
.1139 |
.0103 |
.0811 |
|
Standard error |
.0279 |
.0463 |
.8772 |
.7791 |
.9006 |
.0315 |
.0028 |
.0225 |
|
F test |
1.779 |
1.009 |
3.601 |
0.532 |
2.991 |
4.008 |
4.009 |
3.892 |
Permeability and Porosity
Before reap the PE greatest worth discovered to be 0.2027 mm hr-1 for VC+FYM at 17.5 t ha-1 was 17.76 % prominent than the control plot. The PO greatest worth discovered to be 5.0812 %for VC+GM at 17.5 t ha-1. The increment in porosity has been ascribed to expand the quantity of pores in the soil. After harvest the PE in VC+FYM at 12.5 t ha-1 was 0.2143 mm hr-1 more prominent the control plot as 0.1596 mm hr-1. The expansion in porosity has been ascribed to broaden the measure of pores inside the soil. The data on growth traits was statistically analyzed. All data’s were presented as a mean, standard deviation, standard error and F-test. The differences between the treatment and control groups were evaluated statistically. The significance level was chosen at P 0.05.Vermicompost manure added plots were produce more significant results in BD, PD, HC, PE and PO.
Table 2: VC along with FYM & GM (After harvest)
|
Manure |
Bulk Density g cm-3 |
Particle density g cm-3 |
Water holding capacity(%) |
Pore space (%) |
Saturated Moisture (%) |
Hydraulic Conductivity cm hr-1 |
Permeability mm hr-1 |
Porosity % |
|
VC |
1.3375 |
2.0352 |
31.9506 |
40.2550 |
28.2847 |
2.1116 |
0.1923 |
4.9658 |
|
VC |
1.3469 |
2.0779 |
31.0254 |
39.6647 |
25.8507 |
2.0588 |
0.1875 |
5.0037 |
|
VC |
1.4355 |
2.1615 |
28.2895 |
38.0120 |
24.8103 |
1.9608 |
0.1786 |
4.8916 |
|
VC+ FYM |
1.2631 |
1.8887 |
32.3364 |
38.2481 |
26.4035 |
2.1672 |
0.1974 |
4.9658 |
|
VC+FYM |
1.3351 |
2.0169 |
30.0619 |
38.6023 |
25.3758 |
2.3529 |
0.2143 |
4.8916 |
|
VC+FYM |
1.3056 |
1.9247 |
33.0018 |
40.1369 |
31.1321 |
2.1116 |
0.1923 |
4.9284 |
|
VC+GM |
1.2171 |
1.7667 |
33.1717 |
37.6579 |
28.0971 |
2.0588 |
0.1875 |
5.0037 |
|
VC+GM |
1.2183 |
1.7667 |
33.2364 |
37.6579 |
28.2248 |
1.9152 |
0.1744 |
5.0422 |
|
VC+GM |
1.2549 |
1.8800 |
35.1834 |
39.7828 |
29.9875 |
1.8301 |
0.1667 |
5.0812 |
|
VC+FYM+GM |
1.1699 |
2.0792 |
41.1705 |
43.6784 |
25.3741 |
2.1116 |
0.1923 |
5.0422 |
|
VC+FYM+GM |
1.3198 |
2.1236 |
31.7531 |
40.9633 |
25.061 |
1.9608 |
0.1786 |
4.8916 |
|
VC+FYM+GM |
1.3139 |
2.1865 |
31.8958 |
52.6502 |
40.9563 |
2.0588 |
0.1875 |
4.9658 |
|
Control |
1.4709 |
2.2909 |
28.1701 |
36.3593 |
20.0111 |
1.7522 |
0.1596 |
4.7157 |
|
Grand Mean |
1.3068 |
2.0152 |
32.4035 |
40.2822 |
27.6591 |
2.0346 |
0.1853 |
4.9530 |
|
Significance |
** |
** |
NS |
NS |
NS |
** |
** |
** |
|
Std. Deviation |
.0847 |
.1614 |
3.2831 |
4.1522 |
4.8634 |
.1541 |
.0140 |
.0940 |
|
Standard error |
.0235 |
.0447 |
.9105 |
1.1516 |
1.3488 |
.0427 |
.0038 |
.0260 |
|
F test |
5.250 |
17.950 |
1.551 |
3.013 |
0.947 |
4.949 |
4.956 |
7.001 |
BD – Bulk Density PD – Particle Density WHC – Water Holding Capacity PS – Pore Space SM – Saturated Moisture HC – Hydraulic Conductivity PE – Permeability PO – Porosity FYM – Farm Yard Manure GM – Goat Manure VC – Vermicompost
Physico-chemical properties
pH
In the current investigation for VC+FYM+GM (Before Harvest) the pH esteem was at its most reduced 6.3 at 12.5t ha-1 which was 10% not exactly the control plot as demonstrated in figure 1. After harvest the most minimal pH esteem was acquired in VC +FYM plot at 12.5 t ha-1 as 7.0 which were 10.26% not exactly the control plot. Before Harvest the control plot had the greatest worth of pH as 7.0. After reap the controlled scheme had the greatest worth of pH as 7.8. After harvest the expanding pH values of soil indicate the high accessibility of metals uptake by plant. The pH and EC esteems for vermicompost fertilizer as 6.19, 4.14 ds m-1. For the amended plot less pH esteems showed that the soil from the read locale was useful for cultivating rehearses.
Electrical Conductivity and Yield
The table 2 shows that before reap the least EC esteem was acquired in VC+FYM+GM plot at 12.7 and 17.5 t ha-1 as 0.12 ds m-1 which was 47.82% not exactly the controlled scheme. The controlled scheme had the most extreme worth of EC as 0.23 ds m-1. After reap the controlled scheme had the most extreme worth of EC as 0.17 ds m-1. The least EC esteem was gotten in VC+FYM plot at 12.5 t ha-1 as 0.06 ds m-1 which was 64.71% not exactly the control plot17-18. In the soil revised plot the yield was most extreme in the VC+FYM+GM plot at 17.5 t ha-1 as 6493.5 Kg ha-1 which was 46.2 % prominent than the controlled scheme 19.
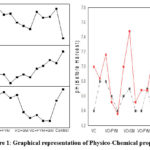 |
Figure 1: Graphical representation of Physico-Chemical properties |
Thermo gravimetric and differential thermal
TGA measures weight changes through temperature and differential thermal analysis (called DTA), which may notice changes in total heat. The DTA curve will solely be used as a fingerprint for identification, however sometimes the appliance of this technique is to see the part diagram, detect thermal changes and decomposition in numerous atmospheres. Relative to associate in nursing inert reference, it will notice changes within the sample, whether it is exothermic or endothermic. Differential Thermal Analysis (DTA) is a widely used thermal technique to notice phase changes of yellow clay as quartz, potassium, feldspar and iron core. The red color in sandy loam soil is that the reason behind the iron chemical compound20. Organic compound is vital as a compelling agent or tendency to absorb the environmental pollution in plane waters21.
 |
Figure 2: Graphical representation of thermo gravimetric and differential thermal for control plot |
TG and DTA for the control plot
Before harvest, TGA Weight % decreases to 96% when the temperature increases to 571 0C. In DTA as the temperature increases, the endothermic reactions happen at 3200C followed by decomposition and are figured out by a small hike in the figure 2. Then the exothermic reaction happens at 8700C and further crystallization happens and ends with -16 uv illumination. In TGA, the decomposition happens at 7130C. In differential thermal analysis decomposition happens at 8830C. TGA evaluates weight changes using temperature, during this process transformation such as transition, crystallization and some physical changes occur, resulting in changes in total heat. After harvest the TG weight % decreases to 92.8% as the temperature increases to 973.30C. In DTA the endothermic happens at 3200C and the exothermic happens at 8350C. After decomposition uv illumination decreases as the temperature increases. The area under the DTA curve is small in before harvest graph but it is larger in after harvest. Since the masses in both before and after harvest graph varies. Figure 2 shows heat absorption at 300°C and 550°C in relation to hydroxyl discharge from the microstructure of minerals in clay.
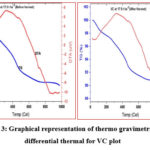 |
Figure 3: Graphical representation of thermo gravimetric and differential thermal for VC plot Click here to View figure |
TG and DTA for vermicompost soil
Weight Loss occurs due to decomposition of vermicompost. In TG the weight % decreases to 96.6% shows that decomposition begins at a lower temperature and progresses to a higher temperature when the weight percentage changes. In vermicompost amended DTA curve, before harvest the endothermic region at 3260C and the exothermic region happens at 7250C (figure 3). Decomposition of TG at 801 0C represent that organic content in the vermicompost manure soil reduces and it leads to crystallization. The decomposition of DTA happens at 8770C. After decomposition uv illumination decreases with increases in temperature and finally lies at -10 uv illumination. After harvest the vermicompost has the endothermic region at 3150C and the exothermic region at 7220C (figure 3)). Decompose of TG happens at 7950C and DTA at 8400 C, henceforth the soil samples have stable barely confirmed TG analysis. Weight Loss occurs due to decomposition of organic manure. The uniformity in the curve starts in the earlier stage once the weights get reduced but it is greater compared to before harvest. Enthalpy is directly proportional to mass and temperature. After harvest vermicompost mass is utilized a lot with increase in temperature, so area is large compared to before harvest. The consistency of curves in the last section relates to the crystallization of water molecules, which reduces warmth.
UV- diffuse reflectance spectroscopy
Soil organic matter content has a strong influence on soil reflectance. It is observed that as organic matter content increases, soil reflectance decreases throughout the 220 nm to 600 nm wavelength range. The reflectance differences predict the soil structure, soil particle size and shape. Averaged reflectance spectra from a broad range of sandy soils exhibit the trend of increasing reflectance with decreasing particle size. The presence of hydroxyl groups additionally affects the color of the soil by touching the speed of reaction. Soils with high water content have less air, particularly less chemical element. The red color is also the main attributed to the oxide created within the sort of skinny layer within the soil particles, and therefore the iron chemical compound exists within the sort of iron ore or hydrous oxide, the color is red and exists within the sort of hydrates likes iron ore, the bottom turns yellow color.
UV- diffuse reflectance spectroscopy for control plot
For the control plot before harvest, peak was obtained at 222.27 nm of wavelength for the sandy loam soil. The UV region lies between 200 nm to 370 nm for the control plot with the higher percentage of reflectance 43.4%. For the control plot, the reflectance was higher for all the wavelengths as compared to vermicompost added soil. Because the organic content of the plot is lower, the spectroscopic wave can easily penetrate this sort of soil. Once it passes through the ultraviolet zone, it reaches the visible region, where iron oxides can be found between 450 and 820 nm, as shown by the prominent peak (figure 4).After harvest the control plot has low percentage of reflectance as 21.1321, the UV zone lies between 200 nm and 370 nm shows some nonlinearity inside the UV zone, after it crosses the 380nm it enters the visible region; there are no peaks and the curve was linear above 25%. The peaks were wider (greater organic content) on this curve, whereas they were restricted before harvest (less organic content).
UV- diffuse reflectance spectroscopy for Vermicompost plot
The spectral reflectance in the ultraviolet band was 36.2717%. Because the vermicompost soil is rich in minerals, it penetrates less due to its higher water retention capacity than the control plot. Once it passes through the ultraviolet region, it enters the visible range, where iron oxides may be seen between 580 and 850 nm, with higher iron content than the control plot. Because the VC soil has more nutrients than the control plot, the reflectance and wavelength were lower in VC plot. After harvest the spectral reflectance in the UV range was 28.8949 %. Due to the loss in water holding capacity after harvest, the reflectance of a VC curve was higher for all wavelengths as compared to control plot. Because the organic content of VC added soil was lower, a spectroscopic wave can easily penetrate these soils. Their reflectivity was higher and the vermicompost decomposes much faster than a combination of manures since the nutrients were utilized up by the plants much faster.
 |
Figure 4: Graphical representation of UV- diffuse reflectance spectrum |
Fourier Transform Infra Red (FTIR)
Vermicompost manure contributes many vital applications in IR qualitative analysis. IR Spectra of soil reveals the presence of Water, phenols and alcohols: H-bonded -OH, unit guaranteedOH: stretching vibrations happen at 3500–4000cm-1. Nitrogen compounds have uneven stretching vibrations at 3500–3300, CH antisym and sym stretching happens at 2990-2850, Carbon dioxide at 2400–2240 cm-1, Carbonyl compounds (ketones, aldehydes, acids): uneven stretching vibrations The bands arising from stretching vibrations are sturdy bands on the point of 1044 cm-1 for silicon, and shut to 1600 cm-1 for carboxylate. Bending vibrations (below 900 cm-1) are often accustomed establish the minerals carbonate, metal Mg carbonate. The silicon metals known from their changes, for instance, quartz is often promptly known by a pointy jacket at 692 and 665 cm-1. Bands of organic matter, as well as organic compound peaks, acid peaks, and organic compound (protein) peaks, happens at600 -500 cm-1. The kaolinite (3700-3620 cm-1) mineral peaks were observed in the spectrum resolving, well defined clay minerals22. FTIR is often used for handling heavy molecules in the sandy loam soil23. Figure 5 shows that the soil with organic manure has strong OH bond absorption at 3657 cm-1 whereas while not organic manure has a weak bond that proves that organic manure has smart water holding capability. The coefficient of IR radiation is a lot for organic manure that shows that the daylight will simply penetrate into the soil.
 |
Figure 5: Graphical representation of Fourier Transform Infra Red (FTIR) |
Cyclic Voltammetry(CV)
 |
Figure 6: Graphical representation of cyclic voltammetry |
CV for control plot
The electrochemical reaction of interest takes place at the working electrode of voltaic cell. Electrical current at the working electrode due to electron transfer is termed as Faradic current. An auxiliary electrode is driven by a potentiostatic circuit to balance the Faradic process at the working electrode with an electron transfer of opposite direction. During the potential sweep, the potentiostat measures the Faradic current at the working electrode resulting from the applied potential. The resulting plot of current versus potential is called cyclic voltammogram, which is a complicated, time-dependent function of a large number of physical and chemical parameters.
For the control plot, before harvest the range value raised to a certain extent than the before graphs. In the control plot before harvest peak analysis for the potential was between -1.444 V to -1.021 V. The highest peak value for the current I was -5.189 µA and the potential was – 1.222 V. The peak value lies between -1.4V to -1V under the area of 51.85 µC predict the electro-chemical properties of sandy loam soil. After harvest the control plot has the peak value for current as -6.486 µA and for potential as -1.235 V. Total area was about 68.057 µC. Potential range covers 1.3 V to -965.5 mV.
CV for Vermicompost soil
Before harvest the vermicompost added soils have voltammetry curves enrolled in the range of -1.1 V to -506.6 mV under the area of 256.385 µC which determines the concentration of vermicompost was electrochemically active in the soil. The potential differences between the two limits produce an electrochemical reaction. The highest peak potential for vermicompost added soil was -1.014 V shown in figure 6. After reaching the maximum value the potential was reversed which determines the oxidation state. The resultant graph shows that the range increases greatly so the antioxidant potential of soil increases due to addition of vermicompost manure. The antioxidants stop the damaging oxidation by free radicals by being changed into responsive stable free radicals.
After harvest the vermicompost added soils have voltammetry curves in the range of -1.1 V to -575.3 mV, while the control plots have -1.3V to -965.5 mV. Metals such as iron and copper stop the redox reactions in the biological system of soil. The soil with organic matter undergoes chemical reaction with the solvent after transferring the electron. Changes in the voltammetric characteristics arising from surface functional groups were influenced by soil pHs. When voltammograms taken before and after a pH change were subtracted, a difference current with broad peaks resembling a cyclic voltammogram of a solution-phase redox species was detected. Metals such as iron and copper stop the redox reactions in the biological system of soil 24. The soil with organic matter undergoes chemical reaction with the solvent after transferring the electron. Hot and dry weathering condition of soil has volatile chemical profile25. The result shows that the antioxidant potential of soil increases due to addition of vermicompost manure.
Conclusion
Several tests can be achieved to analyze the changes in physical properties. While pilling the organic manure into the soil the physical properties such as bulk density, particle density, and water holding capability, pore space, saturated moisten, porosity, hydraulic conductivity, and penetrable changes in contrast to unappealing organic droppings. Most significant results were obtained in BD, PD, HC, PE and PO for the vermicompost added soil. The physico-chemical properties such as potential hydrogen, electrical conductivity worth lower than the control plot. The incorporation of organic fertilizers ameliorated the soil physical properties of producing high yield of corn. Among the organic sources, VC was significantly superior, followed by other manures.TG/DTA determines the thermal changes and decomposition in various atmospheres of the sandy loam soil. The diffuse reflectance spectroscopy scans the recorded wavelength-reflectance spectra for soil boundaries like soil color, mineral and moisten content. FTIR spectroscopy strongly confirms the presence of natural minerals in the sandy loam soil. The approach of FTIR analysis the physical composition of soil organic manure for finding out the results of agricultural management appears to be applicable to terribly sandy loam soil only. Additions of organic manure in the sandy loam soil increase the water holding capacity. Thus the organic manure contributes several important applications in IR spectroscopy evaluation. Cyclic voltammeter determines the antioxidant activity of soil which was greatly increased with more hydroxyl groups for organic amended plot.
Acknowledgement
I, P. Jeyaseeli (Reg.No: 18121072132021) is thankful to authorities of PG and Research Department of Physics, Sarah Tucker College (Autonomous), Tirunelveli, (affiliated to Manonmaniam Sundaranar University, Tirunelveli-12) for providing necessary research facilities.
Conflict of Interest
The authors declare that we have no conflict of interest.
Funding sources
There are no funding Sources
References
- Adeniyan, O. N.; Ojo, A. O.; Akinbode, O. A.; Adediran, J. A. Journal of Soil Science and Environmental Management., 2011, 2(1),9-13.
- Zeynep Demir. Communication in Soil Science and Plant Analysis, 2019, 2151-2168.
CrossRef - Goswami, L.; Nath, A.; Sutradhar, S.; Battacharya, S. S.; Kalamdhad, A.; Vellingiri, K.; Kim, K. H. J. Environ.l Manage., 2017,200, 243-252.
CrossRef - Azarmi, R.; Giglou, M. Q.; Taleshmikail, R. D. African Journal of Biotechnology, 2008, 7(14), 2397-2401.
- Mertens, J.; Germer, J.; Filho, J. C. D. A.; Sauerborn, J. Arch. Agron. Soil Sci., 2017, 969-983.
CrossRef - Rossel, R. V. A.; Behrens, T.; Ben-Dor, E.; Brown, D. J.; Dematte, J. A. M.; Shepherd, K. D.; Shi, Z.; Stenberg, B.; Stevens, A.; Adamchuk, V.; Aichi, H.; Barthes, B. G.; Bartholomeus, H. M.; Bayer, A. D.; Bernoux, M.; Bottcher, K.; Brodsky, P. L.; Du, C. W.; Chappell, A.; Fouad, Y.; Genot, V.; Gomez, C.; Grunwald, S.; Gubler, A.; Guerrero, G.; Hedley, C. B.; Knadel, M.; Morras, H. J. M.; Nocita, M.; Ramirez-Lopez, L.; Roudier, P.; Campos, E. M. R.; Sanborn, P.; Sellitto, V. M.; Sudduth, K. A.; Rawlins, B. G.; Walter, C.; Winowiecki, L. A.; Hong, S. Y.; Ji, W. Earth Science Reviews, 2016, 155, 198.
CrossRef - Ellerbrock, R. H.; Hohn, A.; Greke, H. H. Plant Soil., 1999, 213, 55-61.
CrossRef - Yodthongdee, Y.; Sooksamiti, P.; Jakmunee, J.; Lapanatnoppakhun, S. Orient. J. Chem., 2013, 29(3), 1027-1032.
CrossRef - Helfrich, M.; Flessa, H.; Dreves, A.; Ludwig, B. J. Plant Nutr. Soil Sci., 2010, 173, 61–66.
CrossRef - Li, S. W.; Song, H. P. Leng, Y. Pharm. Biol., 2014, 52, 129-135.
CrossRef - Baumgardner, M. F.; Silva, L. R.; Bieh, L. L.; Stoner, E. R. Adv. Agron., 1985, 38,1-44.
CrossRef - Chevion, S.; Chevion, M. Ann. N. Y. Acad. Sci., 2000, 899, 308-325.
CrossRef - Sochor, J.; Dobes, J.; Krystofova, O.; Nedecky, B. R.; Babula, P.; Pohanka, M.; Jurikova, O.; Zitka, O.; Adam, V.; Klejdus, B.; Kizek, R. Int. J. Electrochem. Sci., 2013, 8, 8464-8489.
- Keen, R.; Raczkowski, H. J. Agric. Sci., 1921, 11, 441-449.
CrossRef - Jackson, M. L. Soil Chemical Analysis, Prentice Hall, New Delhi, 1st edn., 1973, 89-91.
- Erbil, N.; Duzguner, V.; Durmuskahya, C.; Alan, Y. Orient. J. Chem., 2015, 31(3), 1263-1268.
CrossRef - Kumar, V.; Singh, S.; Kashyap, N.; Singla, S.; Bhadrecha, P.; Kaur, P.; Datta, S.; Kalia, A.; Singh, J. Orient. J. Chem., 2015, 31(1), 357-361.
CrossRef - Palani, K.; Balasubramanian, K.; Kalaivani, R. Orient. J. Chem., 2018, 34(6), 3129-3133.
CrossRef - Jeyamangalam, F.; Jeyalakshmi, P. Journal of Modern Science, 2018, 8(1), 33-41.
- Celik, H. Appl. Clay Sci.,2010, 50, 245–54.
CrossRef - Fernandez, J. M.; Peltre, C. M.; Craine, J. M.; Plante, A. F. Environ. Sci. Technol. 2012, 46, 8921–8927.
CrossRef - Russell, J. D.; Fraser, A. R. In Clay Mineralogy: Spectroscopic and Chemical Determinative Methods, M.J. Wilson, Ed. Chapman and Hall, London, 1994, pp. 11-67.
CrossRef - Arenillas, A.; Rubiera, F.; Pis, J. J. J. Anal. Appl. Pyrolysis., 1999, 50, 31–46.
CrossRef - Yucel, T. B.; Erata, H. Natural Volatiles and Essential Oils, 2021, 8(3), 64-74.
CrossRef - Juan, A.; Molina, L.; Vacas, S.; García, D.; Verdeguer, M. Natural Volatiles and Essential Oils, 2014, 1(1), 73-79.

This work is licensed under a Creative Commons Attribution 4.0 International License.
About The Author
![]()
A New Edition of Web of Science
Journal Impact Factor
2022: 0.5
Five Year: 0.8
Journal is Indexed in

Cabells Whitelist
![]()


