Characterization of Ligand N'-[(1E)-1-Phenylethylidene]-1,3-Benzothiazole-2-Carbohydrazide by Using Marvin Sketch 20.8 Software
K. Laxmi
Department of Chemistry, Chaitanya Bharathi Institute of Technology (CBIT), Gandipet, Hyderabad, India
Corresponding Author E-mail: katangurulaxmi @ gmail.com
DOI : http://dx.doi.org/10.13005/ojc/380109
Article Received on : 25-Nov-2021
Article Accepted on :
Article Published : 12 Feb 2022
Reviewed by: Dr. S. Ayyyappan
Second Review by: Dr. Ibrahim A.
Final Approval by: Dr. Bal krishan
Marvin Sketch is the fast and accurate software used for drawing of chemical compounds and reactions. This software also provide guidance and is integrated with calculators for obtaining the suitable results of properties. Marvin sketch 20.8 software is well equipped with advanced chemical viewer for studying the chemical structures both single and multiple 2D/3D, as well as chemical reactions and its related data. It can display all the details, like molecule name, generated IUPAC name and SMILES strings of molecules. With the help of Marvin Sketch 20.8 software the compound N'-[(1E)-1-phenylethylidene]-1,3-benzothiazole-2-carbohydrazide(PEBTH) is characterized and all its properties were determined.
KEYWORDS:Conformers; Charge; Geometrical Descriptors; Huckel analysis; Isoelectric point; Log P; Mass spectrum; Orbital electronegativity; Polarisability; pKa; PEBTH; Refractivity; Structure display models
Download this article as:| Copy the following to cite this article: Laxmi K. Characterization of Ligand N'-[(1E)-1-Phenylethylidene]-1,3-Benzothiazole-2-Carbohydrazide by Using Marvin Sketch 20.8 Software. Orient J Chem 2022;38(1). |
| Copy the following to cite this URL: Laxmi K. Characterization of Ligand N'-[(1E)-1-Phenylethylidene]-1,3-Benzothiazole-2-Carbohydrazide by Using Marvin Sketch 20.8 Software. Orient J Chem 2022;38(1). Available from: https://bit.ly/3uLBxEy |
Introduction
N’-[(1E)-1-phenylethylidene]-1,3-benzothiazole-2-carbohydrazide(PEBTH)
Synthesis of N’-[(1E)-1-phenylethylidene]-1,3-benzothiazole-2-carbohydrazide(PEBTH) as given in Fig 1 involves three steps (i) conversion of 2-aminothiophenol to benzothiazole -2- ethyl carboxylate by esterification (ii) conversion of ester to its hydrazide (iii) conversion of benzothiazole-2-carbohydrazide(BTCH)to N’-[(1E)-1-phenylethylidene]-1,3-benzothiazole-2-carbohydrazide(PEBTH) by reaction with acetophenone.
 |
Figure 1: Structure of PEBTH |
Results and Discussion
By using the Marvin Sketch 20.8 the structure of N’-[(1E)-1-phenylethylidene]-1,3-benzothiazole-2-carbohydrazide (PEBTH) was built and its name is determined as follows
Traditional name: N’-[(1E)-1-phenylethylidene]-1,3-benzothiazole-2-carbohydrazide
Preferred IUPAC name: N’-[(1E)-1-phenylethylidene]-1,3-benzothiazole-2-carbohydrazide
The properties of N’-[(1E)-1-phenylethylidene]-1,3-benzothiazole-2-carbohydrazide (PEBTH) as determined by Marvin Sketch 20.8 are as following.
Mass spectrum for N’-[(1E)-1-phenylethylidene]-1,3-benzothiazole-2-carbohydrazide(PEBTH)
In Marvin sketch software with the help of Elemental Analysis Plugin the elemental composition of a molecule is studied and the basic descriptors were determined.
Elemental Analysis Plugin calculatesbasic descriptors like Molecular weight ,Exact molecular weight, Formula, Composition ,Atom count associated with elemental composition of a molecule1,2.
The structure of N’-[(1E)-1-phenylethylidene]-1,3-benzothiazole-2-carbohydrazide(PEBTH) is drawn as an input structure which gives the following analysis results.
The following data of PEBTH is obtained by making using of Elemental Analysis Options window.
Table 1: Mass spectrum for N’-[(1E)-1-phenylethylidene]-1,3-benzothiazole-2-carbohydrazide(PEBTH)
|
Molecular weight : |
295.36 |
|
Exact molecular weight |
295.077933225 |
|
Formula |
C16 H13N3 OS |
|
Composition : |
C (65.07 % ), H (4.44 %), N (14.23 %), O (5.42%), S ( 10.85 %) |
|
Atom count |
34 |
From the standard atomic weights, the average molecular mass of PEBTH is determined and its value is 295.36and the exact molecular weight of PEBTH is 295.077933225. From the weights of the mostabundant natural isotopes of the elements the monoisotopic mass is calculated and this value is found to be in coincidence with the above value(Table 1).
Chemical formula of the molecule is given in accordance with the Hill system where in the number of carbon atoms is indicated first followed by the number of hydrogen atoms next, and then the number of all other chemical elements , harmonizing alphabetical order. Chemical formula of PEBTH is C16 H13N3 OS.
The elemental composition of PEBTH obtained is C (65.07 % ), H (4.44 %), N (14.23 %), O (5.42%), S ( 10.85 %) . As per the calculation made from the atomic masses the elemental composition is indicated in weight percentage (w/w%). Atom count of PEBTH is 34 and this count is the number of all atoms in the molecule PEBTH.
 |
Figure 2: The m/z:relative abundance Mass spectrum of N’-[(1E)-1-phenylethylidene]-1, |
Taking into account of relative abundance of the isotopes the mass distribution of the input molecule PEBTH is calculated using Marvin sketch software. This distribution of mass is demonstrated as a spectrum and this spectrum in mass spectroscopy is known as the m/z:relative abundance spectrum.
Mass spectral data recorded for N’-[(1E)-1-phenylethylidene]-1,3-benzothiazole-2-carbohydrazide (PEBTH) by using Marvin sketch 20.8 software shows peaks of 295 :1.00, 296:0.19, 297:0.06, 298:0.01as given in fig 2. Mass spectrum data of PEBTH (m/z : relative abundance): 295 :1.00, 296:0.19, 297:0.06, 298:0.01. This is in agreement with the experimentally recorded mass spectrum data which shows molecular ion peak M+ at m/z 295.
Structure display models of PEBTH
In Marvin sketch it is possible to obtain the different structure display of the molecules. This is done by navigating in Marvin sketch as view followed by structure Display. The structure display formats of the molecule N’-[(1E)-1-phenylethylidene]-1,3-benzothiazole-2-carbohydrazide(PEBTH) like stick, ball and stick and space fill forms of the molecule PEBTH are given in the following figures.
figure 3 displays the structure of PEBTH in various forms like stick, ball and stick and space fill models .
 |
Figure 3: Structure display models of N’-[(1E)-1-phenylethylidene]-1, 3-benzothiazole-2-carbohydrazide(PEBTH) |
pKa of N’-[(1E)-1-phenylethylidene]-1,3-benzothiazole-2-carbohydrazide(PEBTH)
Molecules in general contain specific functional groups that can lose or gain protons under suitable conditions. The coincidence of the protonated and deprotonated forms of the molecule is described by a constant value of pKa. In marvin software by making use of the pKa Plugin it is possible to calculate the pKa values of the molecule. It is well known that the based on its partial charge distribution the pKa value of molecule changes.
By using the marvin sketch 20.8 pKa of N’-[(1E)-1-phenylethylidene]-1,3-benzothiazole-2-carbohydrazide (PEBTH) is determined3 and it is found to be 9.82 which indicates the dissociation of the proton from the ligand PEBTH(figure 4).In PEBTH as there are less than 8 ionizable atoms , microspecies distribution is displayed on the chart given in figures 4,5 with data given in Table 2.
This is agreement with the experimental data of potentiometric Titrations carried out with N’-[(1E)-1-phenylethylidene]-1,3-benzothiazole-2-carbohydrazide (PEBTH) in 70% v/v DMF-water medium at 0.1M ionic strength and 303K temperature. The dissociation of proton of PEBTH corresponds to pKa value of 10.6 .
The comparision of pKa value of PEBTH reveals that in aquo organic medium of 70% v/v DMF-water medium pKa value is high because the proton dissociation of the ligand is influenced by the Basicity and dielectric constant of the medium. Changes in dielectric constant and the basicity of the medium influences the acid- base equilibria. With the addition of organic solvent DMF miscible with water,to an aqueous medium, a number of changes occur like decrease in dielectric constant of the medium, breakdown of structuredness of water and solvation of proton in high concentration of organic solvent.
In marvin software the display option tab provides the following options which can be set
The number of decimal places for the result is set as 2
Distribution chart gives the range of displaying the microspecies distribution diagram as following and it can be set like pH lower limit( taken as 0), pH upper limit( taken as 14), pH step size( taken as 0.2).
 |
Figure 4: microspecies distribution of PEBTH is displayed on the chart |
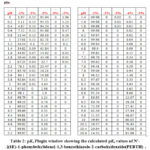 |
Table 2: pKa Plugin window showing the calculated pKa values of N’- [(1E)-1-phenylethylidene]-1,3-benzothiazole-2-carbohydrazide(PEBTH) |
 |
Figure 5: microspecies distribution (in %) of N’-[(1E)-1-phenylethylidene]-1, 3-benzothiazole-2-carbohydrazide(PEBTH). Major microspecies is obtained at pH= 7.40 |
Isoelectric point of PEBTH
Isoelectric point (IEP)is the pH at which a particular molecule or surface has no electrical charge. In chemaxon software the total charge distribution of PEBTH is determined as a function of pH. applying the isoelectric point plugin.The table 3 as given below shows result of Isoelectric point (IEP )and the pH of PEBTH molecule.and the figure shows the pH:charge plot
 |
Table 3: Data for Isoelectric point of PEBTH |
LogP result window of PEBTH
The octanol/water partition coefficient is calculated employing logP Plugin and is further applied in QSAR analysis. Molecular hydrophobicity4 -7 can be judged by octanol/water partition coefficient and this is also applied for rational drug design. Log P is calculated by the methodsuggested by Viswanadhan et al publication. Log P value of PEBTH is 3.33 as obtained by Marwin software and displayed in figures 7. and the atomic increments are displayed in figure 6
 |
Figure 6: LogP result window of PEBTH with atomic increments displayed in Marvin Space |
 |
Figure 7: LogP value of PEBTH with atomic increments displayed in Marvin View. |
In Marwin software following points were considered in order to modify the algorithm 1.In order to accommodate electron delocalization many atomic types were redefined and as a result the assistance made by the ionic forms were included. The logP of zwitterions are determined from their logD value at their isoelectric point the effect of hydrogen bonds on the logP is determined and the probability of forming the six membered ring among the suitable donor and acceptor atoms is evaluated. atoms like S, C, N and metal atoms were introduced.
Charge of PEBTH
Certain properties like like ionization constants, reactivity and pharmacophore pattern which describes the Physico-chemical behavior of a molecule are determined by partial charge distribution. partial charge value of each atom can be computed by Charge Plugin. From sigma and pi charge components , total charge is calculated.
The results of the charge calculation of PEBTH are shown in a new window. From the results obtained it is clear that negative charge values are highest for oxygen . Also it is observed that negative charge values are higher on N atoms of amine group (N-NH) and N of benzothiazole ring .( Fig.8 ).
 |
Figure 8: Charge calculation of PEBTH |
Polarisability of PEBTH
The relative tendency of an electron cloud which is deformed by an external electric field is Polarizability. The more polarizable ion vicinity is the more stable ionized site. Because of this atomic polarizability is considered as an significant element in the measurement of pKa. Partial charges of atoms8,9 influence the polarizability of atoms . with the help of Polarizability Plugin the values of atomic and molecular polarizability were determined. Molecular Polarisability value of PEBTH is 32.47 as given in figure 9
 |
Figure 9: Polarisability calculation of PEBTH |
Orbital electronegativity of PEBTH
Orbital electronegativity (orbital EN) of the atoms in the molecule determines the Partial charge distribution of the molecule. It is possible to evaluate orbital EN values of atoms with the help of orbital EN values of atoms in PEBTH molecule are displayed in figure 10 and Table 4
|
Figure 10 Orbital electronegativity values of PEBTH |
 |
Table 4: Orbital electronegativity calculation of PEBTH |
Geometrical Descriptors of PEBTH
The energy of the 3D structure of the molecule is calculated by making use of Dreiding force field Dreiding energy of PEBTH is 63.42 kcal/mol
The energy of the 3D structure (conformation) of the molecule using MMFF94 force field is calculated and its value of PEBTH is 170.68 kcal/mol
Steric hindrance of an atom is calculated from the values of covalent radii and geometrical distances
Based on the van der Waals radius (in Å2) the minimum of projection areas of the conformer is determined and its value of PEBTH is 36.38 Å2
The maximum of projection areas of the conformer is also calculated by using the van der Waals radius (in Å2) and its value of PEBTH is 90.98 Å2
The radius for the minimal projection area of the conformer (in Å) is determined as Minimal projection radius and for PEBTH its value is 4.28
The radius for the maximal projection area of the conformer (in Å) is Maxiimal projection radius and for PEBTH its value is 8.75
maximal extension length of the conformer perpendicular to the minimal projection area for PEBTH (in Å) is 6.93
In the same way maximal extension length of the conformer perpendicular to the maximal projection area of PEBTH (in Å) is 17.19
van der Waals volume of the conformer(in Å3) is calculated and for PEBTH its value is 252.54. All these above values are displayed in figure 11
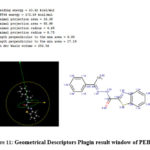 |
Figure 11: Geometrical Descriptors Plugin result window of PEBTH Click here to View figure |
Conformers of PEBTH
Conformational isomerism is defined for molecules with same structural formula but with different 3D structure. Conformers are converted from one form to other by rotation along rotatable bonds. Conformers possess different energies and they cannot be separated from one another in laboratory.
With the help of Conformer Plugin a selected number of conformers can be generated. Fig 12 displays the different possible Conformers of PEBTH
 |
Figure 12: Conformers of PEBTH |
Topology analysis of PEBTH
Table 5: Topology analysis of PEBTH
|
Topology analysis of PEBTH |
|||
|
count of aliphatic atoms |
6 |
count of aromatic ring |
3 |
|
count of aliphatic bonds |
7 |
count of carbo ring |
2 |
|
count of aromatic atom |
15 |
count of carboaliphatic ring |
0 |
|
count of aromatic bond |
16 |
count of carboaromatic ring |
2 |
|
count of asymmetric atom |
0 |
count of Fused aliphatic ring |
0 |
|
count of atoms |
34 |
count of Fused aromatic ring |
2 |
|
count of bonds |
36 |
count of Fused ring |
2 |
|
count of Chain atoms |
6 |
count of Hetero ring |
1 |
|
count of Chain bonds |
7 |
count of Heteroaliphatic ring |
0 |
|
count of Chiral centers |
0 |
count of Heteroaromatic ring |
1 |
|
count of Ring atoms |
15 |
Largest ring size |
6 |
|
count of Ring bonds |
16 |
Largest ring system size |
2 |
|
count of Rotatable bonds |
3 |
count of Ring |
3 |
|
count of stereo double bonds |
1 |
count of Ring system |
2 |
|
count of aliphatic rings |
0 |
||
Topology analysis plugin calculates different topological descriptors of PEBTH molecule as given in Table 5
Polar surface area of PEBTH
Polar Surface Area (PSA) is the accumulation of all polarized atoms of a molecule and PSA descriptor is in coordination with molecular membrane transport. Ertl et al14 provided a method for estimation of Topoligical Polar Surface Area (TPSA). TPSA value can be calculated at a given pH both for the neutral form of the molecule and for the major microspecies TPSA value of PEBTH is calculated and its value is 54.35 as shown in figure 13.
 |
Figure 13: Polar surface area of PEBTH |
Molecular surface area of PEBTH
Molecular surface area calculations are of two types van der Waals (vdW) and solvent accessible (SA). van der Waals surface area of PEBTH is determined 15-16 and its value is found to be 385.64 as shown in figure 14.
 |
Figure 14: Molecular surface area of PEBTH |
The Hydrogen Bond Donor/Acceptor Plugin calculation of PEBTH
The hydrogen bond donor and acceptor properties of the atoms in the molecule are calculated by Hydrogen Bond Donor/Acceptor Plugin. The following figure shows the atomic data and overall multiplicity of hydrogen bond donor and acceptor at a given pH for the corresponding atoms of PEBTH
The distribution the multiplicities of the weighted average hydrogen bond donor and acceptor over the set of microspecies of PEBTH at a given pH can be calculated by using this plugin and for PEBTH molecule it is as follows (fig 15) and it also shows the distribution of their occurrences at a pH range
 |
Figure 15: H bond Donor /Acceptor of EPBTH Click here to View figure |
Huckel Analysis of PEBTH
Structural descriptors for aromatic atoms of PEBTH can be calculated by Huckel Analysis. By using this method for electrophilic and nucleophilic attack Localization energies L(+) and L(-) are determined.According to their localization energies in E(+) or in Nu(-) attack the order of atoms are adjusted. Also with the help of Hückel method the total π energy, the π electron density and the total electron density can also be determined.
Atoms like B, C, N, O, S, F, Cl, Br, I have optimal Coulomb and resonance integral parameters depending on the chemical environment. The following figure (fig 16) shows the calculated values of Huckel Analysis results at the atoms in the aromatic ring of PEBTH 17-19 and these values are result of aromatic E (+) Nu(-) order calculation
 |
Figure 16: Huckel Analysis of PEBTH |
Refractivity of PEBTH
It is to be noted that the refractivity is based on the volume of the molecules and dispersive forces 20. Atomic method as given by Viswanadhan et al. is used for calculation of refractivity . The results of this calculation of PEBTH are displayed in 2D or 3D with the value of refractivity (the dimension is 106⋅[m3⋅mol-1]) as given in the following figure (fig 17).
 |
Figure 17: Refractivity of PEBTH |
Conclusion
These results show the application of Marvin Sketch 20.8 software for characterization of the compound N’-[(1E)-1-phenylethylidene]-1,3-benzothiazole-2-carbohydrazide(PEBTH).
Conflict of Interest
There is no conflict of interest.
Funding sources
There is no funding sources.
References
- G. Audi, A.H.Wapstra, The 1995 update to the atomic mass evaluation, Nuclear Physics A, Vol. 595, Issue 4, pp. 409-480, 1995;
CrossRef - E. A. Hill, On A System Of Indexing Chemical Literature; Adopted By The Classification Division Of The U. S. Patent Office., J. Am. Chem. Soc., 22(8), pp. 478-494, 1900;
CrossRef - Adam C. Lee and Gordon M. Crippen , Journal of Chemical Information and Modeling 2009 49 (9), 2013-2033 , DOI: 10.1021/ci900209w
CrossRef - Viswanadhan, V. N.; Ghose, A. K.; Revankar, G. R.; Robins, R. K., J. Chem. Inf. Comput. Sci., 1989, 29, 163-172; DOI: 10.1021/ci00063a006
CrossRef - Klopman, G.; Li, Ju-Yun.; Wang, S.; Dimayuga, M.: J.Chem.Inf. Comput.Sci., 1994, 34, 752;DOI: 10.1021/ci00020a00
CrossRef - PHYSPROP© database
- Csizmadia, F; Tsantili-Kakoulidou, A.; Pander, I.; Darvas, F., J. Pharm. Sci., 1997, 86, 865-871; doi.org/10.1021/js960177k
CrossRef - Miller, K. J.; Savchik, J. A., J. Am. Chem. Soc. , 1979 , 101 , 7206-7213; https://doi.org/10.1021/ja00518a014
CrossRef - Jensen, L.; Åstrand, P.-O.; Osted, A.; Kongsted, J.; Mikkelsen, K.V. J. Chem. Phys. , 2002 , 116 , 4001-4010; https://doi.org/10.1063/1.1433747
CrossRef - J.Gasteiger and M.Marsili: Tetrahedron Vol. 36. , pp. 3219-3288 (1980)
CrossRef - M.Marsili and J.Gasteiger: International Symposium on Aromaticity, Dubrovnik, Yugoslavia , Sept (1979), Croat.Chim.Acta. (1979)
- Steven L. Dixon and Peter C. Jurs: J.Comp.Chem., Vol.13. No.4, 492-504 (1992)
CrossRef - W.J.Mortier, K.V.Genechten and J.Gasteiger: J.Am.Chem.Soc., Vol. 107,829-835 (1985)
CrossRef - Ertl, P., Rohde, B., Selzer, P., J. Med. Chem. 2000, 43, 20, 3714–3717 Publication Date:September 19, 2000https://doi.org/10.1021/jm000942e
CrossRef - Ferrara P,. Apostolakis J., Caflisch A., Proteins 2002,46, 24-33, https://doi.org/10.1002/prot.10001
CrossRef - Hasel W., Hendrickson T., Still W., Tetrahedron Computer Methodology , 1988, Vol. 1, Issue 2, 103- 116; https://doi.org/10.1016/0898-5529(88)90015-2
CrossRef - Isaacs, N.S., Physical Organic Chemistry , John Wiley & Sons, Inc., New York, 1987, ISBN 0582218632
- Streitwieser, A.,Molecular Orbital Theory , John Wiley1961, ISBN 0471833584
- Pirok, Gy. et al.,Making “Real”Molecules in Virtual Space, J. Chem. Inf. Model. 2006 , 46, 563-568
CrossRef - Viswanadhan, V. N.; Ghose, A. K.; Revankar, G. R.; Robins, R. K., J. Chem. Inf. Comput. Sci. , 1989 , 29 , 163-172;https://doi.org/ 10.1021/ci00063a006
CrossRef

This work is licensed under a Creative Commons Attribution 4.0 International License.
About The Author
![]()
A New Edition of Web of Science
Journal Impact Factor
2022: 0.5
Five Year: 0.8
Journal is Indexed in

Cabells Whitelist
![]()


