A Review on Synthesis, Characterization and Applications of Cadmium Ferrite and its Doped Variants
Arun Vijay Bagade1 , Pratik Arvind Nagwade2, Arvind Vinayak Nagawade1, Shankar Ramchandra Thopate3 and Sangita Nanasaheb Pund1*
1Department of Chemistry, Ahmednagar College, Ahmednagar (MS) India.
2Department of Chemistry, Shri Anand College, Pathardi, Ahmednagar (MS) India.
3Department of Chemistry, SSGM, Kopargaon, Ahmednagar (MS) India.
Corresponding Author E-mail: sangitapund2@gmail.com
DOI : http://dx.doi.org/10.13005/ojc/380101
Download this article as:
![]()
Ferrites have gained a lot of attention because of their diverse uses in domains including photocatalytic degradations, gas sensors, electronic devices, organic transformation catalysts, adsorption, and so on. This review focuses on cadmium ferrites and their numerous doped versions' production methodologies, characterization, and applications. The structural, electric, magnetic, and dielectric properties of cadmium ferrites are primarily influenced by the synthesis procedures and circumstances used during preparation. As a result, the main goal of this study was to provide the most often used synthesis processes, such as hydrothermal, co-precipitation, solvothermal, microwave-assisted, micro-emulsion, and solid state, as well as their benefits and drawbacks. Furthermore, the review focuses on the numerous characterization approaches used to investigate features such as optical, structural, magnetic, electric, and dielectric properties of cadmium ferrites. This analysis was further expanded to include applications in some of the most well-studied domains, such as photocatalysis and gas sensing.
KEYWORDS:Applications; Characterization; Cadmium ferrites; Synthesis; Spinel
Introduction
Alloy chemistry has gotten a lot of attention because they were first used in 2500 BC, much before the Bronze Age1. Two or more elements, at least one of which is a metal, combine in varying amounts to generate a binary or ternary single intermetallic phase that is difficult to differentiate from the base metal used. Because of the lower cost and improved structural, electrical, and magnetic qualities, as produced composites outperform their parent. The term ferrite refers to a category of iron oxide compounds that are ferromagnetic in nature and have high permeability and resistance2. The oldest ferrite substance known to prehistoric humans was magnetite (Fe3O4). Because of their wide range of applications in numerous fields, ferrites are thoroughly explored. Drug administration, magnetic resonance imaging, gas sensing, magnetic fluids, catalysis, magnetic recorders, transducers, and electromagnetic wave absorbers are just a few of the promising uses3. Ferrites are classified as spinel [General formula: MFe2O4], magnetoplumbite or hexaferrite [General formula: MFe12O19], and garnet [General formula: M3Fe5O12] depending on crystal forms4-5.
Ferrites are chemical compounds that contain at least one iron (III) ion in their chemical formula. The chemical formula for spinel ferrites is MIIFeIII2O4, where M and Fe represent divalent and trivalent metal ions, respectively. The oxygen ions (blue spheres) in the spinel structure are tightly packed in a face-centered cubic lattice, resulting in two types of interstitial voids for the metal ions, namely tetrahedral (A) (green spheres) and octahedral (B) (red spheres)6, as illustrated in reproduced Fig. 1.
 |
Figure 1: Cubic cell of spinel structure showing tetrahedral & octahedral voids. (Copyright: License No. Open Access) [6] |
The MIIFeIII2O4 spinel ferrite includes 8 tetrahedral and 16 octahedral sites for the residence of divalent and trivalent metal ions7. According to the cation distribution (divalent and trivalent) across tetrahedral and octahedral sites, ferrites are classed as Normal, Inverse, or Mixed kinds. Consider the usual formula of ferrite as (M1-x2+)(Fex3+)[Mx2+Fe2-x3+]O4 to shed light on this classification, where x denotes the degree of inversion and ions outside and within the square bracket occupy A and B sites, respectively. The ferrite is known as normal spinel when x = 0 in the preceding formula. The ferrite is known as inverse spinel when x = 1 in the preceding formula. Finally, when 0 < x < 1 is present, the ferrite is known as mixed spinel8.
ZnFe2O4 is an example of normal spinel ferrite, whereas NiFe2O4 and Fe3O4 are inverse spinel ferrites. Mixed spinel ferrite MnFe2O4 (Mn0.8Fe0.2[Mn0.2Fe1.8]O4) is an example9. The current study examined the benefits and drawbacks of the most regularly used cadmium ferrites production techniques. This review also discusses numerous characterization strategies. Finally, the current research looks at the wide range of uses for cadmium ferrites.
Synthesis
Due to the wide range of uses, there is a lot of research going on in the subject of cadmium ferrite synthesis. Despite this, additional study is needed to synthesize cadmium ferrites that are high in purity, have a regulated size and morphology. There is no complete method for ferrite synthesis published, and most commonly used synthesis procedures have their own strengths and drawbacks. “Bottom-up” and “top-down” synthesis strategies are the two types of synthesis strategies. The atoms/ ions/ molecules are put together to manufacture nanoparticles in the “bottom-up” technique, whereas bulk solids are broken down to nano-sizes in the “top-down” approach, as shown in reproduced Fig. 210,51. Fig. 3 depicts a summary of the cadmium ferrites production methods used.
 |
Figure 2: “Bottom-up” and “Top-down” synthesis strategies. (Copyright: License No. 5052030388527) [10, 51] |
 |
Figure 3: Flow chart for various synthesis routes for cadmium ferrites. |
Co-precipitation
To synthesize uniform size ferrites, it is the most widely used convenient, inexpensive, efficient, and environmentally friendly approach11. The aqueous solutions of divalent and trivalent metal ions are combined in a mole ratio of 1:2 in the co-precipitation process. Metal ions in the form of nitrates, sulphates, chlorides, and tartrates, carbonates, oxalates, citrates, or hydroxides are co-precipitated from an aqueous medium as tartrates, carbonates, oxalates, citrates, or hydroxides using the appropriate precipitants. Using NaOH or ammonia solution, this procedure includes a precise and controlled pH change. Following that, the solution is vigorously agitated under inert conditions in the absence or presence of heat. The breakdown temperatures of the precipitate as obtained are lower than those used in solid-state processes. After drying, the precipitate is calcined to the required temperature to generate cadmium ferrite nanoparticles. Despite its advantages, co-precipitation has significant drawbacks, such as difficulty controlling pH. Fig. 4 shows a general schematic diagram for the manufacture of Cd ferrites and their doped variants.
 |
Figure 4: General schematic diagram for Cd ferrites and its doped variant synthesis by co-precipitation. |
The selected examples of co-precipitations where CdFe2O4 and its doped variation are synthesized are shown in Table 1.
Table 1: Selected examples of co-precipitations.
|
Entry No. |
Cd ferrite and its doped variants synthesized |
Co-precipitant used |
Method description |
Reference |
|
1 |
CdFe2O4 |
NaOH |
Aqueous solutions of Cd chloride (0.1 mol/l) and iron (III) chloride (0.2 mol/l) mixed together and pH is adjusted to 13 by NaOH (3 mol/l). The reaction mixture boiled at 1000C for 0.5 hr. As obtained precipitate washed with DM water, dried at 600C and finally annealed to get Cd ferrite nano-particles. |
[12] |
|
2 |
Co0.5Ni0.5Cd1.5xFe2-xO4 (x= 0.0, 0.1, 0.2, 0.3, 0.4 and 0.5) |
Liquid ammonia |
CdCl2.H2O, ZnCl2, FeCl3.6H2O and CoCl2.6H2O taken in stoichiometric ratio and dissolved in DM water. Liquid ammonia is added to get precipitate which later washed with DM water, dried for 5 hrs at 900C. Lastly precipitate sintered at 8000C for 4 hrs. |
[13] |
|
3 |
Cu1-xCdxFe2O4 (x = 0, 0.2, 0.4, 0.6, 0.8 and 1) |
NaOH |
The 3.0 g PVP were dissolved in 100 ml DM water at 353K and this clear solution is added to 0.2 mmol of iron nitrate and 0.10 mmol of mixture of cadmium nitrate and copper nitrate (Cd, Fe:Cu = 1:2). The reaction is maintained for 2 hrs and later this homogeneous solution transferred to petri dish which is heated 24 hrs at 363K for water evaporation. The dried powder was ground and annealed at 773K for 9 hrs to get Cu-Cd ferrite. |
[14] |
|
4 |
Mg1xCdxFe2O4 + 5% Sm3+ (x= 0, 0.2,0.4,0.6, 0.8, 1.0) |
Ammonium oxalate |
The MgSO4.7H2O, FeSO4.7H2O and samarium sulphate are dissolved in distilled water in desired stoichiometry. The pH of the solution is adjusted to 4.8 by conc, H2SO4. The resulting solution was heated to 800C for 1 hr and then ammonium oxalate added under stirring till complete precipitation occurred. The precipitate was filtered and washed several times with water. The precipitate is dried and presintered at 7000C for 6 hrs and finally sintered at 10500C for 5 hrs. |
[15] |
|
5 |
Mg1xCdxFe2O4 + 5% Y3+ (x= 0, 0.2,0.4,0.6, 0.8, 1.0) |
Ammonium oxalate |
Same as in entry no. 4, only Y(SO4).38H2O is used instead of samarium sulphate. |
[16] |
|
6 |
Cd1−xCoxFe2O4, (x = 0.0, 0.2, 0.4, 0.6, 0.8 and 1.0) |
Sodium tartarate |
The FeSO4·7H2O and 3CdSO4·8H2O are dissolved in de-ionised water in molar ratio of 2:1. The pH of medium maintained below 6 so avoid hydroxide precipitate formation. Then sodium tartarate is added under vigorous stirring. Acetone was added in equal amounts to ensure high yield and fine-grained powders. The formed precipitate calcined at 7000C for 2 hrs. |
[17] |
Sol-gel
During the silica synthesis in the mid-nineteenth century, chemist J. J. Ebelman first published the sol-gel method. It’s a well-known bottom-up wet chemical approach18. This approach entails two main reactions: (1) hydrolysis of the precursor in an acidic or alkaline medium, and (2) subsequent polycondensation of the hydrolyzed product19. To make reactive monomers, partial hydrolysis of metal alkoxides or metal chlorides is used. Following that, through condensation, these monomers form colloid-like oligomers (sol formation). In addition, hydrolysis promotes polymerization, which leads to the production of a three-dimensional matrix (gel formation)20. Fig. 5 depicts the primary reactions in the sol-gel technique: metal alkoxide hydrolysis and condensation.
 |
Figure 5: Sol-gel reaction scheme. |
The sol-gel process is widely utilized because it is cost-effective, does not require specific equipment, and operates at a temperature range of 25-200°C, which is significantly lower than that of traditional solid-state reactions. The sol-gel process can be used to make ferrites with precise shapes such as microspheres, fibers, and flower-like structures with a limited size distribution. Aside from these appealing properties, key downsides of this technique include lower purity ferrites due to by-product degradation and the usage of organic solutions, which can be hazardous21. Fig. 6 depicts the flow chart for ferrite production using the sol-gel method.
 |
Figure 6: Flow chart for ferrite synthesis via sol-gel method. |
The selected instances of the sol-gel approach where CdFe2O4 and its doped variation are made are included in Table 2.
Table 2: Selected examples of sol-gel method.
|
Sr. No. |
Cd ferrite and its doped variants |
Chelating agent or fuel used |
Chelating agent/ fuel to nitrate ratio |
Method description |
Structural properties |
Reference |
|
|
Lattice constant (Å) |
Crystallite size (nm) |
||||||
|
1 |
Cd1-xNixFe2O4 (x= 0.0 & 0.5) |
Urea |
2.17 : 1 |
Cd1-xNixFe2O4 prepared by mixing of aqueous solutions Cd nitrate, Ferric nitrate & Ni nitrate stoichiometric quantities. This homogeneous solution is calcined at 4000C in muffle furnace. At the end, solution get ignited to form foamy ferrite powder. |
CdFe2O4 = 8.432, Cd0.5Ni0.5Fe2O4= 8.417 |
CdFe2O4 = 24.73, Cd0.5Ni0.5Fe2O4= 17.70 |
[22] |
|
2 |
Cd1-xNixFe2O4 (x= 0.4 to 0.6) |
Urea |
Depends on reducing & oxidising element |
Cd1-xNixFe2O4 prepared by mixing of aqueous solutions Cd nitrate, Ferric nitrate, Ni nitrate & urea stoichiometric quantities. This homogeneous solution is then heated for 2 hrs with stirring to form viscous gel. Then gel is fired in microwave, the burnt ferrite powder cooled and ground for 4 hrs. Finally, powder is pressed to from pellet & annealed at 8000C for 4 hrs. |
Cd0.6Ni0.4Fe2O4= 8.612, Cd0.4Ni0.6Fe2O4= 8.518 |
Cd0.6Ni0.4Fe2O4= 19.48, Cd0.4Ni0.6Fe2O4= 14.47 |
[23] |
|
3 |
CdxZn1-xFe2O4 (x= 0.2 & 0.8) |
Urea |
Depends on reducing & oxidising element |
Cd1-xNixFe2O4 prepared by mixing of aqueous solutions Cd nitrate, Ferric nitrate, Zn nitrate & urea stoichiometric quantities. This homogeneous solution is then heated at 800C for 4 hrs with stirring to form viscous gel. Then gel is fired in microwave in 3 min, the burnt ferrite powder cooled and ground. Finally, powder is pressed to from pellet & annealed at 8000C for 4 hrs. |
Cd0.2Zn0.8Fe2O4= 8.51, Cd0.8Zn0.2Fe2O4= 8.67 |
Cd0.2Zn0.8Fe2O4= 19.48, Cd0.8Zn0.2Fe2O4= 21.42 |
[24] |
|
4 |
CdFe2O4 |
Template-assisted sol-gel method |
Alcoholic mixture of isopropyl alcohol (5mol) |
CdFe2O4 sol is synthesized by dropwise addition of an alcoholic mixture (IPA & Water) to to the alcoholic mixture of Ferric nitrate & Cd nitrate (Mole ratio 2 : 1). The prepared sol is aged for 168 hrs then heated at 80∘C for 48 hrs with stirring & calcined at 400∘C for 1 h in air. The calcined powder is ground for 45 min then pressed to form pellet. The pellet is sintered at 600∘C for 3 h in air. |
¯¯¯¯ |
Average particle size 43 nm |
[25] |
|
5 |
Mg1-XCdxYyFe2-YO4 (x = 0.2, 0.4, 0.6 and y = 0, 0.075) |
Citric acid |
3.0 : 1.0 |
The nitrates and citric acid are dissolved in distilled water to form the homogeneous solution. The pH is adjusted to 7.00 by liquid NH3. This solution is then heated at 80∘C for 4-5 hrs with stirring to form sol. Lastly, after auto-combustion ash converted into ferrite powder. The powder finally sintered at 4000C for 2 hours. |
8.3601 to 8.3658 |
24.2 to 17.79 |
[26] |
|
6 |
Ni0.9Cd0.1GdxFe2−xO4 (x = 0, 0.1, 0.2 and 0.3) |
Ethylene glycol |
¯¯¯¯ |
The metal nitrates are dissolved in ethylene glycol. The sol is heated 600C to obtain wet gel. Further wet gel is heated to 1200C for 6 hrs which is self-ignited to form Ni0.9Cd0.1GdxFe2−xO4 powder. Finally, powder is ground & annealed at 4000C for 2 hrs. |
Ni0.9Cd0.1Fe2O4 0.8402 nm |
¯¯¯¯ |
[27] |
|
7 |
Mn1‒xCdxFe2 O4 (x = 0.0, 0.2, 0.4, 0.6, 0.8) |
Citric acid |
¯¯¯¯ |
The metal nitrates & citric acid are dissolved in minimum quantity of DM water. The resulting solution is heated 65-700C to obtain homogeneous form. The pH is adjusted to 7.00 by NH3. Further mixture is heated to 90-950C to evaporate residual water. The resulting viscous brown gel is self-ignited to form loose fluffy powder. Finally, powder is ground & annealed at 9000C for 5 hrs. |
8.508 to 8.643 |
31.214 to 41.856 |
[28] |
Solid State Reactions
Solid-state reactions are commonly used to make polycrystalline solids from a mix of solid reactants. Because a mixture of solids does not react at room temperature for a long period of time, a high temperature is used to initiate the reaction (chemical breakdown of reactants). These reactions are influenced by morphological and chemical features of the reactants, such as free energy change, surface area, and reactivity29. These reactions aren’t just for forming complex oxides; they’re also used to create sophisticated materials like piezoelectrics. Physical mixing of simple oxides, hydroxide, nitrates, carbonate, oxalates, alkoxides, sulphate, or other metal salts is followed by high temperature treatment, usually between 1000 and 1500°C, to generate a new solid composition with gas evolution30. Solid-state processes have several advantages, including the ability to create ferrite materials with minimum knowledge of material science, high yield, low pollution, and large-scale production31. However, as compared to the above-mentioned co-precipitation approach, the resulting powder has coarse grain size, strong agglomeration, and hence structures with comparatively large particle size, very low surface area, and low homogeneity, all of which are significant negatives. Because of the high temperatures required for solid state reactions, undesired phases develop from time to time, which can be difficult to regulate. Grinding, on the other hand, can introduce contaminants into the powder, causing crystal structural stresses and so affecting magnetic characteristics32.
The effect of ceria addition on the structural characteristics of Cd ferrite was investigated by Abbas K. Saadon33. The Cd ferrites were made using the traditional ceramic process, which involved combining Fe2O3 and CdO in a 1:1 ratio with acetone. The blended powder was dried in a 5000C oven for 2 hours. The dried and cooled powder was then combined in a ball mill for 1 hour before being sintered at 10000C for 2 hours. By ball milling for 1 hour with acetone, CeO2 (0.5, 0.75, 1.0, 1.5, 2.0, and 2.5 wt percent) was blended with synthetic Cd ferrite. Finally, the powder is pressed with 5% PVA to produce a 20mm diameter pellet that is sintered for 3 hours at 12000C. XRD and SEM methods were used to characterize the produced composites.
Kaimin Shih et al.34 used a solid-state process to explore the formation of CdxNi1-xFe2O4 by integrating Cd and Ni into haematite. Ball-milling was used to mix the precursors CdO, NiO, and α-Fe2O3 for 1.0 hour. The mixed powders were baked in a vacuum oven at 105°C for 24 hours before being homogenized in an agate mortar for 10 minutes. Under 250 MPa axial pressure, the dried mixes were crushed into 20 mm diameter pellets. Finally, CdxNi1-xFe2O4 particles (x= 0.0, 0.1, 0.3, 0.5, 0.7, 0.9, and 1.0) were made by sintering formed pellets for 3 hours at temperatures ranging from 700 to 950°C.
N. M. Deraz and M. M. Hessien35 used a typical ceramic technique to make pure Cd ferrite and Al2O3/MgO doped versions. To produce pure Cd ferrite, an equimolar combination of Cd nitrate and α-Fe2O3 was impregnated, dried, and then thermally treated at 500-12000C for 3 hours.
Cd nitrate, α-Fe2O3, and a calculated amount of aluminum and magnesium nitrate were also dissolved in minimal water, mixed, dried at 1000C, and then calcined for 3 hours at 500-12000C. XRD, DSC, FTIR, SEM, and VSM were used to characterize the pure Cd ferrite and composites formed. P. B. Belavi et al.36 used the double sintering ceramic process to make Cd1-xNixFe2O4 (x= 0.1, 0.2, 0.3). As a starting material, CdO, NiO, and Fe2O3 were used. In an agate mortar, these precursors were thoroughly combined in the appropriate stoichiometry for several hours. The samples were then pre-sintered at 800°C for 8 hours before being cooled to room temperature in the air. After cooling, the samples were milled for one hour. Using a hydraulic press, these homogenized samples were combined with 2-3 drops of PVA as a binder and pressed into a 13 mm pellet. Finally, these pellets were sintered for 12 hours at 1150°C and cooled to room temperature in the air. XRD, IR, SEM, EDX, and VSM were used to characterize the produced Cd1-xNixFe2O4 particles. The electrical and dielectric characteristics of the material were also assessed.
 |
Figure 7: General schematic diagram for Cd ferrites and its doped variant synthesis by solid-state reaction. |
Fig. 7 shows a general schematic diagram for the production of Cd ferrites and their doped variants using a conventional solid-state process.
Microemulsion
Schulman et al. were the first to coin the term “microemulsion” in 1959. A colloidal suspension that is macroscopically homogeneous, isotropic, and thermodynamically stable is referred to as a microemulsion. With the help of a surfactant, two immiscible liquids exist in a single phase in this approach37. Oil in water (O/W), Water in oil (W/O), and Water in supercritical CO2 (W/sc-CO2) are examples of microemulsions. When water (aqueous phase) is dispersed as microdroplets and covered by a monolayer of surfactant molecules in a hydrocarbon-based continuous phase, a Water in Oil (W/O) microemulsion is created (Oil). The Oil in Water (O/W) microemulsion, on the other hand, contains dispersed organic droplets in an aqueous continuous phase, which reduces the need of organic solvent and is thus environmentally friendly. In Fig. 8, the W/O and O/W microemulsions are summarized and reproduced with permission from Maqsood Malik et al work38.
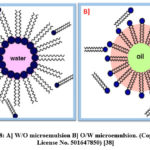 |
Figure 8: A] W/O microemulsion B] O/W microemulsion. (Copyright: License No. 501647850) [38] |
Zaheer Gilani et al39 used this approach to make Co0.5Cd0.5BixFe2-xO4 using (x = 0.0, 0.05, 0.1, 0.15, 0.2, and 0.25). The microemulsion process is straightforward and can create cadmium ferrite with a homogeneous size distribution and regulated characteristics. Apart from these benefits, this approach has drawbacks such as high cost, limited yield, impurity in adsorbing surfactant on nanoparticle surfaces, and the need for a considerable amount of solvent40.
Hydrothermal and Solvothermal method
Roderick Murchison, a British geologist, was the first to create the word “hydrothermal.” Inorganic synthesis is dominated by the hydrothermal and solvothermal methods. Chemical reactions in hydrothermal synthesis take place in aqueous solutions above the boiling point of water, but in solvothermal synthesis, non-aqueous solvents are utilized and reactions take place at quite high temperatures. That is to say, hydrothermal and solvothermal procedures are named for the solvent used in the synthesis reaction41.
The solutions are subjected to high temperatures (almost 2000C) and pressures (usually greater than 125 atm) in high pressure reactors (autoclaves) in this approach42. The majority of trivalent transition metal and divalent metal salts are dissolved separately in solvent and then combined in a 2:1 ratio. To make a homogenous solution, solvents such as ethylene glycol or ethanol are added. In a high-pressure reactor, this reaction mixture is subjected to high pressure. The type, particle size, and morphology of ferrite particles are determined by the heating temperature, duration, and pressure43. Low cost, low reaction temperature, ecologically friendly, exclusion from further calcination, narrow particle size distribution, product with excellent magnetic behavior, and practicality for large-scale manufacturing are all advantages of this approach44. The slowness of the reaction is a major drawback of the hydrothermal approach. Fig. 9 depicts a general schematic diagram for the hydrothermal/solvothermal approach.
 |
Figure 9: General schematic diagram for Cd ferrites and its doped variant synthesis by hydrothermal method |
Hydrothermal and solvothermal method are successfully employed for synthesis of CdFe2O4 nano powder45, CdFe2O4-rGO composite46,47, Mn1-xCdxFe2O4 (X= 0.0, 0.1, 0.3 and 0.5) powder48, CdxNi1-xAlyFe2-yO449, CoLixCdxFe2-2xO4 (x= 0.05, 0.1, 0.15, 0.2, 0.25)50 and many more.
Spray pyrolysis
Spray pyrolysis is a method of forming a thin coating of cadmium ferrite and its doped variations by spraying a precursor solution over a heated surface. At the deposition temperature, the reactants are chosen in such a way that by-products are volatile51. Spray pyrolysis method52 has three basic steps: precursor solution preparation, aerosol formation and deposition, and synthesis process. This process has several advantages, including cost effectiveness, equipment simplicity, efficiency, and the ability to generate thin films with a wide substrate surface area. Spray pyrolysis has a number of disadvantages, including vapour convection and poor thin film quality53.
The CdFe2O4 thin film was made by Veerappan Nagarajan and Arunachalam Thayumanavan and used for electro-resistive detection of formaldehyde and ethanol vapours54 and benzene vapours55. K. M. Jadhav et al.56 synthesized Ni1-xCdxFe2O4 thin films (where x = 0.0–1.0 in steps of 0.2) by using the following experimental parameters: solution concentration 0.1 M, volumetric ratio 1:2, deposition temperature 3600C, annealing temperature 5000C for 4 hours, spray rate 2 mL/min, distance between substrate and nozzle 25 cm, and air pressure 0.30 MPa.
Characterization Techniques
To investigate the various physicochemical features of cadmium ferrite, various methodologies for characterization of nano ferrite are required. Thermogravimetry and Differential Thermal Analysis (TG-DTA), Fourier Transform Infrared Radiation spectroscopy (FT-IR), UV-Vis spectroscopy, Vibrating Sample Magnetometer (VSM), Dynamic Light Scattering (DLS), Brunauer-Emmett-Teller (BET), Transmission Electron Microscopy (TEM), and Scanning Electron Microscopy (SEM) are some of the techniques used.
X-ray Diffractometry
Max von Laue was the first to propose the XRD technique in 1912. The XRD technique can be used to analyse attributes such as crystalline grain size, crystalline phase presence, phase composition, XRD density, flaws and stresses present in the crystal, lattice parameter, and unit cell characterisation. This method uses constructive X-ray interference with a crystalline material. X-rays are generated using a cathode ray tube and then filtered to produce monochromatic X-rays in this process. The monochromatic X-ray beam produced is focused on the Cadmium ferrite sample. After that, the diffracted rays’ scattering angles and intensities are recognised, processed, and shown as peaks in an XRD graph57.
A well-known and simple expression called Debye-Scherrer equation is used to obtain the crystallite size as follows58:
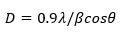
Where, D= crystallite size (in nm), λ= X-ray wavelength (λ= 1.5406 Å), θ= Bragg’s angle (in radians), β= full width at half maximum of the peak (in radians).
The lattice parameter (a) is calculated by applying following formula59:
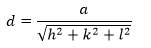
Where, d= interplanar distance, while, h, k and l are the miller indices.
By using lattice parameter value, true density (X-ray density) is calculated by following relation59:

Where, M= Molecular weight of the sample, N= Avagadro number, a= lattice parameter.
Furthermore, the porosity (p) of the ferrite sample is can be calculated as follows59:

Where, D= apparent density of the sample which is calculated by Archimedes principle i.e. by weighing the ferrite sample and dividing by its apparent volume.
The reproduced Fig. 10 shows representative XRD of Ni-Zn ferrite synthesized by the ceramic method by P. S. Patil et. al60.
 |
Figure 10: XRD patterns of CdxNi1-xFe2O4 samples. (Copyright: License No. 5052631255642) [60] |
Fourier Transform Infrared Spectroscopy
It is the most widely used method for determining the functional groups of produced Cd ferrites. To do this, the sample is bombarded with IR between 400 and 4000 cm-1, and the absorbance of these radiations by ferrite is measured to determine the molecular structure. It’s worth noting that IR radiation rarely generates electrical excitation; instead, it induces vibration excitation, which means that the bond joining atoms or groups of atoms vibrates faster. The FT-IR spectrometer produces an IR spectrum by plotting the substance’s absorbance of infrared light against its wavelength61. The reproduced Fig. 11 shows a sample FT-IR spectrum of yttrium substituted Cd ferrite prepared by Muhammad Imran Arshad et al62 using the co-precipitation method. The lower and upper frequency bands (v2 and v1) in the ranges of 540.95 to 565.71 cm-1 and 419.31 to 417.02 cm-1, respectively, are attributed to stretching vibrations caused by M-O interactions when metal ions are in tetrahedral and octahedral voids63.
 |
Figure 11: FT-IR spectrum of Cd1-xYxFe2O4, (X = 0.00, 0.125, 0.250, 0.375, 0.500) (Copyright: License No. 5052681041074) [62] |
UV–Vis Diffuse Reflectance Spectroscopy
The optical band gap is determined using this method. Bonding or non-bonding electrons absorb energy from UV radiation and are stimulated to the anti-bonding orbital in UV spectroscopy. The band gap energy (direct or indirect bandgap, Eg) between the valence and conduction bands of cadmium ferrite is calculated using UV-Vis DRS. Tauc plot is the most commonly used approach for this purpose. The Tauc plot calculates the Eg using the following equation64:
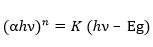
Where, α = Absorption coefficient, hν = Energy of incident photon, n = Constant which depends upon nature of transition i.e., 2 for direct allowed transition and ½ for indirect allowed transition, K = Energy independent constant, Eg = Band gap energy.
The absorption coefficient (α) can be calculated by following formula:
Lastly, by plotting a graph of (αhν)2 verses hν and extrapolating the linear part of the curve to (αhν)2 = 0 the direct bandgap (Eg) is determined.
Muhammad Imran Arshad et. al62 prepared Cd1-xYxFe2O4 (X = 0.00, 0.125, 0.250, 0.375, 0.500) samples and evaluated their bandgaps. Author found that bandgap decreases as Y doping increases. The reproduced Fig. 12 (with permission) shows that the band gap of Cd1-xYxFe2O4 decreases from 3.6011 – 2.8153 eV for X = 0.00 – 0.500.
 |
Figure 12: UV–Vis with Eg for Cd1-xYxFe2O4. (Copyright: License No. 5053211164578) [62] |
Scanning Electron Microscopy
The morphological characteristics of the resulting nano-ferrite are examined using SEM. It creates images by scanning a ferrite surface with electrons of high energy65. When these focused electrons collide with the ferrite surface, they interact with the various atoms in the ferrite, producing secondary electrons, heat, backscattered electrons, visible light, distinctive X-ray, diffracted backscattered electrons, and other signals. Backscattered electrons are responsible for rapid phase discrimination and secondary electrons are responsible for showing topography and morphology of Cd ferrite66. Secondary electrons are responsible for showing topography and morphology of Cd ferrite, a characteristic X-ray commonly used for elemental analysis.
M. Saravanan and T.C. Sabari Girisun67 synthesized two CdFe2O4 samples using a simple combustion process and annealing at 5000C (sample a) and 8000C (sample b). With permission, SEM Fig. 13 demonstrates that sample (a) has a porous, spongy, and network-like structure, whereas sample (b) has a spherically homogenized structure.
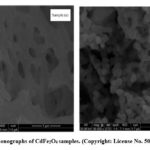 |
Figure 13: SEM monographs of CdFe2O4 samples. (Copyright: License No. 5053251492395) [67] |
Similarly, A. K. Nandanwar et al68 used the Sol-gel micro-oven approach to manufacture Cd1-xNixFe2O4 samples (x= 0.4 and 0.6) whose SEM image is reprinted with permission as Fig. 14.
 |
Figure 14: SEM monographs of Cd1-xNixFe2O4 samples. (Copyright: License No. 5053440648513) [68] |
Transmission Electron Microscopy
Another essential approach for studying the morphology and structure of cadmium ferrite is transmission electron microscopy. A high-voltage electron beam is sent through a ferrite sample to create a picture in this approach. Cadmium ferrite samples are typically analyzed as an ultrathin film (100 nm) or as a suspension on a carbon-coated copper grid. In a TEM, electrons are created from a tungsten filament cathode and accelerated in the vacuum tube of the microscope. Later, an electromagnetic lens is used to focus electrons into a narrow beam that is conducted through ultrathin ferrite samples and then scatters or strikes the electron beam sensitive fluorescent screen at the microscope’s bottom to form a picture69.
N. M. Deraz and M. M. Hessien35 used a typical ceramic technique to make pure Cd ferrite. To synthesize pure Cd ferrite samples A, B, and C, an equimolar mixture of Cd nitrate and α-Fe2O3 was impregnated, dried, and then thermally treated at 900, 1100, and 12000C for 3 hours. Agglomeration with particle sizes higher than 100 nm can be seen in Cd ferrite calcined at 9000C (Fig. 15 A). The authors also noticed variations in the size and form of ferrite particles as the calcination temperature increased. The quasi-spherical morphology of Cd ferrite calcined at 1100 and 12000C (Fig. 15 B and C) revealed reduced particle sizes. Fig. 15 is a representative Transmission Electron Microscopy image of Cd ferrite that has been reproduced with permission.
 |
Figure 15: TEM image of CdFe2O4 calcined at 900, 1100 and 12000C. (Copyright: License No. 5053471351410) [35] |
Thermogravimetry and Differential Thermal Analysis
Thermogravimetry is one of the most precise and quick methods for determining the thermal events that occur when cadmium ferrite is heated. Simultaneous thermal analysis (TG-DTA) is a technique for tracking sample mass versus temperature and time in a controlled environment furnace70. The TG indicates the temperatures at which reduction, decomposition, and oxidation take place, whereas the DTA determines whether decomposition is endothermic or exothermic. This technique offers several advantages, including the need for a small sample size, minimal cost, and the ability to perform qualitative or quantitative analysis. TGA is a destructive technique, which is one of its key drawbacks71.
S. V. Prabhakar Vattikuti et al.72 used co-precipitation to make Cd0.5Co0.5Fe2O4 nanoparticles. Researchers investigated the temperature stability of manufactured nanoparticles, and the TG-DTA curve is reprinted with permission as Fig. 16.
 |
Figure 16: TG–DTA curves of Co0.5Cd0.5Fe2O4 nanoparticles. (Copyright: License No. 5053710166439) [72] |
Authors showed from Fig. 16 total weight loss observed about 28.62 % and there is negligible weight loss after 7900C which ascribed to the stable phase formation of Cd0.5Co0.5Fe2O4 nanoparticles. In the DTA curve, the first exothermic peak is observed below 1000C which is attributed to evaporation of trapped solvent and absorbed water. Next major exothermic peak is observed at 3350C which is ascribed to decomposition of inorganic salts. The prominent weight loss is observed at 6280C.
Applications
Cadmium ferrites and their doped versions have piqued researchers’ interest due to their unrivalled physicochemical features, including as electrical, magnetic, dielectric, and optical capabilities. Cadmium ferrites and their doped versions are used in a variety of fields.
Sensors
Cadmium ferrites, as well as their doped versions, are widely used in gas and electrochemical sensing. Surface character, particle size, lattice defects, and adsorbed oxygen all influence the gas response of a gas sensing material (Cd ferrite)73. Table 3 summarizes some of the selected examples.
Table 3: Cadmium ferrites and its doped variants as sensors.
|
Sr. No. |
Cd ferrite and its doped variants synthesized |
Synthesis method |
Sensing property for |
Method description |
Reference |
|
1 |
Al0.5Cd0.5Fe2O4 |
Co-precipitation |
Relative Humidity |
Al0.5Cd0.5Fe2O4 sensor response and sensor recovery time are 5.5 s and 8 s, respectively. The sensitivity value at 1 kHz in 15% RH and 90% RH is 0.83 and 0.48, respectively. |
[74] |
|
2 |
Cu0.5Cd0.5LaxFe2-xO4 (x= 0, 0.05. 0.1, 0.15, 0.2) |
Sol-gel auto-combustion |
Ammonia |
Sensing property measured at 10 ppm concentration. Excellent properties like response time 12 s, recovery time 60 s and moderate sensitivity observed for x= 0.1 |
[75] |
|
3 |
CdFe2O4 |
Sol-gel self-combustion |
LPG, Ethanol, Acetone |
Maximum selectivity observed at 3500C for gas concentration of 150 ppm. |
[76] |
|
4 |
CdFe2O4 |
Solid state reaction |
Ethanol, Formaldehyde, Toluene, Benzene, Ammonia |
Strongest response for formaldehyde is 14.71 at 2600C while for ethanol it is 12.51 at 3000C. For 1000 ppm ethanol, response time and recovery time are 2 s and 8 s, respectively. For 1000 ppm methanal, response time and recovery time are 5 s and 18 s, respectively. |
[73] |
|
5 |
Cd1-xNixFe2O4 (x= 0.0, 0.5) |
Sol-gel auto-combustion |
Relative Humidity |
Response time and recovery time are 123 s and 154 s when ferrite sample is moved from 25% RH to 95% RH and 95% to 25% RH, respectively at room temperature. |
[77] |
|
6 |
CdFe2O4 |
Spray Pyrolysis |
Ethanol and Formaldehyde |
For ethanol: Detection range- 15 75 ppm, Limit of detection 15 ppm, Response time 21 55 s, Recovery time 29 49 s, operating temperature- ambient. For methanal: Detection range- 15 75 ppm, Limit of detection 15 ppm, Response time 9 29 s, Recovery time 11 25 s, operating temperature- ambient. |
[54] |
|
7 |
CdFe2O4 |
Spray Pyrolysis |
Benzene |
Detection range- 15 75 ppm, Response time 15 47 s, Recovery time 11 45 s, operating temperature- ambient i.e. 300K. |
[55] |
|
8 |
5% Y3+ added Mg1-xCdx Fe2O4 (x = 0, 0.2, 0.4, 0.6, 0.8 and 1) |
Co-precipitation by oxalate |
LPG, Cl2, Ethanol |
Maximum sensitivity of 85% is observed at 218 & 1970C at x= 0 & 0.2, respectively for LPG. Maximum sensitivity of 79% is observed at 2180C at x= 0 for Cl2. Maximum sensitivity of 89% is observed at 3250C at x= 1.0 for ethanol |
[78] |
|
9 |
5% Sm3+ added Mg1-xCdx Fe2O4 (x = 0, 0.2, 0.4, 0.6, 0.8 and 1) |
Co-precipitation by oxalate |
LPG, Cl2, Ethanol |
Response time and recovery time are 180 s and 225 s for LPG at x= 1.0 and operating temperature 3300C. Response time and recovery time are 180 s and 225 s for Cl2 at x= 1.0 and operating temperature 3300C. Response time and recovery time are 210 s and 290 s for ethanol at x= 1.0 and operating temperature 3300C. |
[79] |
|
10 |
CdFe2O4 |
Co-precipitation by NaOH |
CO, H2, LPG, C2H5OH and C2H2 |
Best sensitivity for CdFe2O4 appears at 2500C for 2000 ppm LPG. CdFe2O4 is more sensitive to LPG, C2H5OH and C2H2 while less sensitive to H2 and CO. Authors also studied relationship between sensitivity and concentration of gas (1000 to 6000 ppm). |
[80] |
|
11 |
CdFe2O4 |
Co-precipitation by Ammonium carbonate |
Ethanol, CO, H2 and i-C4H10. |
The sensitivity is as high as 90 for 200 ppm to ethanol vapor, it reaches to 7.5, 4 and 5 to 1000 ppm CO, H2 and i-C4H10. |
[81] |
Photocatalysis
Because photocatalysts may generate electron-holes, they are frequently used for water pollution treatment, bacterial control, water splitting, and other applications82-83. A photocatalyst with a narrow band gap allows solar energy to be converted and used for reduction and oxidation processes84. Cadmium ferrites and their doped versions have proven to be outstanding photo-degradation candidates. Table 4 summarizes some of the selected examples.
Table 4: Cadmium ferrites and its doped variants as photocatalyst.
|
Sr. No. |
Catalyst |
Synthesis method |
Amount of catalyst (g/L) |
Pollutant/ Dye |
Pollutant/ Dye concentration (mg/L) |
Irradiation source |
Irradiation time (min) |
Degradation (%) |
Reference |
|
1 |
CdFe2O4, Cd0.6Mg0.4Fe2O4, CdFe2O4 @ rGO & Cd0.6Mg0.4Fe2O4 @ rGO |
Co-precipitation |
0.1 |
Methylene Blue |
5 |
Visible Light (200 W) |
80 |
9.72, 20.10, 24.70 & 75.67 |
[85] |
|
2 |
Ni1-xCdxCeyFe2-yO4-rGO |
Co-precipitation with ultrasonication |
0.2 |
Methylene Blue |
5 |
Visible Light (200 W) |
120 |
98.24 |
[86] |
|
3 |
CdxZn1-xFe2O4 (where x = 0.0, 0.3, 0.7, 1.0) |
Co-precipitation |
— |
Methyl Orange |
10 |
Sun-light |
240 |
— |
[87] |
|
4 |
Mn0.8Cd0.2Fe2O4 |
Co-precipitation |
0.05 to 0.1 |
Reduction of Cr (VI) to Cr (III) |
15 |
UV irradiation |
60 |
96 |
[88] |
|
5 |
CdFe2O4 |
Solid-state reaction |
— |
Degradation of acetic acid |
— |
Xenon lamp (300 W) |
360 |
Amount of CO2 generated 148 μmol/g |
[89] |
|
6 |
Aluminium doped CdFe2O4 |
Co-precipitation |
— |
Malachite Green |
— |
UV irradiation |
80 |
Up-to 100 |
[90] |
Other
Cadmium ferrites and their doped variations are used in a variety of fields in addition to the ones described above:
N. Rezlescu et al.91 used a self-combustion process to make CdFe2O4. XRD, SEM-EDAX, and BET are used to characterize the generated ferrite material. The Cd ferrite powder was used to investigate the combustion reactions of diluted gasses such as methanol/air, acetone/air, and ethanol/air at temperatures ranging from 20 to 500 degrees Celsius. Acetone, methanol, and ethanol have combustion temperatures of about 425, 375, and 350 degrees Celsius, respectively.
S. R. Bhongale et al.92 used the oxalate co-precipitation method to synthesise MgxCd1-xFe2O4 (x = 0, 0.2, 0.4, 0.6, 0.8, and 1.0) and analysed it using XRD, SEM, VSM, and FT-IR techniques. Synthesized ferrites have grain sizes ranging from 2 to 6.5 m. The authors found that as Mg2+ content increases, the real component of permittivity (ἐ) drops and the dielectric loss tangent increases up to x = 0.6, then decreases. Mg0.4Cd0.6Fe2O4 sample has highest -10 dB bandwidth.
Conclusion
Synthesis, characterization, and performance evaluation of ferrite materials for various applications have been a growing study area for more than 50 years. This is due to exceptional physicochemical features such as electrical, magnetic, dielectric, and optical properties, among others. Co-precipitation, Sol-gel technique, Solid-state processes, Microemulsion, Hydrothermal and Solvothermal, Spray pyrolysis, and many more methods can be used to make CdFe2O4 and its doped versions; each method has its own set of advantages and disadvantages. The physical properties of synthesized ferrites are largely determined by the synthesis procedures and processing conditions used. As a result, new synthesis procedures are required at this time, with benefits such as efficiency, cost effectiveness, environmental friendliness, uniform and narrow size distribution with best magnetic behavior, large-scale production feasibility, and high yield, among others. XRD, FT-IR, UV-DRS, SEM, TEM, TG-DTA, VSM, and other techniques are used to characterize the produced CdFe2O4 and its doped variations. Finally, the most well-studied application sectors, such as gas sensing and photocatalysis, are described.
Acknowledgement
The authors would like to thank the CSIR and UGC for fellowships to this work.
Conflict of Interest
We wish to confirm that there is no conflict of interest associated with the present publication.
Funding Sources
There is no funding source.
References
- Rickard, T. A. The use of meteoric iron, J. R. Anthropol. Inst., 1941, 71, 55–66.
CrossRef - Iqbal, M. A.; Islam, M. U.; Ali, I.; Khan, M. A.; Sadiq, I.; Ali, I. J. Alloys Compd., 2014, 586, 404.
- Ngo, A. T.; Pileni, M. P. J. Phys. Chem. B, 2001, 105(1), 53–58.
CrossRef - Roess, E. IEEE Trans. Magn., 1982, 18, 1529.
CrossRef - Ozgüri, U.; Alivov, Y.; Morkoc, H. J. Mater. Sci. Mater. Electron., 2009, 20, 789.
CrossRef - Issa, B.; Obaidat, I. M.; Albiss, B. A.; Haik, Y. Int. J. Mol. Sci., 2013, 14, 21266-21305.
CrossRef - Sickafus, K. E.; Wills, J. M.; Grimes, N. W. J. Am. Ceram. Soc., 1999, 82, 3279–3292.
CrossRef - Gomes, J. A.; Sousa, M. H.; Tourinho, F. A.; Mestnik-Filho, J.; Itri R.; Depeyrot J. J. Magn. Magn. Mater., 2005, 289, 184–187.
- Kefeni, K. K.; Msagati Titus, A. M.; Mamba, B. B. Mater. Sci. Eng. B, 2017, 215, 37–55.
CrossRef - Rawat, R. S. Journal of Physics: Conference Series, 2015, 591, 012021.
CrossRef - Amiri, S.; Shokrollahi, H. J. Magn. Magn. Mater., 2013, 345, 18–23.
CrossRef - Yokoyama, M.; Sato, T.; Ohta, E.; Sato, T. J. Appl. Phys., 1996, 80 (2).
CrossRef - Kulkarni, A. B.; Hegde, N. D.; Shashidhara Gowda, H.; Mathad, S. N. Macromol. Symp., 2020, 393, 1900213.
- Ghasemi, R.; Echeverría, J.; Pérez-Landazábal, J. I.; Beato-Lopez, J. J.; Naseri, M., Gómez-Polo, C. J. Magn. Magn. Mater., 2019, https://doi.org/ 10.1016/ j.jmmm.2019.166201.
CrossRef - Gadkari, A. B.; Shinde, T. J.; Vasambekar, P. N. J. Magn. Magn. Mater., 2010, 322(3), 823–3827.
CrossRef - Gadkari, A. B.; Shinde, T. J.; Vasambekar, P. N. Mater. Chem. Phys., 2009, 114, 505–510
CrossRef - Nikumbh, A. K.; Nagawade, A. V.; Tadke, V. B.; Bakare, P. P. J. Mater. Sci., 2001, 36, 653–662.
CrossRef - Aegerter, M. A.; Mennin, M. Sol-Gel Technologies for Glass producers and Users, Kluwer Academic Publishers, ISBN 978-1-4419-5455-8.
- Pena-Pereira, F.; Duarte, Regina M.B.O.; Duarte, A. C. Trends in Analytical Chemistry (TrAC), 2012, 40, 90-105.
CrossRef - Brinker, C. J.; Scherer, G. W. Sol-Gel Science: The Physics and Chemistry of Sol-Gel Processing-Academic Press, 1990, ISBN 978-0-12-134970-7.
- Modan, E. M.; Plaiasu, A. G. The Annals Of “Dunarea De Jos” University of Galati Fascicle IX. Metallurgy and Materials Science, DOI:https://doi.org/10.35219/mms.2020.1.08
CrossRef - Chethan, B.; Ravikiran, Y. T.; Vijayakumari, S. C.; Rajprakash, H. G.; Thomas, S. Sens. Actuators A, 2018, 280, 466-474.
CrossRef - Nandanwar, A. K.; Sarkar, N. N.; Sahu, D. K.; Choudhary, D. S.; Rewatkar, K. G. Materials Today:Proceedings, 2018, 5, 22669–22674.
CrossRef - Nandanwar, A. K.; Chaodhary, D. L.; Kamde, S. N.; Choudhary, D. S.; Rewatkar, K. G. Materials Today:Proceedings, 2020, 29(3), 951-955.
CrossRef - Ismail, S. M.; Labib, Sh.; Attallah, S. S. Journal of Ceramics, 2013, 526434, 8 pages.
CrossRef - Bhise, R. B.; Rathod, S. M. Int. Res. J. of Science & Engineering, 2018, Special Issue A2: 49-54.
- Jacob, B. P.; Thankachan, S.; Xavier, S.; Mohammed, E. M. Phys. Scr., 2011, 84, 045702.
CrossRef - Dubey, H. K.; Lahiri, P. Adv. Perform. Mater., 2021, 36(3), 131-144.
CrossRef - Cho, S. J.; Uddin, M. J.; Alaboina, P. “Emerging Nanotechnologies in Rechargeable Energy Storage Systems”, 2017, 83-129, doi:10.1016/b978-0-323-42977-1.00003-0.
CrossRef - Buekenhoudt, A.; Kovalevsky, A.; Luyten, Ir J.; Snijkers, F. Basic Aspects in Inorganic Membrane Preparation in “Comprehensive Membrane Science and Engineering”, 2010, 1, 217-252.
- Dao-hua, L.; Shao-fen, H.; Jie, C.; Cheng-yan, J.; Cheng Y. IOP Conf. Ser.: Mater. Sci. Eng.,2017, 242, 012023.
CrossRef - Yu, H. F.; Huang, K. C. J. Mater. Res., 2002, 17, 199.
CrossRef - Saadon, A. K. Energy Procedia, 2019, 157, 561–567.
CrossRef - Su, M.; Liao, C.; Chan, T.; Shih, K.; Xiao, T.; Chen, D.; Kong, L.; Song, G. Environ. Sci. Technol., 2018, 52, 775−782.
CrossRef - Deraz, N. M.; Hessien, M. M. J. Alloys Compd., 2009, 475, 832–839.
CrossRef - Chavan, G. N.; Belavi, P. B.; Naik, L. R.; Bammannavar, B. K.; Ramesh, K. P.; Kumar S. International Journal of Scientific & Technology Research (IJSTR), 2013, 2(12), 82-89.
- Santra, S.; Tapec, R.; Theodoropoulou, N.; Dobson, J.; Hebard, A.; Tan W. Langmuir, 2001, 17, 2900–2906.
- Malik, M. A.; Wani, M. Y.; Hashim, M. A.Arab. J. Chem., 2012, 5(4), 397-417.
CrossRef - Sheikh, F. A.; Khalid, M.; Shifa, M. S.; Huda Khan Asghar, H M N. ul.; Aslam, S.; Perveen, A.; Rehman, J. ur.; Khan, M. A.; Gilani, Z. A. Chin. Phys. B, 2019, 28(8), 088701.
- Kaur, M.; Kaur, N.; Vibha Chapter 4 Ferrites: Synthesis and Applications for Environmental Remediation, 2016, DOI: 10.1021/bk-2016-1238.
CrossRef - Feng, S.; Li, G. Chapter 4- Hydrothermal and solvothermal syntheses, Modern Inorganic Chemistry, 2011, 63-95.
CrossRef - Sharifianjazi, F.; Moradi, M.; Parvin, N.; Nemati, A.; Rad, A. J.; Sheysi, N.; Abouchenari, A.; Mohammadi, A.; Karbasi, S.; Ahmadi, Z.; Esmaeilkhanian, A.; Irani, M.; Pakseresht, A.; Sahman, S.; M. Shahedi Asl Ceram. Int., 2020, 46, 18391–18412.
CrossRef - Pauline, S.; Amaliya, A. P. Arch. Appl. Sci. Res., 2011, 3, 213–223.
- Wongpratat, U.; Maensiri, S.; Swatsitang, E. Microelectron. Eng., 2015, 146, 68–75.
CrossRef - Shi,W.; Liu, X.; Zhang, T.; Wang, Q.; Zhang, L. RSC Adv., 2015, 5, 51027.
CrossRef - Saravanan, M.: Sabari Girisun, T. C.; Vinitha G.J. Mol. Liq., 2018, 256, 519–526.
- Saravanan, M.; Sabari Girisan, T. C.; Venugopal Rao, S. J. Mater. Chem. C, 2017, 5, 9929-9942.
CrossRef - Mostafa, N. Y.; Zaki, Z. I.; Heiba, Z. K. J. Magn. Magn. Mater., 2013, 329, 71–76.
CrossRef - Wolska, E.; Wolski, W.; Kaczmarek, J.; Piszora, P. Solid State Ion., 1997, 101-103, 1069-1074.
CrossRef - Rasheed, S.; Khan, R. A.; Shah, F.; Ismail, B.; Nisar, J.; Shah, S. M.; Rahimd, A.; Khan, R. J. magn. Magn. Mater., 2019, 471, 236-241.
- Kafle, B. P. Chemical Analysis and Material Characterization by Spectrophotometry, 2020, 147-198.
- Falcony, C.; Angel Aguilar-Frutis, M.; García-Hipólito, M. Micromachines, 2018, 9, 414, 1-33.
CrossRef - Tahir, M. B.; Rafique, M.; Rafique, M. S.; Nawaz, T.; Rizwan, M.; Tanveer, M. Nanotechnology and Photocatalysis for Environmental Applications, Micro and Nano Technologies, 2020, 119-138.
- Nagarajan, V.; Thayumanavan, A., Microchim Acta., 2018, 185,319.
CrossRef - Nagarajan, V.; Thayumanavan, A., Appl. Phys. A, 2018, 124, 155, 1-8.
CrossRef - Kardile, H. J.; Somvanshi, S. B.; Chavan, A. R.; Pandit, A. A.; Jadhav, K. M. Optik, 2020, 207, 164462.
- Lamas, D. G., Neto, M. de Oliveira.; Kellermann, G.; Craievich, A. F. Nanocharacterization Techniques Micro and Nano Technologies, 2017, 111-182.
- Kumar, C. G.; Pombala, S.; Poornachandra, Y.; Agarwal, S. V. Nanobiomaterials in Antimicrobial Therapy, Applications of Nanobiomaterials, 2016, 6, 103-152.
- Nikumbh, A. K.; Nagawade, A. V.; Gugale, G. S.; Chaskar, M. G.; Bakare; P. P. J. Mater. Sci., 2002, 3(7), 637–647.
- Karanjkar, M. M.; Tarwal, N. L.; Vaigankar, A. S.; Patil, P. S. Ceram. Int., 2013, 39, 1757-1764.
CrossRef - Silverstein, R.; Webster, F.; Kiemle, D., Spectrometric Identification of Organic Compounds, John Wiley and Sons Inc., New York, 2006.
- Amin, N.; Ul Hasan, M. S.; Majeed, Z.; Latif, Z.; un-Nabi, M. A.; Mahmood, K.; Ali, A.; Mehmood, K.; Fatima, M.; Akhtar, M.; Arshad, M. I.; Bibi, A.; Iqbal, M. Z.; Jabeen, F.; Bano, N., Ceram. Int., 2020, 46(13), 20798-20809.
CrossRef - Ahmad, T.; Lone, I. H.; Ansari, S. G.; Ahmed, J.; Ahamad, T.; Alshehri, S. M. Materials & Design, 2017, 126, 331-338.
CrossRef - Tauc, J.; Grigorovici, R.; Vancu, A. phys. stat. sol., 1966, 15, 627.
CrossRef - McMullan, D. Scanning electron microscopy 1928-1965, Scanning, 1995, 17, 175–185.
CrossRef - Baillot, R.; Deshayes, Y. Tools and Analysis Methods of Encapsulated LEDs, Reliability Investigation of LED Devices for Public Light Applications,2017, 43-106.
- Saravanan, M.; Sabari Girisun, T. C., Mater. Chem. Phys., 2015, 160, 413-419.
CrossRef - Nandanwar, A. K.; Sarkar, N. N.; Sahu, D. K.; Choudharya, D. S.; Rewatkar, K. G., Materials Today: Proceedings, 2018, 5, 22669–22674.
CrossRef - Senthil Kumar, P.; Grace Pavithra, K., Naushad, Mu. Nanomaterials for Solar Cell Applications, 2019, 97-124.
CrossRef - Tomoda, B. T.; Yassue-Cordeiro, P. H.; Vaz Ernesto, J.; Lopes, P. S.; Peres, L. O.; da Silva, C. F.; de Moraes, M. A. Biopolymer Membranes and Films, Health, Food, Environment, and Energy Applications, 2020, 67-95
- Dollimore, D., Thermal analysis, Anal. Chem., 1994, 66 (12), 17–25.
CrossRef - Venkata Reddy Ch., Chan Byon; Narendra, B.; Baskar, D.; Srinivas, G.; Jaesool Shim.; Prabhakar Vattikuti, S. V. Superlattices and Microstructures, 2015, 82, 165-173.
CrossRef - Cao, Y.; Qin, H.; Niu, X.; Jia, D. Ceram. Int., 2016, 42(9), 10697-10703.
CrossRef - Sasmaz Kuru, T.; Sentürk, E. Sensors and Actuators A, 2016, 249, 62–67.
CrossRef - Tumberphale, U. B.; Jadhav, S. S.; Raut, S. D.; Shinde, P. V.; Sangle, S.; Shaikh, S. F.; Al-Enizi, A. M.; Ubaidullah, M.; Mane, R. S.; Gore, S. K. Solid State Sciences, 2020, 100, 106089.
- Rezlescu, N.; Rezlescu, E.; Tudorache, F.; Popa, P. D. Romanian Reports in Physics, 2009, 61(2), 223-234.
- Chethan, B.; Ravikiran, Y. T.; Vijayakumari, S. C.; Rajprakash, H. G.; Thomas, S. Sens. Actuators A: Physical, 2018, 280, 466-474.
CrossRef - Gadkari, A. B.; Shinde, T. J.; Vasambekar, P. N. Sensors & Transducers Journal, 2012, 146 (11), 110-120.
- Gadkari, A. B.; Shinde, T. J.; Vasambekar, P. N. Sensors and Actuators B, 2013, 178, 34– 39.
CrossRef - [80] Chen, N. S.; Yang, X. J.; Liu, Er-Sheng.; Ling Huang J. Sensors and Actuators B, 2000, 66, 178–180.
- Tianshu, Z.; Hing, P.; Jiancheng, Z.; Lingbing, K. Materials Chemistry and Physics, 1999, 61, 192-198.
- Dutta, P. K.; Pehkonen, S. O.; Sharma, V. K.; Ray, A. K., Environ. Sci. Technol., 2005, 39, 1827–1834.
- Hoffmann, M. R.; Martin, S. T.; Choi, W.; Bahnemann, D. W. Chem. Rev., 1995, 95, 69– 96.
CrossRef - Casbeer, E.; Sharma, V. K.; Zhong, X. Separation and Purification Technology, 2012, 87, 1–14.
CrossRef - Shahid, M. Ceram. Int., 2020, 46(8) Part A, 10861-10870.
CrossRef - Rahman, A.; Aadil, M.; Akhtar, M.; Warsi, M. F.; Jamil, A.; Shakir, I.; Shahid, M. Ceram. Int.,2020, 46, 13517–13526.
CrossRef - Harish, K. N.; Bhojya Naik, H. S.; Prashanth kumar, P. N.; Viswanath, R. Catal. Sci. Technol., 2012, 2, 1033–1039.
CrossRef - Ali, I. O.; Mostafa, A. G. Mater. Sci. Semicond. Process., 2015, 33, 89–198
- Tezuka, K.; Kogure, M.; Shan, Y. J. Catal. Commun., 2014, 48, 11–14.
CrossRef - Hegazy, E. Z.; Kosa, S. A.; Abd Elmaksod, I. H.; Mojamami, J. T. Ceram. Int., 2019, 45, 7318–7327.
CrossRef - Rezlescu, N.; Rezlescu, E.; Popa, P. D.; Popovici, E.; Doroftei, C.; Ignat, M. Mater. Chem. Phys., 2013, 137, 922-927.
CrossRef - Bhongale, S. R.; Ingawale, H. R.; Shinde, T. J.; Pubby, K.; Narang, S. B.; Vasambekar, P. N., J. Magn. Magn. Mater., 2017, 441, 475–481.
Second Review by: Dr. A. V. P. Rao
Final Approval by: Dr.Nenad Ignjatovic


![]()


