Doped Ceria Catalyst System: Catalyzing Carbon Monoxide Transformation
Mayankkumar Lakshmanbhai Chaudhary1 and Rawesh Kumar2*
1Department of Chemistry, Sankalchand Patel University, Visnagar, Gujarat, India, 384315.
2Department of Chemistry, Indus University, Ahmedabad, Gujarat, India, 382115.
Corresponding Author E-mail: kr.rawesh@gmail.com
DOI : http://dx.doi.org/10.13005/ojc/370601
Article Received on : 08-Oct-2021
Article Accepted on :
Article Published : 03 Dec 2021
Reviewed by: Dr. A. Z. Ahmady
Second Review by: Dr. Rafid Saad Dawood
Final Approval by: Dr. Abdul Wahab Omri
As ceria chemistry broadens, it is needed to generalize the behavior of ceria surfaces towards molecules for carrying out a reaction. The endowing capacity of mobile oxygen due to rapid redox switching between Ce+4/Ce+3 is a key point for ceria containing surfaces. Herein we have presented a review which is broadly divided into two parts. First part focuses on surface property as how electronic structure, vacancy and surface energy would be modified after interaction of ceria with dopant (noble metal, metal of variable oxidation state, higher valent metal and lower valent metal). The second part focuses on catalysis as how the doped ceria surface influences the carbon monoxide transformations (CO oxidation, CO and H2O reaction, CO and NO reaction, CO and H2 reaction). This through study will be helpful to predict the ceria surface for a designed reaction.
KEYWORDS:CO oxidation; CO and H2 reaction; CO and H2O reaction; CO and NO reaction; Doped Ceria surface
Download this article as:| Copy the following to cite this article: Chaudhary M. L, Kumar R. Doped Ceria Catalyst System: Catalyzing Carbon Monoxide Transformation. Orient J Chem 2021;37(6). |
| Copy the following to cite this URL: Chaudhary M. L, Kumar R. Doped Ceria Catalyst System: Catalyzing Carbon Monoxide Transformation. Orient J Chem 2021;37(6). Available from: https://bit.ly/3Dox1fP |
Introduction
Ceria has received much attention from the catalyst community vis-à-vis material science community due to its high oxygen capacity, oxygen mobility, beautiful redox chemistry and wide range of acidity-basicity profile. Among CeO2/Ce2O3, TiO2/Ti2O3, V2O5/VO2/V2O3 and MoO3/MoO2 redox couple; CeO2/Ce2O3 shows lowest reduction energy of about 0.2eV.1 So, it shows quick Ce+3/Ce+4 redox cycle which results into higher oxygen mobility than other redox couple 2. The ceria chemistry becomes more meaningful after doping with non-redox or redox dopant to enhance its property and especially oxygen vacancy and high temperature sustainability. 3,4 Ceria crystallizes in a cubic fluorite structure (Fm3m crystal structure). Every cerium cation is surrounded by eight equivalent oxygen ions whereas every oxygen ion is fenced by a tetrahedron of four equivalent cerium ions 5(Figure 1). (111), (110), and (100) planes of ceria have surface energies in the following order (111) < (110) < (100). That means, the cubic fluorite structure of ceria exposes its most thermodynamically stable plane (111).6 It is major fraction of active surface where the oxygen end up of stoichiometric O-Ce-O tri-layers are arranged along (111) direction.7 (111) and (100) planes have ending of oxygen layer at first layer and thereafter alignment of Ce atoms in a second layer underneath the surface of atoms. In the (111) surface plane, coordination numbers (CNs) of oxygen is 3 in first layer and coordination numbers of ceria is 7 in second layer. In 100 surface plane s, CNs is 2 (of O in first layer) and 6 (of Ce in second layer) respectively, 10 surface plane has Ce atom in 6 fold coordination and O atoms in 3-fold coordination ,respectively. The surface relaxation effect of (111) planes is lowest but it is extra obvious for (110) and (100) planes.
Apart from these, ceria nanorods expose primarily the (110) surface, which is the most reactive surface 8,9 whereas ceria nano cubes, exposing the (100) surface. The reactivity of ceria nano cube lies between nanorods and nanoparticles 10 i.e., Au–ceria low index faces catalyze steam reforming of methanol (SRM) and water gas shift reaction (WGSR) at low temperatures.
 |
Figure 1: (A) Ce+4 at corners of fluorite structure (B) Ce+4 at face of fluorite structure (C) Overall, ceria fluorite structure |
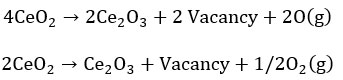
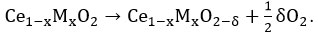
Let us understand the ceria redox property and oxygen vacancy formation from bulk fluorite structure, 4Ce+4 valences is satisfied by 8o-2 and unperturbed unit cell formula is Ce4O8 or 4CeO2. During annealing or any process or naturally, if two vacancies are created in place of two oxygen, there are four excess electrons near to Ce+4 and by capturing one electron by each Ce+4, it is 4Ce+3 is balanced by 6O2-. The total unit cell formula is Ce4O6 or 2Ce2O3. On applying 0.26 eV, an oxygen vacancy is formed if two of the four nearest neighbouring Ce(IV)cations have been arbitrarily replaced with Ce(III).14 O2p → Ce4f electron transition becomes more importance for oxygen vacancy generation because the energy gap of O2p → Ce4f is only 1.8 eV than the energy gap of O 2p → Ce 5d (5.5eV). The vacancy formation [DS23] can be shown in the form of equation as shown below:
On the slightly reduced surface, single oxygen vacancies (either on the surface region or subsurface region) prevail. Surface vacancy is appeared as depressions surrounded by three paired lobes and subsurface vacancy appear s as triple protrusions centered on third-layer oxygen sites. In the case of surface vacancy, a positive electrostatic field is centered on the vacancy site that repels the nearest neighbor “Ce cations” with more extent and attracts
second nearest neighbor “O anions” to a lesser extent. As a consequence, six atoms relax 0.08 to 0.09 Å outward which cause lobes formation. For subsurface vacancy, the electrostatic field is centered below the surface and three atoms relax 0.19 Å outward. After vacancy formation, two excess electrons on oxygen return to two of Ce+4 and make a relatively larger Ce+3 ion. The relatively larger Ce(III) ion (than Ce (IV) ion) pushes neighboring “O” atoms farther away and thus the threefold symmetry of vacancy sites is destroyed. Upon further reduction, two oxygen vacancies along with four excess electrons (localized on four Ce ions in the first cerium layer) are formed. This vacancy is known as linear surface oxygen vacancy (LSVC). Three oxygen vacancies along with the six excess electrons (localized on five Ce ions in the first cerium layer and one Ce ion in the second layer) are also noticed. This vacancy is known as double linear surface oxygen vacancy (D-LSVC). If reduction is continued, the length distribution profile is simply moved to longer defect lengths.
Gibbs free reaction energy(∆Gd) and total energies (∆Ed) for the O defect formation reaction can be expressed as below
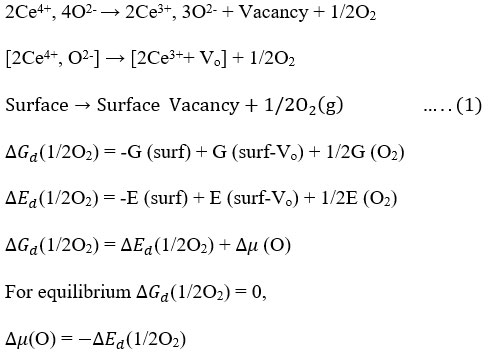
The change in the oxygen chemical potential and negative oxygen-defect formation energy are equal. Defect formation energies and entropy changes of Δμ (O) at given temperature T and pressure p can be shown as15
∆μ(O) = ½ [H (T, po) – H (0K, po) – TS (T,po) + RT ln(p/po)]
So, finally decreasing the pressure at a given temperature or increasing the temperature at given pressure shifts the equilibrium of equation (1) towards more surface vacancy formation.
Ceria interaction with dopant
Electronic structure of ceria lattice has been changed after doping with iso-valent, lower valent and higher valent dopant (than ceria) (Figure 2). In the bulk ceria, “oxygen vacancy formation energy” or oxygen storage capacity of ceria can be estimated according to the following equation
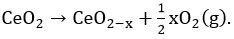
16 On addition of dopants/promoters, lattice contraction or lattice expansion happens by which vacancy formation energy is modified further 17 and can be estimated based on the following modified equation as
Overall, the oxygen vacancy formation energy (Ef) of modified ceria can be calculated as
Ef is deconvoluted into two main components, the first one is interaction energy from metal to oxygen (Eint) and the next one is relaxation energy (Erel). The interaction energy is energy required to remove the oxygen atom which is bonded to the “M” atom within Cδe1 – xMxO2– δ structure. Relaxation energy is energy gain from the structural relaxation of Ce1 – xMxO2– δ structure. Interaction energy is more dominant in Sm and Pu doped ceria lattice whereas relaxation energy is more important in Fe, Ru, and Os doped ceria lattice. 18 In the case of Sm doped ceria lattice, all the reaction enthalpies are positive which indicate that the reduction of Ce1–xMxO2 is thermodynamically unfavored at 0 K. Under inert and oxidizing condition, oxygen vacancy formation energy follows the order of conductivity of dopant as well as polaron mobility as trivalent > tetravalent > undoped. In the reducing condition, the trend is diverted.19
Ceria interaction with higher valent or isovalent dopant
Higher valent dopant (than parent cation) replaces the parent cation and binds the oxygen atoms more tightly in their neighborhood. The tight packing of surface oxygen does not enhance oxidation reaction. However, these dopants can adsorb O2 from the gas phase and can activate adsorbed molecular oxygen for oxidation reaction. 20 Tetravalent dopants generate more numbers of charge carriers than trivalent ions. It causes higher electronic conductivity for M4+ and larger number of oxygen vacancy formation. When ceria is replaced by Zr4+, Zr4+ is non-reducible and smaller than Ce4+ (72 pm Vs 87 pm). Thus, structure relaxation effects lower the defect formation energy. So, vacancy due to ceria reduction is formed rapidly and yielding the superoxo species like “O._” . Dopants like “Ru” are isovalent as well as reducible like Cerium. After substitution of Ce ion by Ru ion, Ru4+/Ru3+ redox couple and Ce4+/Ce3+ redox couple compete with each other. Additionally in the doped lattice, Longer Ce−O and Ru−O bonds (compared to individual metal oxides CeO2 and RuO2) are formed which activates lattice oxygen. 21
Ceria interaction with lower valent dopant
Lower valent dopant (than parent cation) replaces the parent cation and binds the oxygen atoms less tightly in their neighborhood. It tends to weaken the bonds of the oxygen atoms and this oxygen is more suited for an oxidation reaction. 22–26 “Projected density of states” examination also shows formation of electron deficit centres on incorporation of low-valence dopants which weakens the bond of the electrophilic oxygen atoms to the ceria surface. 27 When ceria is replaced by lower valence ions during doping, both structure relaxation and electronic structure affect the vacancy formation. Substitution of a Ce (IV) by an M (II) ion [DS24] creates two holes additionally which are localized on oxygen atoms in the neighborhood of dopants. 28,29 Overall, doping with Pd, Ni and Cu leads spontaneous O-vacancy formation. In the case of Cu doping, second vacancy formation needs about 0.4 eV less energy (than undoped ceria surface).30 Larger size lower valent dopants like Sr (II) and Ba (II) (than Ce (IV)) have more distant oxygen ions. It causes an average increase in M-O bond length 2.48 Å in Sr (II) and 2.58 Å in Ba (II) (than 2.37 Å in pure ceria). Similar size lower valent dopant
like Ca (II) brings M-O bond lengths to 2.41 Å. The smaller size lower valent dopant like Mg(II) pulls the surrounding oxygen ions closer and M-O bond length limits to a distance of 2.32 Å. Again smaller size lower valent dopants like Be(II) has a number of stable configurations specially tetrahedral coordination. Transition metal dopants when placed in cubic Ceria lattice, it experiences a cubic crystal field splitting. 31 Zn (II) has filled d orbital (d10), ligand field splitting of d orbital is[DS24] not relevant and it attains distorted tetrahedral configuration. Cu (II) undergoes a Jahn-Teller like distortion and Ni (II) system relaxes to a distorted octahedral configuration. The magnitude of the d-d splitting in Ni (II) is less than Pt (II) or Pd (II) due to much more diffuse 4d and 5d orbitals (in case of Pt, Pd) than the 3d orbital (in case of Ni).
 |
Figure 2: Electronic structure of ceria lattice after (A) doping with isovalent atom (B) doping with lower valent atom |
Ceria interaction with variable oxidation states dopant
Vanadia interaction with ceria can be understood by electronic effect and structure effect. VO2 species in the gas phase has +4 oxidation state and d1 electronic configuration. But in VO2/CeO2(111) system, V has +5 oxidation state having do configuration by transferring one electron from V 3d1 to Ce 4f1 states. It was verified by XPS and XANES studies. 32–33 On reducible ceria surfaces, tetrahedral O=V(O−)3 species with interphase “O” atom is formed and Ce(IV)ion is reduced to Ce(III)ion.34
How much the monomeric VO2 species are stabilized, the oxidation activity of ceria supported VO2 has increased. Ceria supported VO2 becomes less reactive if VO2 species are polymerized into dimeric and trimeric species. 32,35 The shape of the ceria support effects the termination (as ceria rod is terminated mainly by 110, 100 facets), which in turn affects the oxygen-defect formation energy.36 Surface vanadia peaks of V=O at 1014cm-1 remains preserved during higher loading 2wt%V/CeO2. At more than 5wt%V/CeO2, vanadium oxide is somewhat above the monolayer coverage. Here, crystalline V2O5 Raman bands at 995 cm-1 is detected. 37 At increasing temperature to 400oC, crystalline vandia peak intensity decreases and surface vanadia peak intensity increases which indicate that crystalline vanadia and surface vanadia formations are reversible to each other. However, after 460oC, the different vanadia chemistry is waiting. The surface vanadia peak intensity decreases at temperature 460oC and becomes absent at 490oC. At this temperature, characteristic CeVO4 bands at 146, 215, 259, 369, 458, 768, 774 and 840 cm-1 are appeared which indicate the presence of CeO6 octahedra followed by VO4 tetrahedra through V-O-Ce bonds (in CeVO4) during monolayer vanadia coverage at higher temperature.
Ceria interaction with novel metals after doping
Interaction with Gold
During Au adsorption over the stoichiometric ceria surfaces, the empty nonbonding Ce 4f states is lying just above the Fermi level and so act as an electron acceptor from adsorbed Au atom.38 Terminating oxygen layer of (111) faces has more negative electrostatic potential than at the rest of the surface which stabilizes the adsorbed Au+ at that site.12 Now, a bi-coordination situation from terminating oxygen pair to Au+ cation is arrived which creates significant amount of “sd” hybridization (5dz2orbital with its 6s orbital). Due to spatial redistribution of the charge and minimum conditions between the filled gold’s orbital and ligands, O–Au–O angle is not linear but 130o. Energy for O-vacancy formation of CeO2 (111) supported Au atoms is about half of clean CeO2 surface. On this support, a single Au atom binds with CO strongly due to O2−CeO2−Au−CO complex formation. 39 On the reduced surface, oxygen of the lattice is removed and partially occupied Ce f states are lying just below the Fermi level. It behaves as an electron donor, it stabilizes the adsorbed Au 38 over oxygen vacancy position and Au becomes negatively charged. O-defect sites abundance at CeO2 surface as well as stronger binding of Au atoms at defect sites indicate the cluster grows at defect sites.40 Adsorption of the additional cluster atoms on the surface may cause electron transfer from Au to Ce4+.41,42,43,44 A scheme of interaction of Au over of ceria latticeis presented in Figure 3.
 |
Figure 3: Scheme of interaction of Au over of ceria lattice |
Interaction with Cu, Ag and other Pt
Lower ionization potentials of Cu and Ag cause oxidation readily and electron is transferred from Cun or Agn cluster to Ce easily. M−O and M−M interactions are comparable and the competition between both interactions affects the structure of the cluster. As example, the charge transfer from Cu 3d and 4s states to Ce 4f states increases the electrostatic interaction 45 which can be utilized for H2O dissociation. CO is adsorbed preferably at Pt4 atoms (not on the ceria surface directly) whereas H2 is more likely to adsorb on metal−oxide−gas phase boundary (three-phase boundary). In Rh4/CeO2 system, CO and H2O are adsorbed preferably on top of one of the Rh atoms.46 The density of Pt 5d states is much smaller and close to the Fermi level of the supported system than bulk Pt. So, Pt8 clusters on ceria have enhanced water adsorption and dissociation capacity than a pure Pt (111) surface. 47 A scheme of interaction of Ag over the ceria lattice is presented in Figure 4.
 |
Figure 4: Scheme of interaction of Ag over of ceria lattice |
Reaction over ceria doped ceria surfaces
Quick switch between Ce4+ and Ce3+ enables the ceria lattice to store oxygen under oxidizing condition and releasing oxygen under reducing condition.48 Further on addition of dopant, the Fermi level of oxide changes affecting charge rearrangement during the reaction.49 Fermi energy level may be very high, intermediate and very low which generate positively charged vacancies, neutral vacancy and negatively charged vacancies respectively.50
If a chemical species X adsorbs on a surface site named “A”. After reaction, an oxygen vacancy is created on the same surface site named “B”. During this A→B conversion on the surface, the energy of a filled state (Ef) is created in the gap. If energy of the filled state (Ef) is greater than Fermi energy (EF), there will be electron transfer from the filled orbital of “B” to the Fermi level and reaction energy is dropped by |EF – Ee|. If Fermi energy (EF) is greater than energy of the empty orbital (Ee), there will be electron transfer to B. then |EF – Ee| is energy gain which lowers the total reaction energy as well as activation energy. 51
CO Oxidation
Tabakova et al. found that over oxidized or simply Au/CeO2 system, CO is chiefly adsorbed on Ce+4 and metallic gold sites whereas as in the reduced Au/CeO2 system, CO is chiefly adsorbed on Ce+3 and Auδ− sites. 52 A scheme of interaction of CO over ceria supported Au catalyst (oxidized and reduced surface) is shown Figure 5.
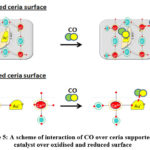 |
Figure 5: A scheme of interaction of CO over ceria supported Au catalyst over oxidised and reduced surface |
When CO is interacted with ceria surface, CO receives the liberated oxygen atom from the ceria lattice and forms carbonate and then oxidised into CO2 and in return a vacancy is generated. Adsorption of O2 into these vacancies yields a peroxo species as [2Ce3+ + Vo] + O2 → [2Ce+4, O22-]. After O2 adsorption, CO adsorption sites are changing of metallic gold to
oxidized gold and reduced Ce+3.53 CO interaction with these types of surfaces causes oxidation of CO by peroxo species by exothermic process which heals the defect as well as regenerate the catalyst again. However, it should be noted that at subsurface vacancy, only one electron is transferred from a Ce3+ ion to O2 which results into formation of a superoxo species as [2Ce3++ Vo] + O2 → [Ce+4, Ce3+, O2.-]. A scheme of reaction of CO over ceria supported Au catalyst (oxidized and reduced surface) is shown Figure 6.
 |
Figure 6: A scheme of reaction of CO over ceria supported Au catalyst over (A) oxidised surface (B) reduced surface. |
Nanocrystalline ceria supported 2.8% gold shows higher activity (by second order of magnitude) than titanium supported 1.5% gold and iron oxide supported 5% gold. 54 At low deposition temperature (∼100 K), gold single atoms interact with ceria surface and Auδ+ species are deposited at low coverage. Due to strong interaction of gold with extended nano-CeOx support, Auδ+ species are present in abundance and it shows resistance against sintering at 300 K.55 At 573oC, Charged Auδ+ is readily transformed into metallic Au particles over CeO2 (111). CO forms fairly stable as well unstable carbonates by the reaction of CO with different pairs of oxygen atoms on the AuxCe1−xO2 surface.23 Stable carbonated remains present during the catalytic reaction whereas unstable carbonates are decomposed readily into CO2 and leave an oxygen vacancy behind. Carbonate is regenerated again at oxygen vacancies by reaction of O2 with CO.
Rod shaped CeO2 nanocrystal, polyhedra shaped CeO2 nanocrystal and cube shaped CeO2 nanocrystal have broad reduction peaks at 573–873 K which is attributed to “surface oxygen removal”. 53 After gold deposition, the reduction peaks are shifted to relatively low temperature with different intensity. Different intensity reduction peaks are closely related to the shape of CeO2. As for “rod shaped CeO2 nanocrystal” supported gold, the intense reduction peak is found at 389 K while for “polyhedral shaped CeO2 nanocrystal” supported gold relatively weak intensity peak is found at 368 K. These peaks are attributed to reductions of cationic Au species as well as reduction of ceria at the gold–ceria interface. The significant desorption of CO and CO2 are noticed > 573K for “cube shaped CeO2 nanocrystal” supported gold, < 573K for “polyhedral shaped CeO2 nanocrystal” supported gold and at both low as well as high temperature for rod shaped CeO2 nanocrystal” supported gold. “Rod shaped CeO2 nanocrystal” supported Au catalyst has (1 1 0) and (1 0 0) dominant planes which are active for cationic Au stabilization during CO/O2 activation. On (1 1 1) and (1 0 0) planes, weak CO adsorption and strong CO adsorption have taken place respectively. Only on (1 1 0) surface, both weak as well as strong absorptions of CO coexist.56 Overall, it can be said that the high activity on “rod shaped CeO2 nanocrystal” supported gold catalyst for the CO preferential oxidation at ambient temperature is due to the shape-mediated physicochemical properties as well as the presence of cationic Au species.57
Isovalent non-reducible
metal like Zr+4 doped ceria surface reduces readily and yields the superoxo species like O.-. When CO is interacting with these ceria surfaces, CO receives superoxo species O.- and forms [DS23] CO2– which can be further decomposed into CO2. A scheme of reaction of CO over Zr+4 doped ceria surfaces is shown Figure 7.
 |
Figure 7: A scheme of reaction of CO over Zr+4 doped ceria surface |
In the case of lower valent
lower valent as La+3, there are superoxo species at each doping centre. When CO is interacted with CeO2 (111) surface, CO receives the oxygen atom from superoxo species and forms CO2.56 CO interacts with the La-doped CeO2 (110) surface and yields carbonate species. However, this carbonate species is less favourable than on the undoped surface. When CO is adsorbed on an oxygen ion adjacent to Au dopant over Au/CeO2 (111) catalyst, it forms very stable carbonates species.23 On the clean ceria (111) surface, only physisorbed CO is observed but physisorbed CO, physisorbed CO2 and chemisorbed CO (carbonate, CO2–) species were noticed over Fe-doped CeO2 (111) surface.58 In first case, surface mechanics of reducible Fe+3 to Fe+2 is considered. In the second case, non-reducible Fe3+ and reduction of two Ce3+ ions is reported.
CO + [Ce4+, La3+, O.-] → [Ce3+,La3+,Vo] + CO2
CO + [Ce4+, O2-, La3+, O.-] → [Ce3+,La3+,Vo] + CO32-
CO + [Ce4+, O2-, Au3+, O.-] → [Ce3+,Au3+,Vo] + CO32-
[Ce4+, O2-, Fe3+, O.-] → [Ce3+, Vo, Fe2+, O.-] + 1/2O2 CO → [Ce3+, Vo, Fe2+,O.-] + CO2
[2Ce4+,2O2-, Fe3+, O.-] → [2Ce3+, 2Vo, Fe3+,O.-] + 2O2 CO → [2Ce3+, 2Vo, Fe3+,O.-] + CO32-
Large size, intermediate size and small size metallic gold are found over Au/CeO2, Au/Zn-CeO2 and Au/Sm-CeO2 catalyst respectively. Smaller gold particle exposes majority of step sites for CO adsorption and so the CO adsorption intensity are found in reverse order of metallic gold size as Au/CeO2 < Au/Zn–CeO2 < Au/Sm–CeO2.53 The H2-TPR profile of Sm or Zn modified CeO2 supported gold particle also showed shift of reduction temperature peak to lower temperature than CeO2 supported gold particle. It indicates the easy reducibility of surface or more mobility of oxygen in lattice after modification with Sm or Zn. Again, La modified CeO2 supported gold catalyst showed shift of reduction temperature peak towards higher temperature which indicates a hardly reducible and less mobile lattice oxygen of La modified catalyst. Peroxo species are also found abundant over Au/Sm–CeO2 and lowest over Au/La–CeO2 catalyst whereas highest dispersion of gold is found over Zn modified ceria supported Au catalyst. Altogether, a catalytic system should high metallic gold dispersion than high CO adsorption steps sites than high abundance of peroxo species or oxygen mobility for higher activity towards CO preferential oxidation ie. Au/La–CeO2 < Au/CeO2 < Au/Sm–CeO2 < Au/Zn–CeO2
1%Gold supported on MnO2-CeO2
composite shows decreased surface concentration of Ce3+ species as well as shift of XPS Mn 2p3/2 peak towards lower binding energy with increasing content of Mn. It indicates electron transfer from Ce (III) to Mn (IV)species during the solid solution formation. 58 This catalyst also showed the presence of metallic as well as non-metallic gold within size less than 5 nm. Due to synergistic effects of MnO2-CeO2 composite oxides, presence of Ce (III) species and coexistence of metallic and nonmetallic gold species, 1% Au/Mn0.5-Ce0.5O2 (calcined at 120oC) has 97.8 % CO conversion and 49.3% CO2 selectivity at 80 °C.59
Overall, it can be concluded that CO preferential oxidation depends on adsorption of CO on oxidized surfaces (over Auo and Ce+4), lattice oxygen mobility from lattice to CO adsorption sites to form carbonate and finally decomposition of carbonate into CO2. High surface area samples provide more surface for adsorption, dopants in ceria lattice provide the facets for efficient CO adsorption, oxygen mobility and readily carbonate decomposition into CO2. The vacancy formed in this turn can be healed by atmospheric oxygen. Adsorption of O2 into these vacancies yields a peroxo species which promotes change in CO adsorption sites from Auo and Ce+4 to Au+d and Ce+3 and further CO interaction with peroxo species.53 This step again generates CO2 as well as heals the defects.
Water gas shift reaction (CO+H2O → CO2+H2)
Over oxidized Au/CeO2 system, CO is chiefly adsorbed over Ce+4 and Au0 sites. As reaction proceeds, IR bands due to CO adsorption sites are disappear whereas IR band due to carbonate and carboxylate species are appear (Table 1A). Over reduced Au/CeO2 system, CO is chiefly adsorbed on Ce+3 and Auδ− sites53. As temperature increases the IR bands centered at CO adsorption sites are disappear and IR bands due to formate species are appear (Table 1B). That may be due to the reaction between “OH-species adsorbed over Ce3+” and “CO-species adsorbed over on Auδ−”. CO is oxidized by surface oxygen species into formate species. Further, formate/ carbonate/Carboxylate species are decomposed into CO2. After H2O absorption, CO adsorption on Auδ− depleted and CO adsorption of metallic and oxidized gold is noticed. H2O is dissociated as H and OH. The dissociated OH form H2O is adsorbed in oxygen vacancy which promotes the chance of oxidation of reduced ceria53. Finally, H2 is released from the surfaces.
Table 1: (A) IR band on oxidized Au/ceria.
|
Disappearing IR band with increasing contact time |
Appearing IR band with increasing contact time |
||
|
2100 cm−1 (Weak band) |
CO on Au0 |
||
|
2151 cm−1 |
CO on Ce4+ cations with different |
1510 |
Carboxylate formed |
|
2170 cm−1 |
CO on Ce4+ cations with different |
1480, 1385, 1356, 1061 and853 cm−1 |
Carbonate |
Table 1: (B) IR band on reduced Au/ceria
|
Disappearing IR band with increasing temperature |
Appearing IR band with increasing temperature |
||
|
2140 cm−1 |
liquid-like CO |
||
|
2157 cm−1 |
CO on Ce3+ sites |
|
|
|
2060 cm−1 |
CO on Auδ− sites |
1585 and 1370 cm−1 |
(OCO) modes of bidentate format species on Ce (III) sites |
|
2040 cm−1 |
Auδ− sites in closer contact with Ce3+–OH. |
2848 cm−1 |
C–H stretching mode of format species on Ce (III) sites |
Rui Si et al. synthesized ceria nanorods, nanocubes and nanopolyhedra by hydrothermal processes and further, gold was deposited over ceria by a deposition/precipitation (DP) method.8 Tabakova et al. found that in the oxidized system, CO is chiefly adsorbed on Ce+4 and metallic gold sites/oxidic gold 52. For nanorods and nanocubes, oxygen storage takes place both at the surface as well as in the bulk. But for nanopolyhedra, oxygen storage takes place only at surface 60. XPS Au(4f) spectra shows that Au+δ is the main species in the nanorod /nanopolyhedra samples and Au0 is dominant in the ceria nanocubes 60. The shift of surface ceria reduction peak to lower temperature in H2-TPR indicates stronger interaction of Au to ceria surface and weakening of Ce-O bonding. Au supported ceria nanorods have highest consumption of H2, polyhedron have intermediate H2 consumption and nanocubes have about no H2 consumption. When 0.8-0.9atom% Au/CeO2 was subjected to NaCN leaching test, 0.5atom% Au remained on nanorod, 0.4atom% on polyhedral and 0.03 atom % on nano cube. Karpenko et al. showed that CO is adsorbed on metallic and cationic gold 49. At lower calcination temperature, higher surface area is prominent, having a higher portion of cationic gold. So, with increasing surface area, CO adsorption occurred predominantly on cationic Aun+ species. So, finally catalytic activity was also found in order nanorod > polyhedral > nano cube.8 Au/CeO2-rod had shown about 100% CO conversion at 250oC whereas Au/CeO2-cube sample showed about 20% CO conversion at 350oC and there is no CO2 selectivity at 150oC. Tabakova et al. had shown that surface carboxylate species bands were formed after CO adsorption on CeO2 surfaces in IR observations, it indicates CO oxidation by surface oxygen species 52. Lots of surface oxygen species creates oxygen vacancy as well as reduction of ceria surfaces. In contact with water, oxygen vacancy is filled and reduced ceria surfaces are oxidized again.
Another preferred CO adsorbent metallic sites are Pt, Pd, and Rh over CeO2 catalyst system. Pd/Iron promoted Ceria is fruitful catalyst selection for water gas shift reaction where Fe from alloy with Pd.61 Thermodynamic driving force for reducing Fe3O4 causes enhanced water gas shift activity. Pd/Fe promoted ceria has increased reaction rate because of enhanced oxygen transfer from Ce to Pd under the influence of iron in intimate contact with Pd. Interestingly when Mo is used as a promoter, a more positive ion on Mo+6 withdraws charge from Ce4+ and makes the Ce–O bond stronger. So, it decreases the ease with which CeO2 reduces. It causes decrease in reducibility for ceria and rate of reaction. Aluminum as promoter may cause higher population of oxygen vacancy and increased stability of gold as well as ceria against agglomeration.62 However, the deeper oxygen vacancies are inaccessible for reoxidation of ceria and productivity is lowered. The said catalyst was deactivated due to improper oxidation of reduced ceria formed after CO oxidation. It can cause an increase in Ce+3 concentration and decrease in cationic gold concentration resulting an additional buildup of monodentate carbonate species 63. For the reactivation, H2O/N2 treatment can be carried out to decrease carbonate intensity. However, O2/N2 treatment can lead to complete carbonate species removal but growth of gold particles that leds irreversible deactivation.
Overall, it can be concluded that water gas shift’s reaction is initiated by CO adsorption over pre reduced ceria surfaces where CO is adsorbed on Auδ− and H over terminal surface oxygen as OH bonded with Ce+3. By reaction of “OH-groups adsorbed on Ce3+” and “CO-species adsorbed on Auδ−”, surface format species are formed and finally decomposed into CO2. Doping of transition metal can speed up any one or more of the processes such as CO adsorption, oxygen mobility, format formation and its decomposition. After H2O absorption, CO adsorption on Auδ− depleted and CO adsorption of metallic and oxidized gold is noticed. H2O is dissociated as H and OH. The dissociated OH form H2O is adsorbed in oxygen vacancy which promotes the chance of oxidation of reduced ceria53 and H2 release from the surfaces. However, on an oxidized catalyst system, mechanisms proceed as CO preferential oxidation, carbonates are formed and decomposed into CO2. The vacancy formed in this turn can be healed by water as discussed in the reduced catalyst system.
Reaction of CO and NO
Pd doped ceria lattice may interact CO and release CO2 and leave a vacancy behind. Further, NO is adsorbed at oxygen vacancies from its “O” ends and in this way N−O bond is elongated 11. Another NO molecule is adsorbed on the Pd center. If two such adsorbed NO molecules are adjacent to each other (closed neighbor), their Nitrogen ends will form a strong N−N bond with minimum barrier. If CO is used in feed, progressive formation of oxygen vacancy during CO oxidation by lattice oxygen facilitates oxygen vacancy for complete NO conversion and 100% N2 selectivity was observed over Pd/CeO2 (111) at 175°C whereas slightly lower N2 selectivity were observed for Rh and Pt on CeO2. NO is more directed by Pd adjacent to oxygen vacancy than Rh1 and Pt1. The reaction is initiated by CO and the lattice oxygen and in turn it generates the oxygen vacancy. Further, two sequential adsorptions of NO at Pd Centre (nearby oxygen vacancy) and at oxygen vacancy center by their N and O end occur respectively which forms N2O2*. Again, oxygen vacancy is created by CO oxidation with lattice oxygen and the formed vacancy stabilizes the N2O2* more. Lastly, scission of two N−O bonds of N2O2* (rate determining step) produces N264. The reaction scheme of NO and CO reaction over Pd1/CeO2(111) catalyst is shown in Figure 8.
 |
Figure 8: Scheme of NO and CO reaction over Pd1/CeO2(111) catalyst [64] |
The reduction of the CeO2 (110) surface by CO followed by subsequent reoxidation of the defective ceria surface with NO2 is examined.65 NO2 is adsorbed in two modes on the defective surface which are involved in reoxidation of Ce (III) ions to Ce (IV) ions and a NO2− adspecies. Lianjun Liu et al. have synthesized Cu/CeO2 nanostructure (rod/polyhedral/cube) by impregnating copper precursor over ceria nanostructures. CeO2 nanostructure was itself prepared by varying the concentration of NaOH and different hydrothermal treatment temperature.66 Liu et al. passed a feed stream (composition, NO 5%, CO 10%, and He 85% by volume) over 50 mg pretreated Cu/CeO2 nanostructure catalyst (pre-treated under N2 stream at 100oC for 1 h) with a space velocity of 15,000 mLg-1h-1 and found 100% NO reduction with CO.
The following order is found over copper containing nanostructures:Surface area by BET surface area analysis: Cu/CeO2 Rod = Cu/ CeO2 polyhedral> Cu/CeO2 polyhedral
Oxygen storage capacity (OSC) per unit area by H2-TPR: Cu/CeO2 Cube > Cu/ CeO2 rod> Cu/CeO2 polyhedral. (Highest in cube due to low available surface area of cube)
Strain order by XRD: Cu/ CeO2 rod> Cu/ CeO2 polyhedra > Cu/ CeO2 cube.
Formation energy of oxygen vacancy 111 > 100 > 110 or Cu/ CeO2 polyhedra > Cu/ CeO2 cube > Cu/ CeO2 rod
Defect concentration order by Raman: Cu/ CeO2 rod> Cu/ CeO2 polyhedra > Cu/ CeO2 cube.
Cu/(Cu+Ce) ratio by XPS: Cu/CeO2 Cube> Cu/ CeO2 polyhedral > Cu/ CeO2rods. (Highest in cube due to low available surface area of cube)
O/(Cu+Ce) ratios by XPS: Cu/ CeO2 cubes> Cu/ CeO2rod> Cu/ CeO2 polyhedra.
(Again, highest in cube due to least oxygen vacancy in cube)O″/(O′+O″) ratios by XPS: Cu/ CeO2 Cube> Cu/ CeO2 polyhedral > Cu/ CeO2 rods. Here O″ is adsorbed oxygen or oxygen in carbonates or oxygen in hydroxyl groups, This ratio O″/(O′+O″) is also highest in cube due to 100 planes of cubes which is most energic and active sites for chemisorption of oxygen from CO2 and H2O. (Where O’’ is adsorbed oxygen or oxygen in carbonates or oxygen in hydroxyl groups)
NO reduction by CO over doped ceria surfaces was chiefly dependent on oxygen storage capacity (to provide instantaneous oxygen during reaction), strain inside the lattice (for provoking the system towards reducing) and defects concentration (to dissociate the NO into N2O and N2 followed by supplying oxygen to the lattice beck). Clearly, high OSC per unit area of the cube can be omitted due to the low available surface area of the cube. After omitting it, the order of OSC is higher in rod than polyhedral and then cube. Lianjun Liu et al. proposed that impregnated Cu+2 also migrate to vacant octahedral sites of surface ceria planes. As the rod exposed 110 planes, migrated Cu+2 would be surrounded by 4 lattice oxygen and one capping oxygen for charge compensation in pentagonal pyramidal manner creating maximum strain. In octahedral exposed (111) planes, it should be surrounded by the same in trigonal bipyramidal manner creating intermediate strain and in the cube exposed (110) plane, Cu+2 was supposed to place in between two 100 planes causing least strain. The order of strain is also verified by XRD that is Cu/CeO2 rod> Cu/CeO2polyhedra> Cu/CeO2 cube. Oxygen vacancy formation energy for different CeO2 surfaces is in the following order 111 > 100 > 110. Reactivity due to oxygen vacancy should be in reverse order of vacancy
formation energy as 110>100>111. Rod has both 110 and 100 planes. After the rod, 100 planes (exposed plane of cube) has lowest vacancy formation energy but it is unstable upon heating (having highest surface energies as surface energy order is 100>110>111). So, a cube is less reactive than polyhedral. The final reactivity order is as follows rods>polyhedral>cubes. The same order is verified by Raman as defect concentration. Above 275oC, all catalytic system are found 100% efficient. Turn over frequency (TOF) per Cu atom showed the following order Cu/CeO2 polyhedral = Cu/CeO2 cubes > Cu/CeO2 rods. It is proposed that at higher temperature copper species are coupled with O-Ce sites and catalyzes NO conversion on the CeO2 (111) surface. XPS shows the absence of Cu+2 state and FTIR verifies the CO adsorption on Cu+ at 2115 cm-1 and CO adsorption on Ce+3 at 2172 cm-1. The presence of Cu+ ions is mainly due to the following redox equilibrium Cu2+ + Ce3+ ⇋ Cu+ + Ce4+. FTIR enlightens more on reaction mechanisms after CO adsorption, it undergoes to bidentate to polydentate formation and finally to CO2 formation. Overall, the reaction scheme can be outlines as shown below:
CO adsorbed on Cu+1 and Ce+3 sites → with lattice oxygen it forms bidentate → It form polydentate → CO2 released
NO adsorbed-on defect sites → decomposition into N2O+N2 + O → O was available to defects sites readily as compensation.
CO hydrogenation
When ceria is exposed to H2, H2 would be adsorbed and on subsequent heating H2O is desorbed and left an oxygen vacancy. It indicates ceria surfaces are hydroxyl enriched before reductive treatment and after reductive treatment (reduced ceria surface) have less hydroxyl and more vacancy. The vacancy may behave as H2 reservoir that is needed for hydrogenation reaction.67
H2 pretreatment→H2O removal→Vacancy formation→Vacancy as H2 reservoir at high H2 pressure
CO to methanol
Yasuyuki Matsumura et al.68 synthesized 15% Pd supported on cerium oxide by coprecipitation method. Prior to a hydrogenation reaction, it is made to reduce in the presence of hydrogen at 300oC or 500oC. If a palladium catalyst is prepared by coprecipitation, there will be strong interaction between ultrafine Pd and Ce support. The cationic Pd species can present under reductive conditions. X-ray photoelectron spectroscopy shows the presence of Pd–O–Ce bond as well as presence of valence of Pd close to +1. Upon reduction of surface ceria, Pd–O–Ce would be affected. X-ray diffraction profiles of these 300oC and 500oC reduced samples show cerium oxide crystallite at 47.5o having size 4 and 9 nm, palladium crystallite at 39.9o having size 3nm and 4nm respectively. XANES for low temperature reduced sample shows the profile of palladium oxide whereas high temperature reduced sample shows the profile of palladium foil. Pd K-edge EXAFS for reduced sample at 300oC shows a major peak for Pd–Pd bonding and a minor peak for Pd–O bonding. On further reduction up to 500oC, the peak for Pd–Pd bonding is intensified which indicates the increasing coordination number of Pd–Pd in the sample reduced at 500oC” than at 300oC”. The major characterization results and catalytic activity over CeO2 supported Pd catalyst are shown in Figure 9.
 |
Figure 9: The major characterization results and catalytic activity over CeO2 supported Pd catalyst. |
15 wt% Pd/CeO2 (pre-reduced under H2 at 300 oC for 1 h) shows high catalytic activity for CO hydrogenation with hydrogen towards methanol in the initial stage of reaction and catalytic activity is stabilized after 15 h on-stream at 200 oC at 2.0 MPa pressure. The catalyst showed 97.6% methanol selectivity, 18.3% methanol yield during 24 h on-stream at 38 h-1 TOF. Higher temperature reduction pretreatment (500oC) causes lower surface area and formation of larger Pd particles. So, such a catalyst showed 97.1% methanol selectivity and only 3.6% methanol yield at 26h-1 TOF. So, at lower temperature reduction pretreatment (300oC), smaller Pd particles are more active in the reaction.
Wen-Jie Shen et al. synthesized69 ceria supported copper catalyst by a co-precipitation method using copper acetate and cerium nitrate precursor solutions. These catalysts are subjected to H2 pretreatment before employing it for CO hydrogenation reaction. XRD and FT-EXAFS of catalysts are performed before and after the reaction. After the reaction for 25 h, the crystalline peak intensities for metallic Cu in 10 wt% Cu/CeO2 catalyst is decreased whereas over 25 wt% Cu/CeO2 and 40 wt% Cu/CeO2 catalyst, Cu2O and CuO crystalline phases are also observed in XRD profile. After the reaction, 14 nm Cu2O crystallite is changed to 32 nm metallic Cu crystallite over 25 wt% Cu/CeO2 catalyst and in the same way 17 nm Cu2O crystallite is changed to 33 nm metallic Cu crystallite over 40wt% Cu/CeO2 catalyst. Over 2 wt% Cu/CeO2 catalyst, the weak FT-EXAFS peak of Cu–Cu interaction and rise of Cu-O interaction after 25 h reaction was observed which indicates high dispersion of metallic copper on lower loading. With increasing Cu loading up to 5wt%, Cu-Cu interactions become stronger. In H2-TPR reduction profile also 2wt% Cu supported over CeO2 showed higher temperature reduction peak than 5wt% Cu supported over CeO2. However, on further increase of Cu loading 5-40% causes increase in the reduction temperature which is attributed to higher aggregation of CeO2 grains about copper particles. Initially as found in FT-EXAFS profile just after pretreatment, metallic Cu particles will be appear that cause low catalytic activity toward CO hydrogenation initially. As time lengths, metallic copper convert into copper oxide and crystallite size of Cu remains constant but copper oxide (Cu2O) crystallite size is half of the metallic copper as found in XRD and FT-EXAFS. This Cu+ species causes high catalytic activity 70–74.The disproportionation reaction of carbon monoxide into “carbon dioxide and carbon” and further under hydrogen, conversion of carbon into methane is proposed 75. In product analysis, small amounts of water, CO2 and methane are detected that signifies a possible oxidation of Cu metal (embedded in aggregated CeO2) by CO2 or water. The reaction of CO and H2 over Ce-Cu alloy possibly forms Cu–O–CH–O–Ce intermediate at the periphery between a Cu cluster and CeO2 during methanol synthesis 76. Later, oxidation to CuO or partial growth of cerium oxide crystallite may be the cause of catalyst deactivation. The activity of 25 wt.% Cu/CeO2 was the remarkable at the initial stage of the reaction (35.0 mol dm-3 h-1 at 0.5 h and 43.9 mol dm-3 h-1 at 6.5 h), But at longer time interval as 24.5 h, the space time yield of methanol was decreased down to ~27% mol dm-3 h-1 .77 For longer time on stream, the activities of lower Cu loading were found beneficial. During 24.5 h, 5wt% Cu/CeO2 and 10 wt.% Cu/CeO2 showed 28.3 mol dm-3 h-1 and 29.4 mol dm-3 h-1 space time yield of methanol respectively. In tearms of temperature, 10wt % Cu/CeO2 shows maximum activity at 195oC than 162oC. The major characterization results and catalytic activity over CeO2 supported Cu catalyst are shown in Figure 10.
 |
Figure 10: The major characterization results and catalytic activity over CeO2 supported Cu catalyst |
So, it can be concluded that pre-reduction treatment and subsequent heating removes water from the surface. It causes less hydroxyl surface and more oxygen vacancy. The vacancy may behave as H2 reservoir for hydrogenation reaction. At lower pretreatment temperature, major presence of Pd–Pd bonding (metallic having smaller Pd crystallite size) and a minor peak for Pd–O bonding is responsible for H2 dissociation and reaction with CO resulting in good catalytic activity towards methanol. However, some disproportional reaction can be accepted (2CO→CO2 + C) which yields methane/ethane after dissociated Hydrogen interaction. In the case of Cu based systems, metallic copper is very poor in H2 dissociation. As reaction passes, metallic Cu converts into Cu2O causing better H2 dissociation and so better catalytic activity towards methanol. On prolonged TOS Cu2O convert into CuO again caused inferior catalytic activity towards methanol formation. Again, a disproportional reaction can be accepted (2CO→CO2 +C) which yields methane/ethane after dissociated hydrogen interaction.
CO to longer alkane and oxygenates
The higher activation energy has been found for direct C-O bond scission. Hydrogenation of CO over the surface of Co (0001) weakens the C-O bond.78 Thereafter, the activation energy of C–O dissociation over Co is dropped down. The dissociated hydrogen assisted carbon intermediate may and may not undergo mutual chain propagation and is finally terminated by adsorbed hydrogen to form alkane. Further, Fischer Tropsch chain termination led to the formation of oxygenates by nucleophilic attack of hydroxyl groups or CO insertion among alkyl intermediates (R–CHx–). Again, at the termination step; the hydroxyl addition from CeO2 ends up with an alcohol.
 |
Scheme 1 |
The reaction mechanism can be summarized in three steps: dissociation, chain propagation and chain termination. The reaction scheme of CO to hydrocarbon and oxygenates formation is shown in Table 2.
Table 2: The reaction scheme of CO to hydrocarbon and oxygenates formation under the three steps
|
Hydrocarbons (paraffin + olefin) contribution in Fischer Tropsch |
Oxygenates contribution in Fischer Tropsch |
|
CO dissociation step: CO + 2Ha→ [HOCH]a→ [CH]a+ [OH]a Chain propagation step: [CH]a + [CHx]a→ [RCHx]a Chain termination step: [CH]a + 3Ha→[CH4] a→CH4 [RCHx]a + [H]a→ [RCH3] a→RCH3 |
Chain propagation step: [RCHx]a + [OH]a→[RCH2O] a [RCHx]a + [CO]a→[RCHxCO]a Chain termination step: [RCH2O] a + [H]a→[ RCH2OH] a→ RCH2OH [RCHxCO]a +2[H]a→[RCH2CH2OH]→ RCH2CH2OH |
L. Spadaro et al.79 prepared Co/CeO2 catalysts two methods one by impregnation method using copper nitrate aqueous solution over CeO2 sample and second by combustion method by directly calcining the (NH4)2Ce(NO3)6·9H2O, Co(NO3)2·6H2O and oxalyl dihydrazide or Urea at 420oC. Cubic Co3O4 phase in impregnation sample, monoclinic CoO phase in “combustion method using oxalyl dihydrazide” and amorphous phase in “combustion method using urea” was found in XRD pattern. Two regions of H2 consumption 250–500 oC and 500–1000 ◦C were found in H2-TPR profile which was attributed to a reduction of Co-species and ceria carrier respectively. H2 consumption for impregnated sample was lowest and for “combustion using oxalyl dihydrazied” sample was maximum. CO consumption for catalyst prepared by “combustion using oxalyl dihydrazide” method was minimum (1.7–2.7 μmol g−1cat) and it had 0.2-1.2% metal dispersion. It indicates that such a catalyst (prepared by combustion using oxaldihydrazide) had very weak chemisorption sites located on the high-index plane of large Co particles. Catalysts [DS26] prepared by “combustion using urea” method had maximum CO consumption (97 μmol g−1cat) claiming maximum metal dispersion (13.4%). That means catalysts prepared by combustion using urea had strong chemisorption sites that are associated with greater degree of coordinative unsaturation in small metal crystallites. The major characterization results and catalytic activity over CeO2 supported Co catalyst are shown in Figure 11.
 |
Figure 11: The major characterization results and catalytic activity over CeO2 supported Co catalyst |
Catalyst prepared by combustion (Urea) has worst catalytic activity (XCO=1.6%) and selectivity of long chain hydrocarbon about 50% to C2+ (chain-growth probability 0.42) whereas catalyst prepared by combustion (oxalyl dihydrazide) has best activity (XCO =16.4%) and overall hydrocarbon yield >90% (chain-growth probability 0.72).
M. K. Gnanamani et al. synthesized 80 supported Pt–Co catalysts by incipient wetness impregnation method. H2O and D2O dissociate into surface hydroxyl (OH or OD) on reduced ceria surface. Deuterium has specific physical properties than hydrogen towards CO activation and Dissociation constant of water. The activation energy of CO activation with deuterium is lower (than hydrogen) as well as dissociation constant of water is inferior for deuterium oxide. It is interesting to note that by changing the feed from H2/CO to D2/CO (D is deuterium), products are more shifted towards hydrocarbon than oxygenates because on using deuterium the surface hydroxyl over ceria would be lower and concentration of D over Co is higher. Nearly ~87% hydrocarbon and only 13% oxygenates are formed with D2/CO feed (against 53% hydrocarbon and 45 oxygenated with H2/CO feed) over CeO2 supported Pt–Co catalysts. Again, the relative rate of H2O formation to rate of CO consumption (i.e., – r(H2O)/–r(CO)) is higher for deuterium in the feed than hydrogen.
Gnanamani et al.80 synthesized CeO2 supported Pt–Co catalysts by incipient wetness impregnation using 5 and 15 wt% Co(NO3)2·6H2O precursor solution over CeO2 and subsequent impregnation of 0.5 wt.% Pt over dried Co-Ce catalyst. The TPR profile of CeO2 composed of a low temperature broad reduction peak at 450oC ascribed to surface ceria reduction and a high temperature reduction peak at 750oC attributed to bulk ceria reduction. On Pt loading, low temperature peaks split into 150 and 250oC and 200 and 400oC which are attributed to sequential reduction of Co3O4 to CoO to Co respectively. On increasing Co loading, the Pt/Co ratio is higher in 5%Co–0.5%Pt/CeO2 than 15%Co–0.5%Pt/CeO2 catalyst. Pt presence influences the reduction of cobalt to much lower temperatures. So, the reduction peak of 5%Co–0.5%Pt/CeO2 is towards a relatively lower temperature than 15%Co–0.5%Pt/CeO2 catalyst. The major characterization results and catalytic activity over CeO2 supported Pt-Co catalyst is shown in Figure 12.
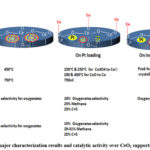 |
Figure 12: The major characterization results and catalytic activity over CeO2 supported Pt-Co catalyst |
The activity is found to depend on space velocity, time on stream and Co loading. As the space velocity decreased from 1.0 to 0.2 ml/hgcat, CO conversion reached a consistent value of 25%. Methane as well as C5+ selectivity remains about ~25%. On increasing TOS to 225 h, methane selectivity keeps raising to 29.0 – 31.0% and total oxygenates content increases up to ~15%. On increasing time on stream, lower chain oxygenates contents (30–35 mol% are C2, 17–25 mol% are C3, and 12–14 mol% are C4 alcohols with 0.61–0.65 chain growth probability) increased whereas the higher oxygenates content decreased. On increasing Co loading, the particle size is increasing. Again, the relative area of metallic cobalt to that of the perimeter area decreases. The earlier one (relative area of metallic cobalt) induces traditional FT termination, although the later one (periphery area) promotes termination by oxygenate synthesis intermediates.
Overall it can be concluded that cobalt based system catalysts behaves differently after hydrogenation of CO, [HCOH]a is remained adsorbed to the catalyst surface and dissociate into dissociates hydrogen assisted carbon intermediate [CH]a and [OH]a. dissociated hydrogen assisted carbon intermediate undergoes chain propagation or in between insertion of [CO]a / [OH]a and finally termination by adsorbed hydrogen [H]a. It results in longer alkane and alcohols. It is better to work with a catalyst system having Pt-Co where Pt induces the reduction of cobalt species to much lower temperature. The product is shifted to longer alkane if D2/CO feed is used in place of H2/CO feed because of easier dissociation of D2 than H2.
CO to Isobutene
W. Khaodee et al. synthesized 81 nanoscale ceria (CeO2) by the precipitation method. Tetragonal ZrO2phases are counted for acidity of the sample. However, at about 30 nm crystalline size at room temperature, tetragonal ZrO2 phase is not stabilized 82. So, micron level ZrO2 has no tetragonal phase. Additionally micro scale catalysts had only few acid and basic sites. So, the micron scale ZrO2 and CeO2 catalyst system is inferior towards CO to hydrocarbon conversion than nano scale ZrO2 and CeO2 catalyst. Micron scale ZrO2 was selective for C3 hydrocarbon and micro scale CeO2 was selective to C1 hydrocarbon but they are not selective for isobutene. In nanoscale level, the differences in both acid and base sites in ceria (having single fluorite phase) can be attributed to the various crystallite sizes of catalysts whereas in ZrO2 (having monoclinic and tetragonal phase), it could be attributed to amount of both phases and crystallite size of catalyst. From the ammonia and CO2-TPD results it was evident that In ZrO2, acid amount increases with increasing tetragonal phase till 29% and then decreases with increasing tetragonal phases while basic amount increases with growing ZrO2 tetragonal phase. The nanoscale CeO2 has the weak as well as moderate base sites. Iso-butene synthesis (from CO) needs both acid sites and basic sites. Nanoscale ZrO2 retains both types of acid and basic sites, so nano scale ZrO2 is most selective for iso-butene selectivity whereas in mean of activity (CO conversion) nano level CeO2 is best. CO hydrogenation shows steady state rate (constant activity) after 20 h. However, by optimizing the reaction condition,83 CO conversion reached upto 16.3% with 48.6% iso-C4 selectivity at 698 K, 5.0 MPa, GHSV = 720 h-1 and CO/H2= 1:1. Acidity, basicity and activity profile of CO to hydrocarbon conversion over micro and nano scale ZrO2 and CeO2 catalyst are shown in Table 3.
Table 3: Acidity, basicity and activity profile of CO to hydrocarbon conversion over micro and nano scale ZrO2 and CeO2 catalyst.
|
|
Micron level (ZrO2) |
Micron level (CeO2) |
Nano level (ZrO2) |
Nano level (CeO2) |
|
Acidity |
Only a few acids sites having no tetragonal phase. |
Only a few acid sites |
Acidity increases with increasing tetragonal phases till 29% then decreases |
No acid sites |
|
Basity |
Only a few base sites |
Only a few base sites |
Basicity increases with increasing tetragonal phases |
weak basic sites and moderate base sites |
|
CO conversion |
Low (0.19%) |
Low (1.02%) |
High (1.47%) |
High (4.07%) |
|
selectivity |
Isobutene: zero C3: 77.4 C2: 10.8% C1: 11.8% |
Isobutene: zero C1: 69.2% C2: 22% C1: 8.8% |
Isobutene: 85% C3: 9.2% C2: 2.6% C1: 2.7% |
Isobutene:57% C3: 18.6% C2: 14.4% C1: 9.4% |
W. Khaodee et al. synthesized 84 zirconia-ceria mixed oxide by coprecipitation as well as the physical mixing methods by using following mole proportion of cerium salt precursor and zirconium salt precursor; 20:80, 40:60, 60:40 and 80:20. In the coprecipitation method, CeO2 was incorporated into ZrO2 and caused an increase in surface area of the catalyst, decrease of ZrO2 crystallite size. CeO2 was also deposited in pores and so pore volume also decreased. In both preparation methods, it is found that below 12.7% ceria content, ammonia TPD profile is the sole nearer to ZrO2 which had weak as well as moderate acid sites regions. CeO2 had large amount of moderate as well as strong basic sites. On increasing Ce (>12.7%) loading, TPD profile changed to the pattern of sole CeO2 that means moderate acid sites disappeared and large amounts of moderate and strong basic sites had grown. Overall, due to interaction between zirconia and ceria (as formation of Zr–O–Ce bonds), acid sites were decreased. In physically mixing method, acid profile is as same as co-precipitated one but basicity remains same regardless of the CeO2 content whereas in coprecipitation method, CeO2 incorporation in ZrO2 builds up large amounts of moderate as well as strong base sites. However, on increasing loading of CeO2, the number of base sites was diminished.
The ESR spectrum shows different intensity of Zr4+ peaks with different loading in each preparation method. The selectivity of isobutene (from CO hydrogenation) depends on the intensity of Zr4+ in both co-precipitated as well as physically mixed ZrO2–CeO2 catalysts. Physically mixed catalysts show lesser Zr4+ amount with increasing ceria loading and so, selectivity of isobutene also falls down accordingly. In a co-precipitation method, Zr4+ intensity of different ceria-loaded samples depends on amount of ceria at the surface or in the bulk. So, Zr4+ intensity does not follow a trend with increasing ceria loading. But isobutene selectivity with Zr4+ intensifies as follows the same trend. So, it is strongly suggested that the Zr4+ ion is involved in CO hydrogenation to isobutene. In the physical mixing method, more amount of Zr4+ was found up to CeO2 content < 69.2%. So, the catalyst prepared by the physical mixing method had better selectivity to isobutene than the catalyst prepared by the precipitation method. It can be proposed that in this type of catalyst system a control of Chain propagation step of [HC]a (In branch manner) and then insertion of [OH]a at the end. It forms iso-butanol. Due to zirconia acidity (especially the contribution of Zr+3 oxidation state), Iso-butanol may be proposed to form iso-butene. The major characterization results and catalytic activity over CeO2-ZrO2 catalyst is shown in Figure 13.
 |
Figure 13: The major characterization results and catalytic activity over CeO2-ZrO2 catalyst |
Ceria-titania having molar ratio 0.25–9 was synthesized by sol–gel method. It has no TiO2 phase even TiO2 amount is present in catalyst up to 10–50 mol% but CeO2–TiO2 (8:2) catalyst had crystalline Ce2O3.83 However, on increasing TiO2 loading, crystallite size of CeO2 was decreased because ionic radius of Ti4+ (0.64A˚) is smaller than Ce4+ (0.97A˚).85 The surface area, activity and selectivity of hydrocarbon of ceria-titania composite oxides are higher than pure titania and ceria. Overall, CeO2–TiO2 (8:2) catalyst gave CO conversion 22.9% and iso-C4 selectivity 44.4%. As reaction steps were exothermic, increase of reaction temperature was found disadvantageous over the reaction’s thermodynamics, especially for iso-C4. Increase in reaction temperature up to 748K resulted into 40% CO conversion and 64% hydrocarbon selectivity. At 698 K, the selectivity of iso-C4 was maximum value whereas the selectivity of C1–C3 hydrocarbon was found minimum.
On increasing pressure from 1 to 5 MPa, CO conversion increased from 12% to 22%. This is in accordance with thermodynamics where decrease in molecular numbers is favored on increasing pressure. In the mean of Iso-C4 selectivity, pressure reached to maximum at about 3 MPa. However, on higher pressure than 3MPa, the reverse tendencies of conversion and iso-C4 selectivity was observed. At higher GHSV, water was de-absorbed easily from catalysts’ surface and thus CO2 formation by water gas shift reaction was limited to some extent and So, CO2 selectivity was diminished slightly. The decrease of iso-C4 and C1–C3 percentage in hydrocarbons was directly related to the relatively increase of C5+ percentage. After 40 h, CO conversion and hydrocarbon selectivity decreased slightly but iso-C4 percentage in hydrocarbons dropped from 44% to 35%.
So, it can be concluded that when iso-butene is targeted, dopant free systems are found more promising. ZrO2 nano level (having both acid and basic sites) and CeO2 nano level (having only basic sites) are active for CO conversion 1.5% and 4 % respectively in which ZrO2 is more selective for isobutene (85%). Zirconia in ceria catalyst (CeO2-ZrO2) has a large number of Basic sites and weak acid sites as well as Zr+3 distribution in surface as well as bulk. It showed a rise in conversion to 16.3% but decrease in 48.6% iso-C4 selectivity. The Iso-C4 selectivity is chiefly dependent [DS29] on Zr+3 concentrations over the surface. Under the same reaction conditions when Ti component was incorporated into CeO2 (CeO2 –TiO2 (8:2), the 22.9% CO conversion as well as 44.4% iso-C4 selectivity were achieved.
Acknowledgement
MLC acknowledge the administration of Sankalchand Patel University and SHODH Program for providing research fellowship. R K acknowledge administration of Indus University for providing support in research.
Conflict of Interest
There is no conflict of interest
Funding Sources
There is no funding source.
References
- Lutfalla, S.; Shapovalov, V.; Bell, AT. J Chem Theory Comput. 2011,7(7),2218-2223.
CrossRef - Li, H.; Lu, G.; Dai, Q.; Wang, Y.; Guo, Y.; Guo, Y. ACS Appl Mater Interfaces. 2010,2(3),838-846.
CrossRef - Borchert, H.; Borchert, Y.; Kaichev, V. V.; J Phys Chem B. 2005, 109 (43), 20077-20086.
CrossRef - Zhong, S-L.; Zhang, L-F.; Wang, L.; Huang, W-X.; Fan, C-M.; Xu, A-W. J Phys Chem C. 2012, 116 (24), 13127-13132.
CrossRef - Chen, HT.; Choi, YM.; Liu, M.; Lin, MC. ChemPhysChem. 2007, 8(6),849-855.
CrossRef - Wu, L.; Wiesmann, H.J.; Moodenbaugh, A.R.; Phys Rev B. 2004, 69(12), 125415.
- Le, M. P.; Tam, W. Angew Chemie Int Ed. 2008, 47(16), 2926-2928.
CrossRef - Nolan, M.; Grigoleit, S.; Sayle, D.C.; Parker, S.C.; Watson, G.W. Surf Sci. 2005, 576(1), 217-229.
CrossRef - Yi, N.; Si, R.; Saltsburg, H.; Flytzani-Stephanopoulos, M. Energy Environ Sci. 2010, 3(6), 831-837.
CrossRef - Yang, Z.; Woo, TK.; Hermansson, K. Surf Sci. 2006, 600(22), 4953-4960.
CrossRef - Hernández, N.C.; Grau-Crespo, R.; De, Leeuw N.H.; Sanz, J.F.; Phys Chem Chem Phys. 2009, 11(26), 5246-5252.
CrossRef - Esch, F.; Fabris, S.; Zhou, L. Science (80- ). 2005,309(5735), 752-755.
CrossRef - Jiang, Y.; Adams, J.B.; Van Schilfgaarde, M. J Chem Phys. 2005, 123(6), 64701.
CrossRef - Chase, M.W. J Phys Chem Ref Data, Monogr 9. 1998, 4(9), 1-1951.
- Jiang, Y.; Adams, J.B.; Van Schilfgaarde, M. J Chem Phys. 2005,123(6).
CrossRef - Kim, H.Y.; Henkelman, G. J Phys Chem Lett. 2012, 3(16), 2194-2199.
CrossRef - Chen, H.L.; Chang, J.G.; Chen, H.T. Chem Phys Lett. 2011,502(4-6),169-172.
CrossRef - Farra, R.; García-Melchor, M.; Eichelbaum, M. ACS Catal. 2013, 3(10), 2256-2268.
CrossRef - Pala, R.G.S.; Tang, W.; Sushchikh, M.M. J Catal. 2009, 266(1),50-58.
CrossRef - Chen, H.T. J Phys Chem C. 2012,116(10), 6239-6246.
CrossRef - Chrétien, S.; Metiu, H. Catal Letters. 2006, 107(3-4), 143-147.
CrossRef - Shapovalov. V.; Metiu, H.; J Catal. 2007,245(1),205-214.
CrossRef - Pala, R.G.S. J Catal. 2008, 254(2), 325-331.
CrossRef - Nolan, M.; Verdugo, V.S.; Metiu. H. Surf Sci. 2008, 602(16), 2734-2742.
CrossRef - Kim, H.Y.; Lee, H.M.; Pala, R.G.S.; Shapovalov, V.; Metiu, H. J Phys Chem C. 2008,112(32),12398-12408.
CrossRef - Hu, Z.; Metiu, H. J Phys Chem C. 2011,115(36),17898-17909.
CrossRef - Scanlon, D.O.; Walsh, A.; Morgan, B.J. J Phys Chem C. 2007, 111(22), 7971-7979.
CrossRef - Schirmer, O,F. 2006,18(43), R667-R704.
CrossRef - Yang, Z,; Wang, Q.; Wei, S. Phys Chem Chem Phys. 2011,13(20), 9363-9373.
CrossRef - Kehoe, A.B.; Scanlon, D.O.; Watson, G.W. Chem Mater. 2011, 23(20), 4464-4468.
CrossRef - Baron, M.; Abbott, H.; Bondarchuk, O. Angew Chemie – Int Ed. 2009,48(43),8006-8009.
CrossRef - Reidy, R.F.; Swider, K.E. J Am Ceram Soc. 1995,78(4),1121-1122.
CrossRef - Da Silva, J.L.F.; Ganduglia-Pirovano, M.V.; Sauer, J. Phys Rev B – Condens Matter Mater Phys. 2007;76(12):125117.
CrossRef - Ganduglia-Pirovano, M.V.; Popa, C.; Sauer, J. J Am Chem Soc. 2010 ,132(7), 2345-2349.
CrossRef - Wu, Z. Schwartz, V. Li, M. Rondinone, A.J.; Overbury, S.H. J Phys Chem Lett. 2012;3(11):1517-1522.
CrossRef - Martínez-Huerta, M. V. Deo, G.; Fierro, J.L.G.; Bañares M,A.. J Phys Chem C. 2008, 112(30), 11441-11447.
CrossRef - Zhang, C.; Michaelides, A.; King, D.A.; Jenkins, S.J. J Chem Phys. 2008, 129(19),194708.
CrossRef - Camellone, M.F. Fabris, S. J Am Chem Soc. 2009, 131(30), 10473-10483.
CrossRef - Zhang, C.; Michaelides, A.; King, D.A.; Jenkins, S.J. J Am Chem Soc. 2010, 132(7), 2175-2182.
CrossRef - Kim, H.Y.; Lee, H.M.; Henkelman, G. J Am Chem Soc. 2012, 134(3), 1560-1570.
CrossRef - Johansson, M.P.; Lechtken, A.; Schooss, D.; Kappes, M.M.; Furche, F. Phys Rev A – At Mol Opt Phys. 2008, 77(5), 53202.
CrossRef - Ferrighi, L. Hammer, B. Madsen, G.K.H. J Am Chem Soc. 2009,131(30),10605-10609.
CrossRef - Leppert, L.; Kümmel, S. J Phys Chem C. 2011, 115(14), 6694-6702.
CrossRef - Yang, Z.; Xie, L.; Ma, D.; Wang, G.; J Phys Chem C. 2011,115(14), 6730-6740.
CrossRef - Chen, H.L.; Peng, W.T.; Ho, J.J.; Hsieh, H.M. Chem Phys. 2008, 348(1-3), 161-168.
CrossRef - Campbell, Nat Chem. 2012, 4(8), 597-598.
CrossRef - Agarwal, S.; Zhu, X.; Hensen, E.J.M.; Lefferts, L.; Mojet, B.L. J Phys Chem C. 2014, 118(8), 4131-4142.
CrossRef - Metiu, H. Thermodynamics, Taylor and Francis Group.; 2006.
- Scherz, U. Imperfections in III/V Materials. 1993, 38, 1-58.
CrossRef - Ganduglia-Pirovano, M.V.; Hofmann, A.; Sauer, J. Surf Sci Rep. 2007, 62(6), 219-270.
CrossRef - Tabakova, T.; Boccuzzi, F.; Manzoli, M.; Andreeva, D. Appl Catal A Gen. 2003, 252(2), 385-397.
CrossRef - Avgouropoulos, G.; Manzoli, M.; Boccuzzi, F. J Catal. 2008, 256(2), 237-247.
CrossRef - Carrettin, S. Concepción, P.; Corma, A.; López Nieto, J.M.; Puntes, V.F. Angew Chemie – Int Ed. 2004,43(19),2538-2540.
CrossRef - Baron, M.; Bondarehuk, O.; Stacchiola, D.; Shaikhutdinov, S.; Freund, H.J.; J Phys Chem C. 2009,113(15), 6042-6049.
CrossRef - Nolan, M.; Watson, G.W.; J Phys Chem B. 2006,110(33),16600-16606.
CrossRef - Yi, G.; Xu, Z.; Guo, G.; Tanaka, K.; Yuan, Y. Chem Phys Lett. 2009, 479(1), 128-132.
CrossRef - Chen, H.T.; Chang, J.G. J Phys Chem C. 2011,115(30),14745-14753.
CrossRef - Chang, L.H.; Sasirekha, N.; Chen, Y.W.; Wang, W.J. Ind Eng Chem Res. 2006, 45(14), 4927-4935.
CrossRef - Mai, H-X.; Sun, L-D.; Zhang, Y-W. J Phys Chem B. 2005;109(51):24380-24385.
CrossRef - Tinkle, M.; Dumesic, J.A. J Catal. 1987, 103(1), 65-78.
CrossRef - Andreeva, D.; Ivanov, I.; Ilieva, L.; Sobczak, J.W.; Avdeev, G.; Petrov, K.; Top Catal. 2007, 44(1), 173-182.
CrossRef - Karpenko, A.; Leppelt, R.; Cai, J. J Catal. 2007, 250(1), 139-150.
CrossRef - Ding, W.C.; Gu, X.K.; Su, H.Y.; Li, W.X. J Phys Chem C. 2014, 118(23), 12216-12223.
CrossRef - Scanlon, D.O.; Galea, N.M.; Morgan, B.J.; Watson, G.W. J Phys Chem C. 2009, 113(25), 11095-11103.
CrossRef - Liu, L.; Yao, Z.; Deng, Y.; Gao, F.; Liu, B.; Dong, L.; ChemCatChem. 2011,3(6),978-989.
CrossRef - Sharma, S.; Hu, Z.; Zhang, P.; McFarland, E.W. Metiu, H. J Catal. 2011;278(2):297-309.
CrossRef - Matsumura, Y.; Shen ,W-J.; Ichihashi, Y.; Okumura, M. J Catal. 2001, 197(2), 267-272.
CrossRef - Shen, W-J.; Ichihashi, Y.; Matsumura, Y. Appl Catal A Gen. 2005, 282(1), 221-226.
CrossRef - Ponec, V. Catal Today. 1992,12(2),227-254.
CrossRef - Fujitani, T.; Saito, M.; Kanai, Y. Catal Letters. 1994, 25(3-4), 271-276.
CrossRef - Sheffer, G.R.; King, T.S. J Catal. 1989, 115(2), 376-387.
CrossRef - Sheffer, G.R.; King, T.S. J Catal. 1989, 116(2), 488-497.
CrossRef - Chu, P.J.; Gerstein, B.C.; Sheffer, G.R.; King, T.S. J Catal. 1989, 115(1), 194-204.
- Rabo, J.A.; Risch, A.P.; Poutsma, M.L. J Catal. 1978, 53(3), 295-311.
CrossRef - Fakley, M.E.; Jennings, J.R.; Spencer, M.S. J Catal. 1989, 118(2), 483-486.
CrossRef - Shen, W-J.; Ichihashi, Y.; Matsumura, Y. Catal Letters. 2002, 83(1), 33-35.
CrossRef - Zhuo, M.; Tan, K.F.; Borgna, A.; Saeys, M. J Phys Chem C. 2009, 113(19), 8357-8365.
CrossRef - Spadaro, L.; Arena, F.; Granados, M.L.; Ojeda, M.; Fierro, J.L.G.; Frusteri, F. J Catal. 2005, 234(2), 451-462.
CrossRef - Gnanamani, M.K.; Jacobs, G.; Shafer, W.D. Catal Commun. 2012, 25, 12-17.
CrossRef - Khaodee, W.; Jongsomjit, B.; Assabumrungrat, S.; Praserthdam, P.; Goto, S.; Catal Commun. 2007, 8(3), 548-556.
CrossRef - Garvie, R.C. J Phys Chem. 1978, 82(2), 218-224.
CrossRef - Zhu, Z.; He, D. Fuel. 2008, 87(10), 2229-2235.
CrossRef - Khaodee, W.; Tangchupong, N.; Jongsomjit, B.; Praserthdam, P.; Assabumrungrat, S. Catal Commun. 2009, 10(5), 494-501.
CrossRef - Reddy, B.M.; Khan, A.; Yamada, Y.; Kobayashi, T.; Loridant, S.; Volta, J-C. J Phys Chem B. 2003, 107(41), 11475-11484.
CrossRef

This work is licensed under a Creative Commons Attribution 4.0 International License.
About The Author
![]()
A New Edition of Web of Science
Journal Impact Factor
2022: 0.5
Five Year: 0.8
Journal is Indexed in

Cabells Whitelist
![]()


