Application Extended Vogel -Tammann-Fulcher Equation for Soybean Oil
Ioana Stanciu1* and Noureddine Ouerfelli2
1Department of Physical Chemistry, University of Bucharest, Faculty of Chemistry, 4-12 Elisabeta Blvd, 030018, Bucharest, Romania.
2Department Chemistry, Université de Tunis El Manar, Laboratoire de Biophysique et Technologies Médicales LR13ES07, Institut Supérieur des Technologies Médicales de Tunis, 9 Avenue Dr. Zouhaier Essafi 1006 Tunis, Tunisie..
Corresponding Author E-mail: istanciu75@yahoo.com
DOI : http://dx.doi.org/10.13005/ojc/370603
Article Received on : 16-Sep-2021
Article Accepted on :
Article Published : 23 Nov 2021
Reviewed by: Dr. Ahmed
Second Review by: Dr. Loveth Konnia
Final Approval by: Dr. Suman Malik
Mathematical models that describe the variation of soybean oil viscosity with temperature according to the recent WLF and VTF (or VFT) equations and traditionally by the Arrhenius equation. The Arrhenius equation shows that the viscosity of the oil is proportional to the absolute temperature and is determined by the activation energy parameter. In Arrhenius' equation the absolute temperature is replaced by T + b where both adjustable T and b are in ° C. The mathematical models described by the equations WLF and VTF, are equal to each other. All three equations are in the same model when used for experimental data of temperature-viscosity dependence, they give exactly the same very high regression coefficient.
KEYWORDS:Extend EVTF; Soybean oil; Viscosity; VTF Equation
Download this article as:| Copy the following to cite this article: Stanciu I, Ouerfelli N. Application Extended Vogel -Tammann-Fulcher Equation for Soybean Oil. Orient J Chem 2021;37(6). |
| Copy the following to cite this URL: Stanciu I, Ouerfelli N. Application Extended Vogel -Tammann-Fulcher Equation for Soybean Oil. Orient J Chem 2021;37(6). Available from: https://bit.ly/3FPtvg7 |
Introduction
The exact correlation of soybean oil viscosity data is of extreme practical importance when looking for optimal filler conditions for certain applications. Although the best correlations of experimental data for temperature dependence can be made by taking advantage of the VTF equation 1-3 and avoiding the use of temperature-dependent variables, correlations are still attempted by combining the use of both dependent variables, such as temperature as well as independent variables in many studies.
In previous research, the change in soybean oil viscosity at different temperatures was analyzed using absolute rate theory 4,5. Absolute rate theory, widely applicable to flow processes, describes the viscosity-temperature dependence in the form of Arrhenius 6,7. This theory has been used to determine changes in the viscoelastic properties of soybean oil at high temperatures 6,8,9. In this research, the most widely used empirical equation is the Williams-Landel-Ferry (WLF) equation 10. Another equation widely used to model viscosity-temperature dependence is the Vogel-Tammann-Fulcher (VTF) equation 1-3 . It was initially developed to analyze the viscosity-temperature relationship for overheated organic liquids and has recently been applied to polymers, protein solutions and foods 11- 15 .
In this paper, the viscosity data obtained at different temperatures were fitted and compared using both VTF and a proposed extended EVTF equation.
Viscosity Temperature dependence
Theoretical background
The fluid having a complex nature there is not yet a theory to describe it. There are some models in the literature such as the theory of the distribution function proposed by Kirkwood et al. 16, the molecular dynamics approach reported by Cumming and Evans 17 and Eyring’s reaction rate theory 18 – 20 . Empirical and semi-empirical methods do not provide reasonable results, but they lack the general approach, especially in the vicinity of boiling temperature 14.
Empirical equations
The dependence dynamic viscosity versus temperature absolute is described by several empirical equations 15, 21-42:
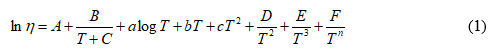
Viscosity-temperature dependence for liquid systems that have a linear or nonlinear behavior, we represent the logarithm of the dynamic viscosity (lnη) in relation to the absolute temperature (1 / T). Multi-constant equations (Eq.1) for many fluids that deviate strongly from Arrhenius behavior. There are several fluids such as melting salts, glasses and metals, ionic liquids, heavy and vegetable oils, fuels and biofuels, etc. 16-18. For nonlinear behavior, it is found that the temperature dependence of the dynamic viscosity according to the Vogel-Fulcher-Tammann (VTF) equation 1-3 expressed as follows:
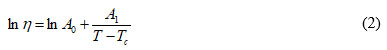
Where A0 and A1 are optimal constants and Tc is the VTF temperature. It’s also interesting to use the modified VTF equation which is expressed as follow
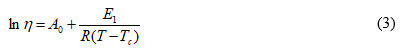
Where R – perfect gas constant, E1 is the VTF activation energy, A0, T0, are identical to the A0 and Tc parameters in Eq. (2), respectively 6,7 14-16.
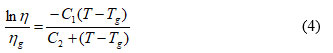
Likewise, to describe the behavior of soybean oil at different temperatures we found in the literature the following relationship, named Willams-Landel-Ferry (WLF) equation and frequently used for honey 43-45:
Material and methods
Non-additive soybean oil used in this study was produced in Romania. To determine the dynamic viscosity of soybean oil we used the Haake 550 viscometer with the VH1 viscose sensor at all shear rates. For temperature control we used a thermostatic bath at temperatures between 40 and 100 ° C.
Results and discussion
Table 1: Logarithm dynamic viscosity for soybean oil at different temperatures and shear rates.
|
Temperature |
Shear rate / s-1 |
||||||||
|
3.3 |
6 |
10.6 |
17.87 |
30 |
52.95 |
80 |
120 |
||
|
T/°C |
T / K |
ln(η/mPa.s) |
|||||||
|
40 |
313.15 |
3.4484 |
3.2947 |
3.1655 |
3.0810 |
3.0573 |
3.0160 |
3.0146 |
3.0131 |
|
50 |
323.15 |
3.0015 |
2.7625 |
2.6575 |
2.5703 |
2.4732 |
2.4038 |
2.3712 |
2.3527 |
|
60 |
333.15 |
2.8693 |
2.6462 |
2.5848 |
2.5096 |
2.4292 |
2.3535 |
2.3243 |
2.2895 |
|
70 |
343.15 |
2.8003 |
2.5849 |
2.5112 |
2.4467 |
2.3749 |
2.3028 |
2.2670 |
2.2127 |
|
80 |
353.15 |
2.7389 |
2.5180 |
2.4354 |
2.3805 |
2.3253 |
2.2396 |
2.2148 |
2.1448 |
|
90 |
363.15 |
2.6899 |
2.4721 |
2.3749 |
2.3154 |
2.2690 |
2.1883 |
2.1389 |
2.0618 |
|
100 |
373.15 |
2.6484 |
2.4233 |
2.3504 |
2.2538 |
2.2083 |
2.1282 |
2.0894 |
2.0136 |
Generally when the viscosity-temperature dependence deviates from the Arrhenius behavior [21-23,25-30], experimenters prefer to use the usual expression of VTF (Eq. 2) to minimize the discrepancy with experimental data.
If we extend the VTF model which has a linear dependence of the variables a second degree polynomial, we can write (Eq.5):
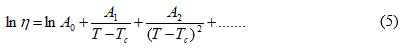
where Ai are three new free adjustable parameters which can be determined with non-linear regression.
The Table 2 summarizes results of the two different fits for VTF model (Eq. 2) and the present extended EVTF model (Eq. 5) related to the soybean oil system at seven different temperatures (293.15 –353.15) K and for each fixed eight shear rates (3.3–120) s-1. Overall, the R-square (R2) and standard deviation (σ) are better for the proposed model (Eq. 5) when (A2 ≠ 0) than of the usual VTF model (Eq. 2) when (A2 = 0) in Eq. 5.
 |
Figure 1: Dependence of ln dynamic viscosity versus absolute temperature at shear rate 3.3 s-1 and comparison VTF model with EVTF proposed model |
 |
Figure 2: Dependence of ln dynamic viscosity versus absolute temperature at shear rate 6 s-1 and comparison VTF model with EVTF proposed model. |
 |
Figure 3: Dependence of ln dynamic viscosity versus absolute temperature at shear rate 10.6 s-1 and comparison VTF model with EVTF proposed model |
 |
Figure 4: Dependence of ln dynamic viscosity versus absolute temperature at shear rate 17.87 s-1 and comparison VTF model with EVTF proposed model |
 |
Figure 5: Dependence of lndynamic viscosity versus absolute temperature at shear rate 30 s-1 and comparison VTF model with EVTF proposed model |
 |
Figure 6: Dependence of ln dynamic viscosity versus absolute temperature at shear rate 52.95 s-1 and comparison VTF model with EVTF proposed model |
 |
Figure 7: Dependence of ln dynamic viscosity versus absolute temperature at shear rate 80 s-1 and comparison VTF model with EVTF proposed model |
 |
Figure 8: Dependence of ln dynamic viscosity versus absolute temperature at shear rate 120 s-1 and comparison VTF model with EVTF proposed model |
Figs. 1 to 8 show that the discrepancy between experimental values and the calculated ones by the EVTF proposed model (Eq. 5), in comparison with the simple VTF model (Eq. 2). In addition, the VTF model starts to deviate and diverge at high temperature.
Table 2: Optimal coefficients (Ai), VTF temperature (TC), R-square (R2) and standard deviation (σ), VTF model (Eq. 3, A2 = 0) and that for proposed EVTF model (Eq. 5, A2 ≠ 0).
|
Model |
Shear rate |
Values of parameters |
R-square |
SD |
|||
|
s-1 |
lnA0 |
A1 / K |
A2 / K2 |
Tc / K |
R2 |
σ |
|
|
VTF |
3.3000 |
2.5220 |
11.074 |
0 |
301.4 |
0.99333 |
0.0225 |
|
EVTF |
2.4501 |
15.338 |
-41.938 |
301.35 |
0.99832 |
0.0113 |
|
|
VTF |
6.0000 |
2.3359 |
8.8138 |
0 |
303.1 |
0.99265 |
0.0255 |
|
EVTF |
2.2649 |
12.522 |
-28.706 |
303.05 |
0.99818 |
0.0127 |
|
|
VTF |
10.600 |
2.2570 |
8.8189 |
0 |
303.6 |
0.99062 |
0.0271 |
|
EVTF |
2.1832 |
12.773 |
-32.265 |
303.56 |
0.99702 |
0.0153 |
|
|
VTF |
17.870 |
2.1906 |
8.5447 |
0 |
304.7 |
0.98486 |
0.0339 |
|
EVTF |
2.1189 |
12.354 |
-31.229 |
304.47 |
0.99124 |
0.0258 |
|
|
VTF |
30.000 |
2.2001 |
4.9953 |
0 |
306.4 |
0.98327 |
0.0367 |
|
EVTF |
2.1357 |
7.7854 |
-14.356 |
306.41 |
0.99060 |
0.0275 |
|
|
VTF |
52.950 |
2.1082 |
5.5600 |
0 |
307.1 |
0.98591 |
0.0353 |
|
EVTF |
2.0462 |
8.3008 |
-14.624 |
307.06 |
0.99180 |
0.0270 |
|
|
VTF |
80.000 |
2.0735 |
5.4813 |
0 |
307.4 |
0.98369 |
0.0397 |
|
EVTF |
2.0050 |
8.4498 |
-15.275 |
307.41 |
0.99056 |
0.0302 |
|
|
VTF |
120.00 |
1.9611 |
7.8488 |
0 |
307.8 |
0.98595 |
0.0401 |
|
EVTF |
1.8781 |
11.814 |
-25.307 |
307.47 |
0.99293 |
0.0283 |
|
Eqs. 2 and 5 can be re-expressed as follows:
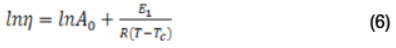
for the VTF Model, and:
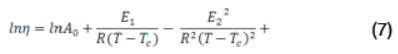
for the suggested extended EVTF model, where the parameters E1 and E2 are energies, R is the perfect gas constant, Tc and A0 is a viscosity at infinite temperature.
The Table 3 summarizes values of the two new energies for the VTF model (Eq. 6) and the present extended EVTF model (Eq. 7) related to the soybean oil system at seven different temperatures (293.15 –353.15) K and for each fixed eight shear rates (3.3–120) s-1.
Table 3: Optimal Parameters E1 and E2 for at different shear rates, VTF model (Eq. 6, E2 = 0) and that for proposed EVTF model (Eq. 7, E2 ≠ 0).
|
Model |
Shear rate |
Values of parameters |
||
|
E1 |
E2 |
A0 |
||
|
s-1 |
J.mol-1 |
J.mol-1 |
mPa.s |
|
|
VTF |
3.30 |
92.074 |
0.0000 |
12.453 |
|
EVTF |
127.53 |
53.844 |
11.590 |
|
|
VTF |
6.00 |
73.282 |
0.0000 |
10.339 |
|
EVTF |
104.11 |
44.547 |
9.6302 |
|
|
VTF |
10.60 |
73.325 |
0.0000 |
9.5544 |
|
EVTF |
106.20 |
47.228 |
8.8747 |
|
|
VTF |
17.87 |
71.045 |
0.0000 |
8.9406 |
|
EVTF |
102.72 |
46.464 |
8.3220 |
|
|
VTF |
30.00 |
41.533 |
0.0000 |
9.0259 |
|
EVTF |
64.731 |
31.503 |
8.4630 |
|
|
VTF |
52.95 |
46.228 |
0.0000 |
8.2334 |
|
EVTF |
69.017 |
31.796 |
7.7384 |
|
|
VTF |
80.0 |
45.574 |
0.0000 |
7.9526 |
|
EVTF |
70.256 |
32.496 |
7.4261 |
|
|
VTF |
120.0 |
65.259 |
0.0000 |
7.1071 |
|
EVTF |
98.227 |
41.827 |
6.5411 |
|
As a first step of attributing a significance meaning, (E1) can be considered as the VTF activation energy, comparing with the mathematical Arrhenius-type equation. We note that the VTF temperature (TC) is practically identical for the two models VTF and EVTF. We can justify this finding by the fact that the viscosity of soybean oil exponentially increases near a given temperature and physically diverges regardless of the used model such as VTF or EVTF. In addition, starting from that the viscosity value of solid state is almost infinite; we can conclude that the VTF temperature (TC) is close and in relationship with the melting point (Tm). Comparing Eqs. 6 and 7, we can consider that (E2) is a corrective term to the VTF activation energy (E1) and must be highly correlated. By analogy with the Arrhenius-type equation, (A0) is in causal correlation with the viscosity of the soybean oil at vapor state near the normal boiling temperature (Tb) 15,46-49.
Effect of shear rate on the VTF-parameters
Fig. 9a shows that the pre-exponential factor (A0) decreases exponentially at very low shear rate values, after that, it continues decreasing slowly. However, thinking about the physical significance of (A0) which is equivalent to a viscosity and the eventual its obedience to the power law, we discover an optimal very interesting linearization revealed by the Fig. 9b, which permit us to suggest an interesting empirical model expressed as follows:
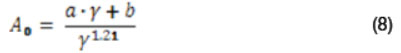
Where the 0.21-value can represent a certain rheological flow index and, (a) and (b) are adjustable parameters. Values of (a) and (b) are given into the (Fig. 9b).
 |
Figure 9: Comparison of the logarithm of the pre-exponential factor lnA0 (Table 2) calculated by Eq. (7), related to (●): VTF model (Eq. 3) and that (○): the proposed EVTF model (Eq. 5). |
Figs. 10 and 11 show that the optimal coefficients (Ai) decrease rapidly at low shear rate to reach a minimum and vary very slightly in the shear rate range between 30 and 80 s-1. Considering that these parameters are in relationship with the VTF activation energy (Ei), we can conclude that there a certain stabilization in the [30-80] shear rate range in (s-1), where the molecules of soybean oil find facility to transit from one fluid layer to an adjacent one.
 |
Figure 10: Comparison of the optimal coefficients (A1), (Table 2), related to (●): VTF model (Eq. 3) and that (○): the proposed EVTF model (Eq. 5). |
 |
Figure 11: Variation of the optimal coefficients (A2), (Table 2), related to the proposed EVTF model (Eq. 5) as a function of the shear rate (Table 2). |
Fig. 11 shows that the VTF temperature (TC) increases with the shear rate and tends to a limiting value about 308 K at high values of shear rate which is probably in relationship with the melting point (Tm).
Conclusion
The present paper proposes a new rheological model extending the usual Vogel-Tammann-Fulcher model (VTF) linear in 1/(T–TC) to a non linear one (i.e. polynomial form in 1/(T–TC)) which can be called Extended Vogel-Tammann-Fulcher expression (EVTF) and depending on the discrepancy with experimental data, we can choose the optimal polynomial degree since two.
In addition, the present paper proposes a new EVTF model of dynamic temperature viscosity dependence for soybean oil. The present work comes into within the general framework of empirical and semi-empirical modeling by proposing original expressions in rheology or by extending certain existing models. [42,50,51].
If we compare the activation energies of VTF (Ei), as well as the temperatures of VTF (TC) to provide and classify the behavior of rheological fluids to provide some interesting theoretical interpretations and to contribute to the development of the theory.
Acknowledgment
This research did not receive any specific grant from funding agencies in the public, commercial, or not-for-profit sectors.
Conflict of Interest
No potential conflict of interest was reported by the co-authors.
Funding Sources
There is no funding Source.
References
- Vogel H., 1921, Physikalische Zeitschrift (in German), 22, 645.
- Fulcher G.S., 1925, Journal of the American Ceramic Society. Wiley. 8(6), 339–355.
CrossRef - Tammann G., Hesse W., 1926, Zeitschrift für anorganische und allgemeine Chemie (in German). Wiley., 156 (1), 245–257.
CrossRef - Herrin M. and Jones G.E., 1963, Journal of Association of Asphalt Paving Technologists, 32, 82-105.
- Salomon D. and Zhai H., 2002, Journal of Applied Asphalt Binder Technology, 2(2).
- Christensen D.W., Bahia, H.D. and Anderson, D.A., 1996, Journal of Association of Asphalt Paving Technologists, 65, 385-399.
- Glasstone S., Laidler K. and Eyring H., The theory of Rate Processes, McGraw-Hill, New York, NY, 1941.
- Bahia H.U. and Anderson D.A., 1993, nJournal of Association of Asphalt Paving Technologists, 62, 93-129.
- Marateanu M. and Anderson D., 1996, Journal of Association of Asphalt Paving Technologists, 65, 408-435.
- Williams M.L., Landel R.F., and Ferry J.D., 1955, Journal of the American Chemistry Society, 77, 3701-3706.
CrossRef - Monkos K., 2003, Current Topics in Biophysics, 27(1), 17-21.
- Debenedetti P.G., and Stillinger F.H., 2001,Nature, 410, 259-267.
CrossRef - Comez L., Fioretto D., Palmieri L., Verdini L., Gapinski J., Oakula T., Patoeski A., Steffen W., and Fischer E.W., 1999, Physical Review E, 60(3), 3086-3096.
CrossRef - Viswanath D.S., Ghosh T.K., Prasad G.H.L, Dutt N.V.K., Rani K.Y., Viscosity of Liquids.Theory, Estimation, Experiment, and Data. Springer: Dordrecht, The Netherlands, 2007.
- Messaâdi A., Dhouibi N., Hamda H., Belgacem F.B.M., Adbelkader Y., Ouerfelli N., Hamzaoui A.H., 2015, Journal of Chemistry, 2015, 12.
CrossRef - Kirkwood J.G., Buff F.P., Green M.S., 1949, J. Chem. Phys., 17, 988-994.
CrossRef - Cummings P.T., Evans D.J., 1992, Ind. Eng. Chem. Res., 31, 237-1252.
CrossRef - Eyring H., 1936, J. Chem. Phys., 4, 283-291.
CrossRef - Eyring H., Hirschfelder J.O., 1937, J. Phys. Chem., 41,249-257.
CrossRef - Eyring H., John M.S., Significant Liquid Structure. Wiley: New York, 1969.
- Rosenstock H.M., Wallenstein M. B., Wahrhaftig A. L., & Eyring, H., 1952, Proceedings of the National Academy of Sciences of the United States of America, 38(8), 667.
CrossRef - Christensen C.M., & Eyring, H.J., 2011, The innovative university: Changing the DNA of higher education from the inside out. John Wiley & Sons.
- Tobolsky A., & Eyring H., 1943, The Journal of chemical physics, 11(3), 125-134.
CrossRef - Guzman J. De., 1913, Anales de la Sociedad Española de Física y Química, 11, 353-362.
- Andrade E. N., 1930, Nature, 125, 309-310.
CrossRef - Andrade E. N., 1934, Philosophical Magazine, 17, 497-511.
CrossRef - Andrade E. N., 1934, Philosophical Magazine, 17, 698-732.
CrossRef - Duhne C.R., 1979, Chemical Engineering, 86, 83-91.
CrossRef - Viswanath D. S. and Natarajan G., “Databook on Viscosity of Liquids,” Hemisphere, New York, 1989.
- Dutt N.V.K., Prasad D.H.L., “Representation of the Temperature Dependence of the Viscosity of Pure Liquids,” Private Communication, Chemical Engineering Division, Indian Institute of Chemical Technology, Hyderabad, 2004.
- Girifalco L.A., 1955, Journal of Chemical Physics, 23, 2446-2447.
CrossRef - Noureddini H.D.Z., Teoh B.C., and Clements L.D., 1992, Journal of the American Oil Chemists’ Society, 69, 1189-1191.
CrossRef - Noureddini H.D.Z., 1997, Journal of the American Oil Chemists’ Society, 74,1475-1463.
CrossRef - Lang W., Sokhansanj S., and Sosulski F.W., 1992, Journal of the American Oil Chemists’ Society, 69, 1054-1062.
CrossRef - Dutt N.V.K., 1990, Chemical Engineering Journal, 45, 83-86.
CrossRef - Kopylov N.I., 1960, Inzhenerno-Fizicheskii Zhurnal, 3, 97-103.
- Perry R.H., “Perry’s Chemical Engineerers’ Handbook,” 6thedn., McGraw–Hill, New York, 278-282, 1984.
- Goletz Jr E., and Tassios D., 1977, Industrial & Engineering Chemistry Process Design and Development, 16, 75-79.
CrossRef - Wochnowsky H., and Müssig B., 1983, Chemistry, 111, 123-131.
CrossRef - Kotas J., and Valešová M., 1986, Rheologica Acta, 259, 326-330.
CrossRef - Gupta A. and Sharma S.K, Toor A.P., 2007, Indian Journal of Chemical Technology, 14, 642-645.
- Stanciu I., 2012,Journal of Petroleum Technology and Alternative Fuels, 3, 19-23.
- Williams M.L., Landel R.F., and Ferry J.D., 1955, Journal of the American Chemistry Society, 77, 3701-3706.
CrossRef - Huachun Z., Delmar S., 2005, Transportation Research Record: Journal of the Transportation Research Board, 1, 25-27
CrossRef - Sopade P.A., Halley P., Bhandari B., D’Arcy B., Doebler C., Caffin N., 2002, Journal of Food Engineering,56, 67–75.
CrossRef - Ridha H., Imen M., Duaa A., Noureddine O., 2021, Chemical Physics. 452, 111076.
- Snoussi L., Shaik B., Herráez J.V., Akhtar S., Al-Arfaj A.A., Ouerfelli N., 2020, Iranian Journal of Chemistry and Chemical Engineering , 39(3), 287-301.
- Dallel M., Al-Arfaj A.A., Al-Omair N.A., Alkhaldi M.A., Alzamel N.O., Al-Zahrani A.A., Ouerfelli N., 2017, Asian Journal of Chemistry , 29(9), 2038–2050.
CrossRef - Dallel M., Al-Zahrani A.A., Al-Shahrani H.M., Al-Enzi G.M., Snoussi L., Vrinceanu N., Al-Omair N.A., Ouerfelli N., 2017, Physics and Chemistry of Liquids, 55(4), 541-557.
CrossRef - Stanciu I., Ouerfelli N., 2020, Journal of Biochemical Technology , 11(3), 52-57.
- Stanciu I., Messaâdi A., Díez-Sales O., Al-Jameel S.S., Mliki E., Herráez J.V., Ouerfelli N., 2020, Journal of Biochemical Technology, 11(3), 102-114.

This work is licensed under a Creative Commons Attribution 4.0 International License.
About The Author
![]()
A New Edition of Web of Science
Journal Impact Factor
2022: 0.5
Five Year: 0.8
Journal is Indexed in

Cabells Whitelist
![]()


