Screen Printing Strategy for Investigation of Spectrophotometric Properties of Modified Thick Films of Zirconium Oxide (ZrO2): Tin Oxide (SnO2) Composites
R. M. Nikam1* , A. P. Patil2, K. H. Kapadnis3, A. D. Ahirrao4 and R.Y.Borse5
1Department of Chemistry, M. J. M. A.C.S College, Karanjali, Tal- Peth, Dist-Nashik-422 208.
2Department of Zoology, L. V. H. A.C.S College, Panchavati, Dist-Nashik-422 003.
3Department of Chemistry, L. V. H. A.C.S College, Panchavati, Dist-Nashik-422 003.
4Department of Physics, K. T. H. M A.C.S College, Dist-Nashik-422 003.
5Department of Physics, M. J. M. A.C.S College, Karanjali, Tal- Peth, Dist-Nashik-422 208.
Corresponding Author E-mail: rohitnikam9@rediffmail.com
DOI : http://dx.doi.org/10.13005/ojc/370515
Article Received on : 10-Sep-2021
Article Accepted on :
Article Published : 04 Oct 2021
Reviewed by: Dr. Reyadh Ahmed
Second Review by: Dr. Sendilvelan Subramanian
Final Approval by: Dr. Pounraj Thanasekaran
There are numerous methods has been investigated and developed for the preparation of thin and thick films. Thick film technology is utilized for the production of electronic devices like surface mount devices, in the preparation of hybrid integrated circuit, in the formulation of heating elements, in the construction of integrated passive devices and sensors. Pure tin oxide (SnO2) and composite 1%, 3%, 5%, 7% and 9 % zirconium oxide (ZrO2) thick films of dimensions 2 cm×1 cm incorporated into pure tin oxide (SnO2) were prepared with standard screen printing method. All samples were fabricated on glass support. The thick films were subjected to drying and firing at 5000C at 5 hours in muffle furnace. Thick films of tin oxide (SnO2) and composite 1%, 3%, 5%, 7% and 9 % zirconium oxide (ZrO2) incorporated into pure tin oxide (SnO2) were checked for Scanning Electron Microscopy (S.E.M), Energy Dispersive X-ray Spectroscopy (E.D.A.X), X-ray diffraction (X.R.D), Fourier Transform infra-Red (F.T.I.R) and Ultra-Violet-Visible spectroscopy (U.V) for surface morphology, elemental analysis, crystalline phases of films, vibrational and spectrophotometric study respectively. In this research paper the spectrophotometric parameters such as absorbance and absorption coefficient with pure and compositional thick films were a part of investigation and surveillance.
KEYWORDS:Absorption Coefficient; Electronic Devices; Morphology; Thick Films; Tin Oxide
Download this article as:| Copy the following to cite this article: Nikam R. M, Patil A. P, K. H. Kapadnis K. H, Ahirrao A. D, Borse R. Y. Screen Printing Strategy for Investigation of Spectrophotometric Properties of Modified Thick Films of Zirconium Oxide (ZrO2): Tin Oxide (SnO2) Composites. Orient J Chem 2021;37(5). |
| Copy the following to cite this URL: Nikam R. M, Patil A. P, K. H. Kapadnis K. H, Ahirrao A. D, Borse R. Y. Screen Printing Strategy for Investigation of Spectrophotometric Properties of Modified Thick Films of Zirconium Oxide (ZrO2): Tin Oxide (SnO2) Composites. Orient J Chem 2021;37(5). Available from: https://bit.ly/3osGuiA |
Introduction
Thick film technology is more precisely and popularly called printed and fired technology. The principle of thick film technology includes the resistive, conductive, insulating pastes containing glass frit, deposited in patterns defined by screen printing and fused at high temperature on the surface of a ceramic substrate. Recently some of P-block metal oxide has paid much attraction and interest because of surface structure of nanostructure material. The extensive application of nanoparticles of zirconium oxide includes catalysis, insulator in transistor in electronics, cosmetics, medical field and bio-technology 1.
Oxidation number of tin oxide (SnO2) is four (+4) which able to tin oxide as an important role in oxidizing agents for organic synthesis2. Micro-sensors constructed with tin oxide material is found to be more reliable material because of its application in transistors, electrodes, gas sensors, liquid crystal displays, catalysts, photovoltaic devices, photo sensors, antistatic coatings, polishing and ceramic glazes3-4. Screen printing is chemical method for the preparation of thick films on glass or alumina substrate3. It is method to construct robust, compact and relatively cheap hybrid circuit for different technological applications such as gas sensor, electric and electronic appliances, transistors and optical devices4. Different methods has been introduced and decorated to grow pure tin oxide (SnO2) and different composites material of zirconium oxide (ZrO2) incorporated into pure tin oxide (SnO2) such as spray pyrolysis, vaccum evaporation, chemical vapour deposition, magentron sputtering, pulsed laser deposition, sol-gel technique and screen printing technique 5-6. Among all screen printing method has been gaining its popularity because of different advantages. An advantage of thick film techniques includes fast processing, low cost and economical use of paste7. Metal oxides have non-stoichiometric structure, defects in crystal lattice, different morphology and crystallite pattern which make them to employ into electrical and optical devices. Absorption spectra of tin oxide (SnO2) nanoparticles obtained in UV-Visible region shows blue shift in the absorption edge at 268 nm as compared to bulk8. The observed relative peak shift was useful in different applications like thick film resistor. The band gap and absorption edge modification of tin oxide takes place when different dopants like zinc oxide (ZnO), titanium oxide (TiO2), cuprous oxide (CuO), zirconium Oxide (ZrO2) and many other binary and ternary phase were added into different varying concentration9-10. In current research paper a different percentage composition of zirconium oxide (ZrO2): tin oxide (SnO2) composite nanomaterial prepared by screen printing method followed by firing in muffle furnace at 5000C for 5 hours has investigated for structural, morphological and spectrophotometric analysis for absorbance and absorbance coefficient with minimal concentration to maximum concentration in solvent phase11.
Material and Method
Preparation of Thick Films by screen printing method
Screen printing is a process of controlling fluid flow. The standard analytical grade tin oxide (SnO2) and zirconium oxide (ZrO2) chemical powder having purity grade 99.99 % was weighed. The tin oxide (SnO2) and zirconium oxide (ZrO2) powder of different composition was mixed and crushed carefully with glass frit and ethyl cellulose. Glass frit acts as permanent binder and ethyl cellulose acts as a temporary binder12. The mixture was mixed with butyl carbittol acetate (B.C.A) acts as organic vehicle to form the paste13. The paste was then screen printed on the surface of glass substrate14-17. The paste was controlled in such a way that it obtains morphological, thixotropic and rheological properties. In this way tin-oxide (SnO2) and composite thick films of zirconium oxide (ZrO2) blended into tin oxide (SnO2) were successfully prepared on glass substrate/support with particular dimension size (2×1 cm) by using standard screen-printing method. The details of the standard screen printing procedure is depicted in following flowchart (Figure 1).
 |
Figure 1: Flow sheet diagram of preparation of thick films for ZrO2 modified with Pure SnO2 |
After screen printing the thick films were subjected to heat treatment. Thick films were dried under ordinary visible lamp of 200 watt capacity for the time interval 3-4 hrs followed with firing for 5000C for 5 hrs in muffle furnace under air atmosphere. After a part of experimental work, thick films of pure tin oxide (SnO2) and composite zirconium oxide (ZrO2)-tin oxide (SnO2) were subjected to structural, morphological and spectrophotometric study. The detail research study involved in structural, morphological and spectrophotometric study was the study of X-ray diffraction in terms of particle size, scanning electron microscopy in terms of avarage diameter, fourier transform infra-red spectroscopy in terms of frequencies and wavelength, uv-visible study for absorbance and absorption coefficient with percentage compositional variation. Following characterization parameters were taken into account for remaining experimental work after succesfully preparation of screen printed thick films of tin oxide and tin oxide additive material.
Structural, Morphological and spectrophotometric characterization
X-ray diffraction (X.R.D) study
Peak position (2θ) was carried out to inspect crystalline phases of the tin oxide (SnO2) and zirconium oxide (ZrO2) additives thick solid films samples using X-ray diffraction (Miniflex Model, Rigaku, Japan) analysis in the range of 200-800. The instrumental broadening was cancelled using silicon standard sample. The single line approximation method has designated for the crystallite size determination using high intense peak. The average crystallite size of pure and composite tin oxide thick film samples were measured by using the Scherer equation18.
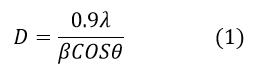
Where, 0.9 is shape factor,
D-average crystallite size,
λ-1.542 Å (X-ray wavelength),
β – Peak full width half maximum,
θ- Peak position.
Scanning Electron Microscopy (S.E.M) study
S.E.M analysis is powerful investigation and explorative tool which uses a focused beam of electrons to produce complex, high resolution and magnification images of a surface topography of samples. The microstructure and chemical composition of the thick films of tin oxide and additive material of tin oxide with zirconium oxide (ZrO2) were scrutinized using a scanning electron microscope [Nova nano SEM NPEP303] coupled with an energy dispersive spectrometer (EDS JEOL, JED-2300, Germany).
Fourier Transform Infra-Red (F.T.I.R) study with KBr disc method
F.T.I.R is useful technique to construe qualitative and quantitative measurement for organic and inorganic samples. It is useful for solids, liquids and gaseous samples. It measures the wide range of wavelengths in Infra-red spectra that are absorbed by the nanomaterial. The F.T.I.R was completed by a standard method of solid phase potassium bromide (KBr) process. The FTIR spectra was chronicled at room temperature for pure tin oxide (SnO2) and composite 1%, 3%,
5%, 7% and 9 % zirconium oxide (ZrO2) mixed in pure tin oxide (SnO2)inIRAffinity-1 Shimadzu F.T.I.R instrument. A small amount 2 to 5 mg sample powder was assorted in approximate 250 mg-300 mg Potassium Bromide (KBr) of spectrophotometric grade purity made up of UVASOL Company to form clear transparent proper 13 mm circular disc with 1 mm thickness when mixture was pressed in KBr Press Model M-15 at a pressure of about 5×10⁶ Pa in an evacuated die. The following F.T.I.R spectra were recorded between 400 cm-1 to 4000 cm-1 consist of transmittance at different spectral resolution of 2 cm-1 and taking 32 scans for each pure and composite sample.
Ultra-Violet-Visible (U.V-Visible) study
UV spectroscopy is strong non-destructive testing method for discovering the properties of semiconductor nanomaterial for the study of absorbance, transmittance and reflectance. Absorbance strongly depends on nature of modified surface, oxygen deficiency of the structure, band gap and impurity centers present. The UV absorbance of pure tin oxide (SnO2) and composite form of 1%, 3%, 5%, 7% and 9 % zirconium oxide (ZrO2) amalgamated into pure tin oxide (SnO2) was recorded on UV spectrophotometer 2012 made analytical technology Ltd. 1mg of sample powder of all pure and composites of tin oxide was dissolved into 10ml 1N H2SO4 as a solvant to form clear transparaent solution followed by 10 minutes sonication for all samples. A cuvette of 1 cm3 was employed for measurment with scan step 5 nm with wide range of 200 nm to 800 nm. Duterium amd Tungston lamp was used as a source of radiation for broad range with photo-diode array detector. A solvant was emplyed for dissolution purpose. The solvent effect was nullified as blank reading. The absorption coefficient α is related to absorbance by following equation19-20,
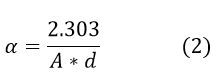
Where, α- absorption coefficient
A-Absorbance of material,
d- Path length of cuvette or cell.
Result and Discussion
X-Ray Diffraction (X.R.D) analysis
X-ray diffraction is a plot of peak position with intensity along X-axis and Y-axis respectively. The screen printed composite thick films of zirconium oxide (ZrO2) with tin oxide and tin oxide (SnO2) base material were crystalline as indicated in figure 2. The multiplot was well oriented along planes (110), (101) and (211). From the nature of peak, multiplot confirms the presence of polycrystalline. Diffraction peaks does not consist of any characteristic impurities. A remarkable change in intensities of X-ray diffraction spectrum of the percentage composition along with base material is also observed. It has been evident from the figure that polycrystalline nature of spectrum is well orient along (110) plane. All observed peaks well concurrent with J.C.P.D.S card no. 41-41459. The higher peak intensities in an X-ray diffraction pattern along the spectrum are due to better crystalinity and bigger grain size attributed to agglomeration of nanoparticles as shown in S.E.M image also. The molar densities play a vital role in deciding the higher or lesser densities along the spectra. The crystallite sizes were calculated using Scherer equation (eq.1). The average crystallite size varies in the range of 19 nm to 24 nm.
 |
Figure 2: X.R.D spectra of (a) Pure SnO2 (b) 1% ZrO2:SnO2 (c) 3% ZrO2: SnO2 (d) 5% ZrO2:SnO2 (e) 7% ZrO2:SnO2 (f) 9% ZrO2:SnO2 |
Scanning Electron Microscopy (S.E.M) and E.D.A.X analysis
Scanning electron microscopy is a high-resolution imaging technique for evaluating various materials to surface fractures, flaws, contaminants and corrosion. The principle of scanning electron microscopy is consist of focussed beam of secondary electrons interact with atoms present in sample produces various signals. The secondary electron consists of information about the surface topography and composition of sample. All images were scaled quickly at 30000x with 3 μm dimension. The following S.E.M image (figure 3) exposes that all nanocomposite micrograph were well agglomerated meso-porous in nature with pores interconnected. Some of the images has miniscule crack into their surface nature. The avarage particle diameter of scanned images in between 45 nm to 63 nm. The avarage particle diameter of nanomaterial is inversly proportional to its avarage surface area. The exposed particle diameter for any physical or chemical property like absorbance measurement is a function of its surface area.
 |
Figure 3: S.E.M image of (a) Pure SnO2 (b) 1% ZrO2:SnO2 (c) 3% ZrO2: SnO2 (d) 5% ZrO2:SnO2 (e) 7% ZrO2:SnO2 (f) 9% ZrO2:SnO2 |
Elemental analysis by E.D.A.X is a tehnique to introduce qualitative and quanititative aspect for nanomaterial. From figure 4, it has been evident to presence of pure tin oxide (SnO2) and composite zirconium oxide (ZrO2)-tin oxide (SnO2)nanomaterial in appropriate form, indicating percentage composition were effectively prepared at room temprature under normal conditions.
 |
Figure 4: E.D.A.X spectra of corresponding to (a) Pure SnO2 (b) 1% ZrO2:SnO2 (c) 3% ZrO2: SnO2 (d) 5% ZrO2:SnO2 (e) 7% ZrO2:SnO2 (f) 9% ZrO2:SnO2 |
Fourier Transform Infra-Red Spectroscopy (F.T.I.R) analysis
Fourier Transform Infra-Red Spectroscopy is useful to reveal the nature of boding in the scan range of 400-4000 cm-1 for compositional thick films tin oxide-zirconium oxide (SnO2:ZrO2) as shown in figure 5. The frequencies observed in the range of 401 cm-1 to 619 cm-1 due to presence of zirconium-oxygen (Zr-O) and tin-oxygen (Sn-O) bonding. The I.R band at 1633 cm-1 to 1511 cm-1 attributes to stretching vibrations of deformation mode of Metal-OH groups. The broad band region observed at 3410 cm-1 to 3623 cm-1 corresponds to presence of hydroxyl groups at the surface of thick films of pure and doped tin oxide21.
 |
Figure 5: F.T.I.R spectra of corresponding to (a) Pure SnO2 (b) 1% ZrO2:SnO2 (c) 3% ZrO2: SnO2 (d) 5% ZrO2:SnO2 (e) 7% ZrO2:SnO2 (f) 9% ZrO2:SnO2 |
Spectrophotometric analysis
Spectrophotometer can be divided into according to type of wavelength and nature of application situation. The absorbance of zirconium oxide (ZrO2)-tin oxide (SnO2) nano powder with different composition is depicted in following figure 6.
 |
Figure 6: UV-Visible spectra of (a) Pure tin oxide (SnO2) (b) Composite % zirconium oxide (ZrO2): tin oxide (SnO2) and zero absorbance line of solvent |
It has been clear to view the crisscross nature of graph. The solvant effect was first negated as blank reading. Standard path length of cylindrical cuvette/cell was 1 cm3. Zero slovant absorbnace line clearly indicates that there is no effect of solvant on the absorbance spectra of pure tin oxide (SnO2) and composite 1%, 3%, 5%, 7% and 9% zirconium oxide (ZrO2) incorporated into pure tin oxide (SnO2). The variation of absorbance and absorption coefficient with percentage composition follows the linear graph which was inclined in downward direction as depicted in fig . 7. Particle size and morphology plays an important and sigificant role on the spectoscopic investigation of different constituent of tin oxide composite materials22-23.
 |
Figure 7: Spectrophotometric graph of (a) absorbance Vs. % doping concentration of composite % zirconium oxide (ZrO2): tin oxide (SnO2) (b) Absorption coefficient Vs. % doping concentration of composite % zirconium oxide (ZrO2): tin oxide (SnO2) |
Table 1 summerizes the value for absorbance and absorption coefficient corresponding to pure and each percentage composition,
Table 1: indicates Percentage composition of Absorbance (A) and absorption coefficient (α).
|
% Composition |
Absorbance |
Absorption Coefficient |
|
0 |
2.6005 |
5.9889515 |
|
1 |
2.6603 |
6.1266709 |
|
3 |
2.4131 |
5.5573693 |
|
5 |
2.59 |
5.96477 |
|
7 |
1.1962 |
2.7548486 |
|
9 |
2.6005 |
5.988952 |
Conclusion
The screen printed thick films of nanostructured zirconium oxide-tin oxide (ZrO2) compositional material and pure tin oxide (SnO2) nanomaterial fired at 5000C for 5 hours are highly crystalline as described in X.R.D. The S.E.M study reveals the thick films were porous in nature. The prepared materials should be useful for any surface modification for nano-properties. Elemental analysis indicates the presence of zirconium oxide (ZrO2)-tin oxide (SnO2) powder was successfully prepared in definite ratio. F.T.I.R study reveals proper bonding and frequencies in transmittance region. The UV-visible study reveals that the absorbance of 1% Zirconium oxide (ZrO2)-Tin oxide (SnO2) maximum with absorbance value 2.66 and corresponding absorption coefficient value is 6.12 cm-1. The absorbance of 7% Zirconium oxide (ZrO2)-Tin oxide (SnO2) minimum to absorbance value 1.19 and corresponding absorption coefficient value is 2.75 cm-1.
Acknowledgement
The authors are grateful to former B.C.U.D Director & Honorable Principal Dr. V. B. Gaikwad (K.T.H.M College, Nasik, Maharashtra state, India) for his constant support in research activities. The authors are also indebted to Department of Chemistry, S. P. P. University, Pune, Maharashtra state, India.
Conflict of Interest
The authors of the research article declares that there no conflict of interest in current research work.
References
- Keiteb, A. S.; Saion, E.; Zakaria, A.; Soltani, N.; Structural and Optical properties of Zirconia nanoparticles by thermal treatment synthesis, Journal of nanomaterials, 2016, 1-7, Article ID-1913609
CrossRef - Nikam, R. M.; Kapadnis, K. H.; Borse, R. Y.; Electrical and structural Characterization of Fired SnO2 thick films by screen printing technique, International Journal for research in applied science & Engineering Technology 2020, 8(3) 157-162.
- Krishnan, B.; and Nampoori, V.P.N.; Screen printed nanosized ZnO thick film, Bulletin of material science, 2005, 28(3), 239-242.
CrossRef - Guidi, V.; Butturi, M.A.; Carotta, M.C.; Cavicchi, B.; Ferroni, M.; Malagu C.M.; Artinelli, G.; Vincenzi, D.; Sacerdoti, M.; Zen, M.; Solid state gas sensor, Sensors and actuators B, 2002, 84(1), 72-77.
CrossRef - Joseph, B.; Gopalchandran, K.G.; Manoj, P.K.; Koshy, P.; Vaidyan, V.K.; Optical and electrical properties of zinc oxide films prepared by spray pyrolysis, Bulletin of material science, 1996, 22(5), 921-926.
CrossRef - Jaydev, D.N.; Sainkar, S.R.; Karekar, R.N.; Aiyer, R.C.; Formulation and characterization of ZnO:Sb thick film gas sensors, Thin solid films, 1998, 325(1-2), 254-258.
CrossRef - Borse, R.Y.; Sensors and transducers principles and investigation, first ed. 2008. ISBN:978-81-8435-052-4, adhyayan publishers & distributors, New Delhi.
- Shukla, T.; Synthesis of tin oxide thick film and its investigation as a LPG Sensor at Room temperature, Journal of sensor technology, 2012, 2,102-108.
CrossRef - Verma, M.K.; and Gupta, V.; Tin oxide SnO2-CuO nanocomposites thin film sensor for fast detection of H2S gas, Journal of Experimental Nanoscience, 2013, 8(3), 326-331.
CrossRef - Hassan, E.S.; Mubarak, T.H.; Abbas, K.H.; Chiad, S.S.; Hubabi, N.F.; Rahis, M.H.; Khadayeir, A.A.; Dawo; M.O.; Al-Baidhany, I.A.; Structural morphological and optical characterization of tin doped zinc oxide thin film by (SPT), IOP Conf. Series: Journal of physics: conf. series, 2019, 012013 1234, 1-9.
CrossRef - Hajar, S.; Davoud, D.; Influence of size and morphology on the optical properties of carbon nanostructures, J .Theor. Appl. Phys., 2016, 10, 7-13.
CrossRef - Ansari, S.G.; Boroojerdian, P.; Kulkarni, S.K.; Sainkar, S.R.; Karekar, R.N.; Aiyer, R.C.; Effect of Thickness on H2 gas sensitivity of tin oxide (SnO2) nano particles based thick film resistors; Journal of Materials Science: Materials in Electronics, 1996, 7, 267-270.
CrossRef - Prudenziati, M.; and Morten, B.; Thick film Sensors. An Overview, Sensors and Actuators. 1996, 10, 65-82.
CrossRef - Harper, C. A.; Handbook of Thick film hybrid Microelectronics, 1974, McGraw Hill Book Co., New York.
- Kiran, J.; Pant, R.B.; Laxmikumar, S.T.; Effect of Ni doping on thick film tin oxide (SnO2) gas Sensor. Sensors and Actuators, B, 2006, 113, 823-829.
CrossRef - Nimal, A.T.; Vijay Kumar.; Gupta, A K.; Superconducting transition edge bolometer based on single phase BPSCCO2223 thick film, Indian Journal of pure and applied physics. 2004, 42, 275-278.
- Patil, L.A.; Wani, P.A.; Amalnerakar, D.P.; Studies on fritted thick films of photoconducting CdS, Mater. Chem. Phys, 1998, 55, 79-83.
CrossRef - Chatterjee, K.; Chatterjee, S.; Banerjee, A.; Raut, M.; Pal, N.C.; Sen, A.; Maiti, H.S.; The effect of palladium incorporation on methane sensitivity of antimony doped tin dioxide, Mater. Chem. and Phys. 2003, 81, 33-38.
CrossRef - Hajar, S.; and Davoud, D.; Influence of size and morphology on the optical properties of carbon nanostructures, J .Theor. Appl. Phys., 2016, 10, 7-13.
CrossRef - Ahmed, R. M.; EL-Bashir, S.M.; Structure and physical properties of polymer composite films doped with fullerene nanoparticles. International Journal of Photoenergy., 2011, Article ID 801409, 1-6, https://DOI-10.1155/2011/801409.
CrossRef - Sidhu, G. K,; Kaushik, A. K,; Rana, S,; Bhansali, S,; Kumar R.; Photoluminescence quenching of zirconia nanoparticle by surface modification, Applied surface science., 2014, 28895, 1-6, http://dx.doi.org/10.1016/j.apsusc.2014.10.036
CrossRef - Karthik, T.V.K.; Martinez, V.; Agrawal, V.; Porous silicon ZnO/Tin oxide (SnO2) structures for CO2 detection, Journal of alloys and Compounds, 2008, 731, (853-863).
CrossRef - Mursal.; Irhamni.; Bukhari.; Zulkarnain J.; Structural and optical properties of ZnO based thin films deposited by sol gel spin coating method, Semirata-International conference on science and technology-2018, IOP conf. series, Journal of physics.,2018, 1116, 1-6,
CrossRef

This work is licensed under a Creative Commons Attribution 4.0 International License.
About The Author
![]()
A New Edition of Web of Science
Journal Impact Factor
2022: 0.5
Five Year: 0.8
Journal is Indexed in

Cabells Whitelist
![]()


