Pharmacoinformatics Profiling and Dynamic Studies of Selected Compounds Acting as Potential Inhibitors against DPP4 Enzyme
Shubham Roy1 , Ratul Bhowmik2, Sounok Sengupta3*, Sameer Sharma4, Bharti Vyas5 and Imran A Khan6
1,2Department of Pharmaceutical Chemistry, SPER, Jamia Hamdard, New Delhi, India.
3Department of Pharmacology, NSHM Knowledge Campus, Kolkata-Group of Institutions, Kolkata, West Bengal, India.
4Department of Bioinformatics, BioNome Private Limited, Bengaluru, India.
5School of Interdisciplinary Studies, Jamia Hamdard, New Delhi, India.
6Department of Chemistry, School of Chemical and Life Sciences, Jamia Hamdard, New Delhi, India.
Corresponding Author E-mail: sounok620@gmail.com
DOI : http://dx.doi.org/10.13005/ojc/370502
Article Received on : 15-Sep-2021
Article Accepted on :
Article Published : 13 Oct 2021
Reviewed by: Dr. Faiz Bin Arith
Second Review by: Dr. M.Mohammad
Final Approval by: Dr. Pounraj Thanasekaran
DPP-IV rapidly degrades glucagon-like peptide-1 and glucose-dependent insulinotropic peptides. Delaying the breakdown of endogenous incretin hormones with DPP-IV inhibitors may help correct the physiologic deficit. The purpose of this work is to identify new compounds that inhibit the DPP-IV enzyme. The anticipated compounds were potent anti-diabetic candidates in this investigation. Two 2d QSAR models were created using 179 different substances from diverse sources. QSAR models were created using two methods. The first technique included docking score as an additional descriptor, while the second did not. Docking-based QSAR considered 74 compounds out of 179. Another approach used 40 molecules from 179 compounds. Each method had a precise strategy. Descriptors were computed using DRAGON for both training and test sets. Using DRAGON data, SYSTAT generated regression curves. The docking-based QSAR model produced R2=0.7098 (training set) and R2=0.9987 (test set), whereas the other technique produced R2=0.7644 (training set) and R2=0.9857 (test set).
KEYWORDS:Docking; Dragon; DPP IV; Molecular Dynamics Simulations; QSAR; SYSTAT
Download this article as:| Copy the following to cite this article: Roy S, Bhowmik R, Sengupta S, Sharma S, Vyas B, Khan I. A. Pharmacoinformatics Profiling and Dynamic Studies of Selected Compounds Acting as Potential Inhibitors against DPP4 Enzyme.Orient J Chem 2021;37(5). |
| Copy the following to cite this URL: Roy S, Bhowmik R, Sengupta S, Sharma S, Vyas B, Khan I. A. Pharmacoinformatics Profiling and Dynamic Studies of Selected Compounds Acting as Potential Inhibitors against DPP4 Enzyme.Orient J Chem 2021;37(5).Available from: https://bit.ly/2YMHfZe |
Introduction
Diabetes is a worldwide metabolic disorder that has become a widespread epidemic disease in the last few decades, owing especially to the increasing frequency and incidence of Type 2 diabetes mellitus (T2DM), which affects 90–95 percent of people with the disease and is difficult to cure. The ultimate treatment goals for T2DM include the long-term regulation of blood sugar levels and the treatment of diabetes complications. Exercise plays an important role in the prevention and control of insulin resistance, prediabetes, gestational diabetes mellitus, type 2 diabetes, and diabetes-related health problems. Exercise must be done regularly to reap long-term benefits, and it must comprise a variety of regular pieces of training. Aerobic and resistance training both increase insulin action, at least immediately, and aid in the management of blood glucose levels, lipids, blood pressure, cardiovascular risk, mortality, and quality of life. For all of the reasons described above, physical exercise is an important component in the prevention and control of type 2 diabetes and can be regarded as a cornerstone of diabetes management, along with proper food and medicine. Current oral therapy options include sulfonylureas, metformin, thiazolidinedione derivatives, glycosidase inhibitors, and newly developed dipeptidyl peptidase-4 (DPP-4) inhibitors and glucagon-like peptide-1 (GLP-1) analogs (1,2).
Glucagon-like peptide-1 (GLP-1) is an incretin hormone. Which is secreted by intestinal L-cells in response to food intake. The active form of GLP-1 is a 30-amino acid long peptide, which stimulates insulin release, inhibits glucagons release, and slows down gastric emptying. Each of these phenomena benefits in the control of glucose homeostasis in patients with type II diabetes. The active form of GLP-1 is rapidly inactivated (t1/2 = 1 min) by the plasma DPP-IV enzyme, which cleaves a dipeptide from the N-terminus (14,15). Thus inhibition of DPP-IV extends the half-life of endogenously secreted GLP-1, which in turn enhances insulin secretion and improves glucose tolerance. (3–5).
The main enzyme of interest considered in this study is the DPP-4 inhibitors. DPP IV (dipeptidyl peptidase IV) is a versatile protein involved in a variety of physiological functions. It acts as a binding protein, a receptor, and a proteolytic enzyme. It’s a serine peptidase from the S9b protein family. DPP IV occurs as a soluble homodimer and as a ubiquitous type II integral plasma membrane glycoprotein. It has a strong link to several disorders, including diabetes, obesity, and tumor growth, making it an appealing target for drug discovery research (2,6,7).
DPP-IV is a serine protease that deactivates the glucagon-like peptide 1 (GLP-1) and the glucose-dependent insulinotropic peptide (GIP), both of which stimulate insulin production. GLP-1 is a substrate of DPP-IV, a major incretin hormone that regulates glucose activity in a glucose-dependent manner, inhibits glucagon release, reduces stomach emptying, and promotes islet-cell regeneration and differentiation. DPP-IV inhibitors raise the concentration of active GLP-1 in the blood and promote insulin release in response to an increase in blood glucose levels. In-silico approaches appear to be a potent practice in the area of technology for creating new and optimized pharmacological agents with superior therapeutic intervention. The quantitative association between structural characteristics of substances and their biological activity is studied using statistical correlation analysis in QSAR. It is a key method in the design of ligand-based drugs. In this study, we presented a 2D QSAR methodology for generating and optimizing new medicines against the DPP-IV enzyme from the existing literature. We used computational methods such as 2D QSAR modeling, molecular docking, virtual screening, and molecular dynamics simulation to develop a new, selective, and powerful DPP-IV inhibitor for diabetes treatment. The findings of this study could be crucial in the future development of effective Type II anti-diabetic medicines based on prospective DPP-IV inhibitors.
Materials and Methods
2D QSAR modeling
However, because of the extremely diverse structure, no promising 2d QSAR model emerged. Only those compounds with structurally similar scaffolds, such as pyrimidine, xanthene, quinazolinone, and imidazoquinoline, were chosen, and they were divided into the training and test sets. All of the compounds were chosen using the following criteria: (i) Both training and test sets should cover the broadest range of molecular bioactivities (IC50); (ii) both low-active and high-active compounds should be included; and (iii) both training and test sets should include varied architectures. The training set consists of 34 compounds with high structural diversity and a broad range of molecular bioactivities with PIC50 values ranging from 4.6 to 9 nM (PIC50 = 9-log IC50) [Table 2, 3].
The first step was the calculation of the 2d descriptors of both the training and test sets using the DRAGON software (8). DRAGON provides over 900 2d characteristics for any molecule. In our test set of 7 molecules, out of 900 2d descriptors only those variable were chosen that has a high correlation with the experimental PIC50 value but has less correlation with each other. Those are the descriptors Har2, BELm4, BEHv3, and VEe1. The main characteristic of these four columns of descriptors (or variable) is very less correlation with each other. But each of these 4 columns has a high correlation with the experimental PIC50 column. Har2 descriptors are topological descriptors that relate to the square reciprocal distance sum index. BELm4 corresponds to the burden matrix’s lowest eigenvalue n. 4 weighted by atomic masses. BEHv3 is the highest eigenvalue n. 3 of the burden matrix/weighted by the atomic van der Waals volume. The eigenvector coefficient sum from the electronegativity weighted distance matrix corresponds to VEe1 (Refer to the Dragon software) [Table 1].
Out of 40 molecules 7 molecules were randomly chosen as the test set and the remaining 33 molecules were considered as the training set. The next step was forecasting the predicted PIC50 value of test set molecules using the SYSTAT program (total 7 molecules with mole ID 60,62,147,152,171,172, 179). The column of experimental PIC50 value of the test set was chosen as the dependent variable, while the other four columns of the test set were chosen as the independent variables. As a result, we obtained the following chart [Table-1] in SYSTAT software (9). Then by using this chart we generate a formula to predict the PIC50 value (explain in result section). The same formula is also used to predict the PIC50 value of the training set.
Table 1: The figure represents Regression coefficient data obtained from the test set. Here variables 2, 3, 4, 5 are the variables Har2, BELm4, BEHv3, VEe1 Respectively.
|
Effect |
Coefficient |
Standard Error |
Standard Coefficient |
Tolerance |
T |
P-Value |
|
CONSTANT |
35.225 |
21.112 |
0 |
. |
1.668 |
0.237 |
|
VAR(2) |
0.395 |
0.16 |
6.799 |
0.001 |
2.475 |
0.132 |
|
VAR(3) |
-5.682 |
5.572 |
-0.51 |
0.029 |
-1.02 |
0.415 |
|
VAR(4) |
15.811 |
6.56 |
1.4 |
0.021 |
2.41 |
0.138 |
|
VAR(5) |
-22.893 |
9.757 |
-6.633 |
0.001 |
-2.246 |
0.144 |
Table 2: This represents test set analysis for 2D QSAR (without docking approach)
|
Mol ID |
PIC50 experimental |
Har2 |
BELm4 |
BEHv3 |
VEe1 |
PIC50 predicted |
|
60 |
4.040100412 |
78.008 |
1.372 |
3.259 |
4.619 |
4.027738 |
|
62 |
4.460798401 |
68.396 |
1.268 |
3.183 |
4.415 |
4.290462 |
|
147 |
5.677780705 |
84.942 |
1.524 |
3.369 |
4.688 |
6.062597 |
|
152 |
9 |
152.052 |
1.725 |
3.559 |
5.804 |
8.884467 |
|
171 |
7.356547324 |
110.05 |
1.605 |
3.581 |
5.188 |
7.425447 |
|
172 |
8.151810883 |
133.488 |
1.688 |
3.597 |
5.556 |
8.040203 |
|
179 |
6.673664139 |
78.505 |
1.599 |
3.451 |
4.602 |
6.359132 |
Table 3: This represents training set analysis for 2D QSAR (without docking approach)
|
Mol ID |
Experimental PIC50 |
Har2 |
BELm4 |
BEHv3 |
VEe1 |
Predicted PIC50 |
|
2 |
4.616184634 |
66.487 |
1.505 |
3.182 |
4.393 |
2.677608 |
|
15 |
6.482804102 |
108.44 |
1.46 |
3.493 |
5.227 |
5.329192 |
|
23 |
9 |
154.956 |
1.677 |
3.558 |
5.815 |
10.036649 |
|
28 |
8.522878745 |
141.096 |
1.719 |
3.558 |
5.633 |
8.489831 |
|
34 |
7.677780705 |
115.022 |
1.394 |
3.556 |
5.321 |
7.148245 |
|
35 |
7.107905397 |
143.723 |
1.664 |
3.662 |
5.838 |
6.791285 |
|
54 |
7.050609993 |
111.897 |
1.62 |
3.461 |
5.18 |
6.355606 |
|
61 |
4.485585079 |
72.097 |
1.372 |
3.253 |
4.512 |
4.047578 |
|
63 |
5.826813732 |
108.44 |
1.46 |
3.475 |
5.228 |
5.021701 |
|
64 |
6.301899454 |
113.587 |
1.459 |
3.505 |
5.316 |
5.520194 |
|
72 |
7.102372909 |
123.146 |
1.449 |
3.54 |
5.404 |
7.89162 |
|
74 |
6.872895202 |
122.849 |
1.447 |
3.548 |
5.4 |
8.003729 |
|
95 |
6.443697499 |
137.347 |
1.663 |
3.657 |
5.751 |
6.191083 |
|
96 |
6.943095149 |
149.725 |
1.663 |
3.658 |
5.923 |
7.158608 |
|
97 |
6.906578315 |
137.897 |
1.663 |
3.657 |
5.755 |
6.316761 |
|
98 |
5.907981529 |
132.262 |
1.663 |
3.655 |
5.669 |
6.028112 |
|
99 |
7.974694135 |
132.596 |
1.576 |
3.577 |
5.468 |
10.022611 |
|
100 |
7.869666232 |
144.926 |
1.662 |
3.58 |
5.64 |
10.514146 |
|
120 |
8.958607315 |
132.612 |
1.576 |
3.61 |
5.479 |
10.298871 |
|
122 |
8.397940009 |
154.892 |
1.658 |
3.701 |
5.915 |
10.091 |
|
123 |
8.15490196 |
130.712 |
1.568 |
3.631 |
5.581 |
7.590772 |
|
148 |
6.397940009 |
139.474 |
1.72 |
3.461 |
5.634 |
6.286899 |
|
149 |
7.638272164 |
139.474 |
1.677 |
3.461 |
5.64 |
6.393867 |
|
151 |
7.602059991 |
145.813 |
1.722 |
3.558 |
5.717 |
8.412988 |
|
153 |
8.823908741 |
161.508 |
1.738 |
3.559 |
5.884 |
10.714281 |
|
154 |
8.698970004 |
161.508 |
1.699 |
3.559 |
5.89 |
10.798521 |
|
157 |
8.045757491 |
95.824 |
1.548 |
3.51 |
4.899 |
7.623547 |
|
158 |
8 |
142.477 |
1.639 |
3.573 |
5.63 |
9.79573 |
|
174 |
7.838631998 |
139.144 |
1.678 |
3.597 |
5.641 |
8.385238 |
|
175 |
8.330683119 |
139.341 |
1.678 |
3.597 |
5.644 |
8.394374 |
|
176 |
8.809668302 |
140.124 |
1.671 |
3.596 |
5.644 |
8.727622 |
|
177 |
6.065501549 |
78.511 |
1.453 |
3.451 |
4.603 |
7.168181 |
|
178 |
6.340273905 |
72.996 |
1.546 |
3.448 |
4.499 |
6.794769 |
The fundamental issue with 2d QSAR is that it fails when the structure of the molecules and their scaffold is extremely diverse. For a highly diverse structure, even 3d QSAR fails. The key reason for the failure is that only ligand-based QSAR was used. No DRAGON characteristics are related to receptor-ligand interactions. The descriptors of DRAGON only give an idea about the ligand structure and morphology. But the IC50 value of a drug is highly correlated with receptor-ligand interaction-related values such as Docking Score, Ligand Efficiency, Glide Ligand Efficiency, Glide Gscore, Glide Lipo, Glide Hbond, Glide Rewards, Glide Evdw, Glide Ecoul, Glide Erotb, Glide Esite, Glide Emodel, Glide Energy, Glide Einternal, Glide Confnum, Glide Posenum, and so on.
Molecular Docking
A new dataset consisting of 74 compounds was established from the list of 179 original sets of compounds. These 74 compounds were docked against the DPP-IV receptor.
Protein Preparation
The crystal structure of protein Human DPP-4 (Dipeptidyl peptidase-4) (PDB ID: 6B1E) was downloaded from the Protein Data Bank (PDB) and modeled in this study using Protein preparation wizard (Maestro version 11.4) at 2.2 Å (10,11). Protein structures must be processed before they can be employed as a receptor for docking. Some common activities are I hydrogen atom addition, (ii) atomic charge assignment, (iii) removal of water molecules that are not involved in ligand binding, and (iv) selenocysteine replacement with cysteines.
Site Map Generation
The site map generation tool was used to identify the probable binding site of the protein. The binding site containing the native ligand was chosen for the docking study.
Ligand Preparation
The ligand structures were created in the CDX format using the application Chem Draw extreme version 8.0. These ligands were then translated to the mol2 3d format and run using the Maestro LigPrep module in the Schrodinger suite, version 11.4 (12). They were transformed to a stable form by minimizing energy and optimizing missing hydrogen atoms. These ligands’ bond orders were set, and the charged groups were neutralized. The ionization and tautomeric states were created using the Epik module at pH levels ranging from 6.8 to 7.2. Compounds were minimized in the last stage of LigPrep.
Receptor Grid Generation
For the selected binding site, the grid was generated taking the binding site as the centroid.
Glide Ligand Docking
The proposed compounds were glide docked using the previously created receptor grid and ligand molecules. 74 molecules were docked for the chosen grid. The Glide ligand docking program was used to score the favorable contacts between ligand molecules and the receptor (13). All docking calculations were done in standard precession (SP) mode with the OPLS-2005 force field.
2D QSAR modeling with help of docked scores
There is no good association between the docking score and the experimental PIC50 result. Because, in addition to docking score, other factors such as Ligand Efficiency, Glide Ligand Efficiency, Glide Gscore, Glide Lipo, Glide Hbond, Glide Rewards, Glide Evdw, Glide Ecoul, Glide Erotb, Glide Esite, Glide Emodel, Glide Energy, Glide Einternal, Glide Confnum, Glide Posenum, and so on are responsible for a molecule’s activity (PIC50). As a result, an attempt was made to identify the best descriptors among them that are highly connected with the experimental PIC50 value. Then, a test set of 9 random molecules was created. The remaining molecules (65 molecules) are used as the training set.
All compounds in the training and test sets were chosen using the following criteria: (i) Both training and test sets should cover the broadest range of molecular bioactivities (IC50); (ii) both low-active and high-active compounds should be included; and (iii) both training and test sets should include varied architectures. The training set contains 65 compounds exhibiting high structural diversity and a broad range of molecular bioactivities with PIC50 values ranging from 4.6 to 9 nM (PIC50=9-log IC50) [Table 5, 6].
In SYSTAT software, the experimental PIC50 is used as the dependent variable for the test set (9 molecules), and a couple of the above-mentioned descriptors (which are highly correlated with the experimental PIC50 value) are used as the independent variable. As a result, we were able to gather the following information. Then, using a test set, an attempt was made to construct a regression curve and produce an activity forecasting equation [Table 4].
Table 4: Data obtained from SYSTAT software using docking score as an additional descriptor Regression Coefficients B=(X’X)-1X’Y
|
Effect |
Coefficient |
Standard Error |
Standard Coefficient |
Tolerance |
T |
P-Value |
|
CONSTANT |
5.796 |
0 |
0 |
. |
. |
. |
|
VAR(2) |
0.002 |
0 |
0.449 |
0.112 |
. |
. |
|
VAR(3) |
0.021 |
0 |
0.447 |
0.148 |
. |
. |
|
VAR(4) |
0.005 |
0 |
0.485 |
0.096 |
. |
. |
|
VAR(5) |
-146.025 |
0 |
-121.132 |
0 |
. |
. |
|
VAR(6) |
-128.175 |
0 |
-6.327 |
0 |
. |
. |
|
VAR(7) |
-640.812 |
0 |
-81.364 |
0 |
. |
. |
|
VAR(8) |
951.967 |
0 |
203.829 |
0 |
. |
. |
|
VAR(9) |
0.038 |
0 |
0.249 |
0.135 |
. |
. |
Table 5: This represents test set analysis for 2D QSAR with docking approach
|
Source File |
Experimental Pic50 |
Potential Energy-Opls-2005 |
Bend Energy-Opls-2005 |
Solvation Energy-Opls-2005 |
Docking Score |
Glide Ligand Efficiency |
Glide Ligand Efficiency Sa |
Glide Ligand Efficiency Ln |
Glide Evdw |
Predicted Pic50 |
|
14.mol2 |
7.37675071 |
54.022 |
67.719 |
-72.561 |
-4.539 |
-0.175 |
-0.517 |
-1.066 |
-33.386 |
7.435752 |
|
64.mol2 |
6.301899454 |
-285.357 |
51.051 |
-94.059 |
-5.785 |
-0.199 |
-0.613 |
-1.325 |
-33.606 |
6.272965 |
|
93.mol2 |
7 |
208.983 |
32.347 |
-65.123 |
-4.229 |
-0.136 |
-0.429 |
-0.954 |
-30.885 |
7.097363 |
|
113.mol2 |
6.928117993 |
-101.134 |
47.523 |
-96.796 |
-5.879 |
-0.226 |
-0.67 |
-1.381 |
-33.726 |
6.952285 |
|
168.mol2 |
6.638272164 |
12.662 |
24.868 |
-93.219 |
-4.365 |
-0.175 |
-0.511 |
-1.035 |
-31.178 |
6.69153 |
|
131.mol2 |
5.756961951 |
-552.935 |
16.842 |
-331.248 |
-6.637 |
-0.277 |
-0.798 |
-1.589 |
-26.468 |
5.746601 |
|
149.mol2 |
7.638272164 |
166.818 |
66.749 |
-74.468 |
-5.246 |
-0.159 |
-0.51 |
-1.167 |
-45.287 |
7.733725 |
|
122.mol2 |
8.397940009 |
234.34 |
36.574 |
-43.334 |
-4.734 |
-0.132 |
-0.434 |
-1.033 |
-32.994 |
8.494239 |
|
153.mol2 |
8.823908741 |
11.492 |
77.109 |
-59.095 |
-4.879 |
-0.136 |
-0.447 |
-1.064 |
-45.03 |
8.869509 |
Table 6: This represents training set analysis for 2D QSAR with docking approach
|
Source File |
Experimental Pic50 |
Potential Energy-Opls-2005 |
Bend Energy-Opls-2005 |
Solvation Energy-Opls-2005 |
Docking Score |
Glide Ligand Efficiency |
Glide Ligand Efficiency Sa |
Glide Ligand Efficiency Ln |
Glide Evdw |
Pic50 Predicted |
|
6.mol2 |
6.028260409 |
-45.829 |
7.913 |
-73.095 |
-4.37 |
-0.19 |
-0.54 |
-1.057 |
-28.481 |
6.714623 |
|
10.mol2 |
6.806875402 |
-207.516 |
105.777 |
-70.324 |
-5.438 |
-0.175 |
-0.551 |
-1.227 |
-33.508 |
7.515839 |
|
11.mol2 |
7.301029996 |
104.69 |
20.663 |
-48.302 |
-6.088 |
-0.21 |
-0.645 |
-1.394 |
-32.374 |
7.166273 |
|
15.mol2 |
6.482804102 |
-461.713 |
50.557 |
-108.291 |
-6.357 |
-0.227 |
-0.689 |
-1.467 |
-30.2 |
6.605745 |
|
16.mol2 |
6.721246399 |
62.519 |
58.121 |
-80.765 |
-5.481 |
-0.189 |
-0.581 |
-1.255 |
-36.042 |
7.549445 |
|
17.mol2 |
8.070581074 |
102.324 |
66.779 |
-60.297 |
-5.071 |
-0.181 |
-0.55 |
-1.171 |
-32.347 |
7.258029 |
|
18.mol2 |
7.744727495 |
105.909 |
25.4 |
-80.73 |
-5.51 |
-0.197 |
-0.598 |
-1.272 |
-25.703 |
7.312631 |
|
19.mol2 |
8 |
170.587 |
46.787 |
-42.01 |
-5.235 |
-0.209 |
-0.612 |
-1.241 |
-27.999 |
7.861036 |
|
27.mol2 |
7.552841969 |
235.677 |
38.133 |
-67.92 |
-4.449 |
-0.139 |
-0.441 |
-0.996 |
-25.33 |
7.686517 |
|
28.mol2 |
8.522878745 |
-176.249 |
68.958 |
-51.88 |
-5.638 |
-0.171 |
-0.548 |
-1.254 |
-33.581 |
7.961375 |
|
30.mol2 |
8.886056648 |
-160.73 |
54.193 |
-129.824 |
-5.519 |
-0.162 |
-0.526 |
-1.219 |
-35.785 |
7.899307 |
|
31.mol2 |
8.769551079 |
-170.578 |
110.554 |
-79.606 |
-5.44 |
-0.17 |
-0.54 |
-1.218 |
-36.102 |
8.714996 |
|
32.mol2 |
8.22184875 |
121.467 |
64.803 |
-101.989 |
-6.372 |
-0.22 |
-0.675 |
-1.459 |
-34.229 |
7.887197 |
|
33.mol2 |
7.585026652 |
3.315 |
63.369 |
-89.694 |
-4.912 |
-0.196 |
-0.574 |
-1.164 |
-28.32 |
7.742349 |
|
34.mol2 |
7.677780705 |
295.438 |
54.042 |
-48.409 |
-5.405 |
-0.186 |
-0.573 |
-1.238 |
-30.901 |
7.86128 |
|
36.mol2 |
8.795880017 |
119.458 |
120.885 |
-81.891 |
-4.78 |
-0.177 |
-0.531 |
-1.113 |
-33.775 |
8.298972 |
|
37.mol2 |
8.207608311 |
-243.117 |
39.403 |
-125.774 |
-4.875 |
-0.212 |
-0.603 |
-1.179 |
-26.913 |
7.571183 |
|
39.mol2 |
7.657577319 |
105.246 |
38.681 |
-70.501 |
-3.862 |
-0.143 |
-0.429 |
-0.899 |
-28.118 |
6.765394 |
|
41.mol2 |
8.167491087 |
222.721 |
75.119 |
-77.165 |
-4.159 |
-0.154 |
-0.462 |
-0.968 |
-27.426 |
7.998941 |
|
42.mol2 |
7.823908741 |
129.887 |
96.584 |
-76.902 |
-4.583 |
-0.176 |
-0.522 |
-1.076 |
-33.275 |
8.413825 |
|
44.mol2 |
8.15490196 |
40.866 |
35.747 |
-53.202 |
-4.933 |
-0.197 |
-0.577 |
-1.169 |
-30.945 |
7.6774 |
|
47.mol2 |
6.562249437 |
195.947 |
20.948 |
-45.87 |
-4.287 |
-0.148 |
-0.454 |
-0.982 |
-28.201 |
6.402943 |
|
48.mol2 |
7.657577319 |
-177.949 |
37.283 |
-96.12 |
-3.093 |
-0.141 |
-0.394 |
-0.756 |
-29.442 |
7.144525 |
|
49.mol2 |
8.793174124 |
38.219 |
61.579 |
-82.72 |
-5.693 |
-0.248 |
-0.704 |
-1.377 |
-35.479 |
8.784609 |
|
53.mol2 |
8.107905397 |
-154.517 |
34.293 |
-78.718 |
-6.297 |
-0.191 |
-0.612 |
-1.4 |
-33.131 |
7.978545 |
|
54.mol2 |
7.050609993 |
-502.929 |
114.181 |
-60.711 |
-5 |
-0.179 |
-0.542 |
-1.154 |
-36.139 |
7.329617 |
|
55.mol2 |
7.602059991 |
206.313 |
28.037 |
-48.478 |
-4.977 |
-0.172 |
-0.527 |
-1.14 |
-29.031 |
6.729904 |
|
63.mol2 |
5.826813732 |
-818.795 |
49.613 |
-115.121 |
-6.123 |
-0.219 |
-0.664 |
-1.413 |
-38.047 |
5.730089 |
|
66.mol2 |
6.924453039 |
77.327 |
21.107 |
-38.915 |
-4.47 |
-0.179 |
-0.523 |
-1.06 |
-27.939 |
6.872375 |
|
67.mol2 |
7.075720714 |
-80.769 |
21.968 |
-58.715 |
-5.017 |
-0.201 |
-0.587 |
-1.189 |
-24.148 |
7.523072 |
|
69.mol2 |
6.465973894 |
180.764 |
24.4 |
-35.033 |
-5.602 |
-0.207 |
-0.622 |
-1.304 |
-30.919 |
7.104212 |
|
70.mol2 |
6.353596274 |
48.567 |
20.055 |
-42.259 |
-5.881 |
-0.218 |
-0.653 |
-1.369 |
-30.864 |
6.85275 |
|
71.mol2 |
6.040958608 |
103.539 |
22.038 |
-31.925 |
-3.577 |
-0.128 |
-0.388 |
-0.826 |
-28.954 |
6.254138 |
|
72.mol2 |
7.102372909 |
190.373 |
29.694 |
-62.651 |
-4.358 |
-0.145 |
-0.451 |
-0.99 |
-26.698 |
6.993748 |
|
73.mol2 |
7.721246399 |
114.119 |
66.778 |
-57.594 |
-5.456 |
-0.188 |
-0.578 |
-1.249 |
-28.472 |
8.248523 |
|
74.mol2 |
6.872895202 |
193.187 |
30.469 |
-77.072 |
-4.26 |
-0.142 |
-0.441 |
-0.968 |
-34.885 |
6.472619 |
|
90.mol2 |
4.620150821 |
40.215 |
27.695 |
-375.123 |
-6.008 |
-0.215 |
-0.652 |
-1.387 |
-29.198 |
5.779906 |
|
91.mol2 |
5.496209317 |
52.448 |
40.907 |
-381.371 |
-5.439 |
-0.201 |
-0.604 |
-1.266 |
-32.284 |
5.479672 |
|
99.mol2 |
7.974694135 |
-158.819 |
110.561 |
-80.836 |
-5.597 |
-0.181 |
-0.567 |
-1.262 |
-35.628 |
8.501749 |
|
100.mol2 |
7.869666232 |
-132.876 |
111.266 |
-80.334 |
-5.018 |
-0.152 |
-0.488 |
-1.116 |
-36.301 |
8.64286 |
|
104.mol2 |
6.924453039 |
46.027 |
56.393 |
-77.703 |
-3.349 |
-0.134 |
-0.392 |
-0.794 |
-29.159 |
7.125431 |
|
105.mol2 |
6.363512104 |
-225.56 |
40.995 |
-118.021 |
-4.284 |
-0.171 |
-0.501 |
-1.015 |
-31.904 |
6.69265 |
|
108.mol2 |
6.841637508 |
49.81 |
55.946 |
-71.556 |
-6.144 |
-0.236 |
-0.7 |
-1.443 |
-33.221 |
7.757227 |
|
110.mol2 |
6.742321425 |
42.183 |
44.993 |
-81.032 |
-4.243 |
-0.152 |
-0.46 |
-0.98 |
-30.76 |
6.163714 |
|
115.mol2 |
8.795880017 |
38.332 |
61.513 |
-82.659 |
-5.693 |
-0.248 |
-0.704 |
-1.377 |
-35.479 |
8.783754 |
|
118.mol2 |
9 |
-127.831 |
36.877 |
-104.876 |
-4.643 |
-0.122 |
-0.411 |
-1.001 |
-41.512 |
8.299109 |
|
121.mol2 |
7.229147988 |
164.876 |
21.165 |
-56.395 |
-5.166 |
-0.184 |
-0.56 |
-1.192 |
-27.35 |
7.308348 |
|
123.mol2 |
8.15490196 |
283.582 |
38.794 |
-44.869 |
-3.827 |
-0.12 |
-0.38 |
-0.857 |
-30.1 |
7.701209 |
|
124.mol2 |
6.306273051 |
84.785 |
35.075 |
-87.765 |
-5.297 |
-0.183 |
-0.561 |
-1.213 |
-38.28 |
6.518691 |
|
125.mol2 |
6.739928612 |
37.021 |
36.339 |
-74.576 |
-5.255 |
-0.181 |
-0.557 |
-1.203 |
-36.584 |
7.147122 |
|
126.mol2 |
6.573488739 |
64.481 |
35.078 |
-78.557 |
-5.074 |
-0.181 |
-0.55 |
-1.171 |
-36.437 |
6.707977 |
|
127.mol2 |
6.876148359 |
38.002 |
42.078 |
-95.733 |
-5.783 |
-0.193 |
-0.599 |
-1.314 |
-37.118 |
7.028593 |
|
128.mol2 |
6.806875402 |
17.673 |
41.791 |
-86.744 |
-5.184 |
-0.179 |
-0.549 |
-1.187 |
-32.888 |
6.783377 |
|
129.mol2 |
7.036212173 |
3.441 |
33.476 |
-91.381 |
-5.332 |
-0.178 |
-0.552 |
-1.211 |
-34.325 |
7.06126 |
|
130.mol2 |
7.107905397 |
35.358 |
41.869 |
-85.485 |
-4.975 |
-0.172 |
-0.527 |
-1.139 |
-37.222 |
6.84209 |
|
152.mol2 |
9 |
28.731 |
67.594 |
-65.337 |
-4.866 |
-0.139 |
-0.455 |
-1.068 |
-42.048 |
8.591106 |
|
156.mol2 |
7.698970004 |
-535.627 |
75.267 |
-76.175 |
-5.427 |
-0.147 |
-0.489 |
-1.177 |
-42.362 |
8.526031 |
|
158.mol2 |
8 |
-17.474 |
105.914 |
-65.788 |
-4.676 |
-0.142 |
-0.454 |
-1.04 |
-33.64 |
8.274704 |
|
161.mol2 |
7.318758763 |
120.932 |
62.889 |
-85.212 |
-5.978 |
-0.221 |
-0.664 |
-1.392 |
-31.652 |
7.354926 |
|
162.mol2 |
8.22184875 |
183.408 |
46.684 |
-52.57 |
-5.76 |
-0.199 |
-0.61 |
-1.319 |
-27.937 |
7.680396 |
|
164.mol2 |
8 |
-321.034 |
13.919 |
-58.837 |
-5.28 |
-0.23 |
-0.653 |
-1.277 |
-27.351 |
7.393335 |
|
166.mol2 |
7.193820026 |
133.048 |
33.53 |
-43.478 |
-6.053 |
-0.242 |
-0.708 |
-1.435 |
-29.962 |
7.940206 |
|
167.mol2 |
8.055517328 |
153.943 |
58.48 |
-122.856 |
-5.339 |
-0.167 |
-0.53 |
-1.195 |
-34.934 |
8.452689 |
|
170.mol2 |
6.301029996 |
6.384 |
33.708 |
-64.147 |
-5.513 |
-0.184 |
-0.571 |
-1.253 |
-36.787 |
6.507021 |
|
173.mol2 |
6.856360765 |
-89.683 |
43.502 |
-67.308 |
-4.834 |
-0.146 |
-0.47 |
-1.075 |
-44.489 |
6.918569 |
Molecular Dynamics Simulations Study
The molecule with the best binding affinity was further subjected to a molecular dynamics simulation study. Molecular Dynamics Simulation is a computer-based simulation approach used to analyze the physical motions of atoms or molecules. MD simulations can identify a few critical hydrogen bond interactions. MD simulations assist in protein docking and virtual screening advances. The iMODS server was utilized in this work to simulate molecular dynamics. The iMODS service aids in the exploration of normal mode analysis and generates accessible information about routes that may involve macromolecules or homologous structures (14–16).
For the hit chemical receptor complex, molecular dynamics simulations were also run using the Desmond program (17). Individually, the complex was solvated in an explicit water box of size 10 with a single-point charge (SPC) water model TIP3P with periodic boundary condition (PBC). The protein and ligand were modeled using the OPLS3e force field, and Na and Cl- ions were added to make the total charge of the system neutral. Following that, the system was energy reduced for 2000 steps before a 50 ns production run. Following minimization, the complex was subjected to manufacturing run at the NPT ensemble. Using the Nose-Hoover thermostatic algorithm and the Martina-Tobias-Klein approach, the system was gently heated to maintain a temperature of 300 K and pressure. To simulate long-range electrostatic interactions, the Particle- Mesh Ewald (PME) approach was used with a grid spacing of 0.8. The Desmond package’s Simulation Interaction Diagram tool was used to investigate the precise interactions between the ligand and protein. The data was examined in terms of protein and ligand RMSD and root mean square fluctuation (RMSF).
Results
2D QSAR Result analysis (Without docking approach)
The PIC50 value of the test set molecules (total of 7 molecules with mole IDs 60,62,147,152,171,172,179) was predicted using the formula given below and the regression curve was constructed using MICROSOFT EXCEL. The following formula was used to calculate the expected value of PIC50 for both the training and test sets (Total 40 molecules):
PREDICTED PIC50=Constant+ Coefficient of VAR (2) ×Har2 value+ Coefficient of VAR (3) × BELm4 value +Coefficient of VAR (4) ×BEHv3 Value+ Coefficient of VAR (5) ×VEe1 Value.
Or PREDICTED PIC50=35.225+ 0.395×Har2 value+ (-5.682) × BELm4 value +15.811×BEHv3 Value + (-22.893) ×VEe1 Value.
Here we performed 2d QSAR because it is more robust than 3d QSAR. And we got R2 =0.7644 which is a decent value for 2d QSAR [Figure 1]. For 2D QSAR modeling, the value of the regression coefficient, R2 should be greater than 0.7 to build a decent model and also predict the activity of all molecules with reasonable precision. (27-29).
 |
Figure 1: Correlation curve of training and test set for 2D QSAR (without docking approach) |
2D QSAR Result Analysis (With Docking Approach)
A total of 74 molecules have been docked to the active site. Potential Energy-OPLS-2005(VAR2), Bend Energy-OPLS-2005 (VAR3), Solvation Energy-OPLS-2005(VAR4), Docking Score(VAR5), Glide Ligand Efficiency (VAR6), Glide Ligand Efficiency Sa (VAR7), Glide Ligand Efficiency Ln (VAR8), and Glide Evdw are docking descriptors that are highly correlated with Experimental PIC50 (VAR9). With the help of SYSTAT software taking those descriptors as independent variables and the Experimental PIC50 value as the dependent variable for the TEST set, we obtained the following data (Table 4).
We used the following formula to predict the PIC50 value of any molecule.
PREDICTED PIC50=Constant+ Coefficient of VAR (2) × Potential Energy + Coefficient of VAR (3) × Bend Energy +Coefficient of VAR (4) ×Solvation Energy + Coefficient of VAR (5) ×docking score + Coefficient of VAR (6) × glide ligand efficiency +Coefficient of VAR (7) × glide ligand efficiency sa + Coefficient of VAR (8) × glide ligand efficiency ln +Coefficient of VAR (9) × glide evdw
Or, PREDICTED PIC50 =5.796 + 0.002× Potential Energy +0.021× Bend Energy +0.005×Solvation Energy + (-146.025) ×docking score + (-128.175) × glide ligand efficiency +(-640.812) × glide ligand efficiency sa +951.967× glide ligand efficiency ln + 0.038× glide evdw
With the help of the above-mentioned formula, we have predicted the PIC50 value of Both test (9 molecules) and training set (65 molecules).
We classified our 74 molecules into three groups: (i) those with a PIC50 value less than 5.5 are inactive, those with a PIC50 value greater than 5.5 are active, and those with a PIC50 value less than 5.5 are inactive; (ii) those with a PIC50 score between 5.5 and 7.5 are moderately active; (iii) while those with a PIC50 value greater than 7.5 are active.
However, we discovered that a few compounds produce erroneous active results, which are referred to as outliers, in which the projected PIC50 value differs from the experimental PIC50 value. However, because the R2 value is 0.7098, or greater than 70%, the activity of the majority of the molecules may be predicted with reasonable precision [Figure 2].
 |
Figure 2: Correlation curve of training and test set for 2D QSAR (using dock score as descriptors) |
Molecular Docking Result analysis
The 40 compounds used for 2D QSAR modeling using the docking approach were analyzed. The best docking score was demonstrated by compound 131.mol2. The compound 131.mol2 demonstrated a docking score of -6.637. The structural analysis of this compound was done on Biovia Discovery Studio Visualizer (18). Compound 131.mol2 showed two hydrogen bond interactions at SER209, VAL207. It also 2 pi-alkyl interactions at ARG356 and one pi-alkyl interaction at PHE357. Furthermore, the native co-crystallized ligand, vildagliptin was also separately docked with the DPP IV receptor. To validate the docking procedure, the docked pose of the hit compound 131 was superimposed with the docked pose of the co-crystallized ligand, vildagliptin [Figure 3]. It was observed that both the docked poses of the two compounds superimposed with each other thus validating the docking protocol [Figure 4].
 |
Figure 3: Biovia Discovery Studio structural analysis of our hit compound 131 (red color) with the receptor dipeptidyl peptidase IV (light violet color) |
 |
Figure 4: The left-sided figure represents docked pose of native ligand, vildagliptin (blue color) with the hit compound 131 (blue color). The right-sided figure represents the superimposed structural analysis of native ligand, vildagliptin (blue color) with the hit compound 131 (blue color) at the active site of the receptor dipeptidyl peptidase IV. |
Molecular Dynamics Simulation Results
Compound 131 was identified as the best hit and was subjected to molecular dynamics simulation analysis. Here the docked complex of the compound 131 with receptor dipeptidyl peptidase IV was considered for MD simulation. Normal mode analysis mobility allows us to analyze the large-scale B-factor and mobility as well as the stability of the molecules [Figure 5]. The IMOD server exposed the internal coordinates analysis depending on the protein-ligand structural interactions.
 |
Figure 5: Normal Mode Analysis of hit compound 131 with target receptor dipeptidyl peptidase IV using iMODS software |
IMODs also measure the B-factor and structural deformity and calculate the eigenvalue. Image 1 represents the docked complex of our protein and ligand. Image 2 of the Figure represents the deformability graph. The deformity graph illustrated peaks in the graph which represent regions in the protein with deformability. Image 3 represents the B-Factor graph. The main-chain deformability, also known as the B-Factor, is a measure of a molecule’s ability to deform at each of its residues. Image 4 represents the eigenvalue of the complex. The motion stiffness is represented by the eigenvalue associated with each normal mode. Its value is proportional to the amount of energy required to distort the structure. The simpler the deformation, the lower the eigenvalue. Our docked complex demonstrated an eigenvalue of 1.145917e-04 which eventually suggested that our protein-ligand complex can be deformed easily. Image 5 represents the variance plot. The variance plot demonstrates individual variances in red color whereas cumulative variance in green color. Image 6 represents the covariance map. This map demonstrates the correlation motion between a pair of residues in red color, uncorrelated motion in white color, and anti-correlated motion in blue color. Image 7 represents the elastic map of our docked complex. Each dot in the graph represents one spring inside the atoms’ pair. The dots are colored dependent on stiffness, with darker grey dots indicating stiffer springs and lighter grey dots indicating softer springs. From the molecular dynamics study, it was evident that our complex showed a good amount of deformability. Furthermore, it also showed a moderately low eigenvalue, suggesting that it could be deformed easily. The variance map exhibited a higher degree of cumulative variances than an individual variance. The elastic network map also produced satisfactory results.
For MD Simulation using the Desmond program for our hit compound-receptor complex, the protein RMSD exhibited a stable trajectory throughout the entire 50 ns simulation process. The ligand RMSD exhibited fluctuations until 34 ns but then showed a stable trajectory throughout the rest of the simulation process [Figure 6]. Regarding the Protein RMSF analysis, the highest fluctuations were observed at 4.8 Å and 4.2 Å. Overall, the Protein and Ligand RMSF trajectories were found to be stable [Figure 7, Figure 8]. Other than these, the amino acid interactions of our protein-ligand complex were also analyzed. The notable hydrogen interactions were observed at PHE208, GLU361, ASP302, ILE405, CYS551, TYR585. The notable hydrophobic interactions were observed at ARG429, TYR585, CYS551, MET591. Water bridges were observed in VAL207, CYS301, ASP302, GLY355, ARG356, PRO359, GLU361, ILE405, CYS551, TYR585. Ionic interactions were found in ASP302 and GLU361. Among these residues, only GLU361 and TYR585 exhibited strong interactions for more than 30% of the entire simulation process [Figure 9, Figure 10, Figure 11]. Other than this, other ligand properties of the hit compound such as radius of gyration, molecular surface area, intramolecular hydrogen bonds, solvent accessible surface area, and polar surface area were monitored throughout the 50 ns simulation process [Figure 12]. The radius of gyration, molecular surface area, and polar surface area plots of the hit compound demonstrated stable trajectories throughout the entire 50 ns simulation study. The solvent-accessible surface area plot showed slight fluctuations between 16-28 ns but still showed a stable trajectory throughout the rest of the simulation process. Furthermore, the intramolecular hydrogen bond plot of the hit compounds demonstrated zero hydrogen bonds. The 50ns simulation process gave a detailed analysis of the structural stability of our protein-ligand complex.
 |
Figure 6: Protein-Ligand RMSD plot. |
 |
Figure 7: Protein RMSF plot |
 |
Figure 8: Ligand RMSF plot Click here to View figure |
 |
Figure 9: Protein-Ligand contacts plot detailing amino acid interactions concerning interaction fraction |
 |
Figure 10: Protein-Ligand Contacts plot detailing amino acid interactions with respect to time |
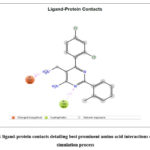 |
Figure 11: ligand-protein contacts detailing best prominent amino acid interactions during the |
 |
Figure 12: Root Mean Square Deviation, Radius of Gyration, Intramolecular Hydrogen Bonds, Molecular Surface Area, Solvent Accessible Surface Area, Polar Surface Area plots of the hit compound. |
Discussion
Designing a drug that targets DPP4 is not a new area of research. In previous studies, for designing a potent DPP4 inhibitor most of the researchers have chosen 3 to 4 well-known marketed DPP4 inhibitors and then tried to build a scaffold virtually by pharmacophore modeling i.e combining the important pharmacophore. Then they have synthesized several derivatives and measured their IC50 Value(19,20) or performed virtual screening from a large database (20–23). In most of the cases they have used a structurally similar scaffold for QSAR modeling and that’s too in less number (24–26). But in this cumulative study, we have collected 180 highly diversified molecules with their experimental PIC50 value. All of them are either marketed drugs or passing through the clinical trial phase. Still, we are getting a good correlation curve, so this model is quite reliable. Contributing a good model along with a reliable activity predicting formula to the current research community was our motto, which we have achieved successfully. The practical application of this work is that we can predict the PIC50 value of any molecule by using the above-mentioned formula, just we need to dock this molecule with the DPP4 receptor and have to collect the descriptors obtained after docking. If the predicted PIC50 value comes out to be less than 5 then the molecule would be non-potent as a DPP4 inhibitor. So we can skip the synthesis process of that molecule. That will save our time as well as expenditure.
With the help of this study, we were able to generate two different 2D QSAR models with the help of two different approaches. The first approach was to generate 2D descriptors for a given set of molecules using the DRAGON software and then eventually generating regression curves with the aid of SYSTAT software. The first approach generated a QSAR model with regression coefficient, R2=0.7644 (training set) and R2=0.9857 (test set). The second approach was to perform docking for another set of molecules and eventually use docking results as an additional set of descriptors. Finally, the descriptors data were used to generate regression curves using SYSTAT software. The second approach also gave a satisfactory regression coefficient value, R2=0.7098 (training set) and R2=0.9987 (test set). The proposed modeling process and computer-aided drug creation were founded on computational trials using statistically stable descriptor values. This method can be used to find new potential DPP-4 inhibitors.
Acknowledgement
The products used in this study are products that are commonly and primarily used in our field of study and country.There is no conflict of interest between the authors and producers of the products because we do not intend to use these products as a means of litigation but rather to advance knowledge. Furthermore, the research was not funded by the production company, but rather by the authors’ own personal efforts.
Conflict of Interest
There is no conflict of interest
Funding Source
No funding source
References
- Olokoba AB, Obateru OA, Olokoba LB. Type 2 diabetes mellitus: A review of current trends. Oman Medical Journal. 2012;27(4):269–73.
CrossRef - Green BD, Flatt PR, Bailey CJ. Dipeptidyl peptidase IV (DPP IV) inhibitors: A newly emerging drug class for the treatment of type 2 diabetes. Diabetes and Vascular Disease Research. 2006;3(3):159–65.
CrossRef - Wu WL, Hao J, Domalski M, Burnett DA, Pissarnitski D, Zhao Z, et al. Discovery of Novel Tricyclic Heterocycles as Potent and Selective DPP-4 Inhibitors for the Treatment of Type 2 Diabetes. ACS Medicinal Chemistry Letters. 2016 May 12;7(5):498–501.
CrossRef - Ji X, Su M, Wang J, Deng G, Deng S, Li Z, et al. Design, synthesis and biological evaluation of hetero-aromatic moieties substituted pyrrole-2-carbonitrile derivatives as dipeptidyl peptidase IV inhibitors. European Journal of Medicinal Chemistry. 2014 Mar 21;75:111–22.
CrossRef - Zhu Y, Xia S, Zhu M, Yi W, Cheng J, Song G, et al. Synthesis, biological assay in vitro and molecular docking studies of new imidazopyrazinone derivatives as potential dipeptidyl peptidase IV inhibitors. European Journal of Medicinal Chemistry. 2010 Nov;45(11):4953–62.
CrossRef - Lambeir AM, Durinx C, Scharpé S, De Meester I. Dipeptidyl-peptidase IV from bench to bedside: An update on structural properties, functions, and clinical aspects of the enzyme DPP IV. Critical Reviews in Clinical Laboratory Sciences. 2003;40(3):209–94.
CrossRef - Berger JP, SinhaRoy R, Pocai A, Kelly TM, Scapin G, Gao Y-D, et al. A comparative study of the binding properties, dipeptidyl peptidase-4 (DPP-4) inhibitory activity and glucose-lowering efficacy of the DPP-4 inhibitors alogliptin, linagliptin, saxagliptin, sitagliptin and vildagliptin in mice. Endocrinology, Diabetes & Metabolism. 2018;1(1):1–8.
CrossRef - Mauri A, Consonni V, Pavan M, Todeschini R. DRAGON software: An easy approach to molecular descriptor calculations. Match. 2006;56(2):237–48.
- Hilbe JM. A review of systat 11. American Statistician. 2005;59(1):104–10.
CrossRef - Saur IML, Panstruga R, Schulze-Lefert P. The Protein Data Bank. Nature Reviews Immunology. 2021;28(1):235–42.
- Schrödinger Release. Maestro, Schrödinger. New York, NY. 2019.
- Schrödinger. LigPrep. Schrödinger Release 2020-3: Schrödinger, LLC, New York, NY, 2020. 2020.
- Schrödinger. Glide | Schrödinger. Schrödinger Release 2018-3. 2018.
- Lopéz-Blanco JR, Garzón JI, Chacón P. iMod: Multipurpose normal mode analysis in internal coordinates. Bioinformatics. 2011;27(20):2843–50.
CrossRef - López-Blanco JR, Aliaga JI, Quintana-Ortí ES, Chacón P. IMODS: Internal coordinates normal mode analysis server. Nucleic Acids Research. 2014;42(W1):271–6.
CrossRef - Kovacs JA, Chacón P, Abagyan R. Predictions of protein flexibility: First-order measures. Proteins: Structure, Function and Genetics. 2004;56(4):661–8.
CrossRef - D. E. Shaw Research. Desmond Molecular Dynamics System. Schrödinger Release,New york. 2019.
- Visualizer DS. v4. 0.100. 13345. In: Accelrys Software Inc. 2005.
- Kaczanowska K, Wiesmüller KH, Schaffner AP. Design, synthesis, and in vitro evaluation of novel aminomethyl-pyridines as DPP-4 inhibitors. ACS Medicinal Chemistry Letters. 2010 Dec 9;1(9):530–5.
CrossRef - Li J, Ji X, Xia C, Wang J, Su M, Zhang L, et al. Design, synthesis and biological evaluation of 4-fluoropyrrolidine-2- carbonitrile and octahydrocyclopenta[b]pyrrole-2-carbonitrile derivatives as dipeptidyl peptidase IV inhibitors. European Journal of Medicinal Chemistry. 2014 Oct 30;86:242–56.
CrossRef - Zeng S, Xie H, Zeng LL, Lu X, Zhao X, Zhang GC, et al. Discovery of potent dipeptidyl peptidase IV inhibitors through pharmacophore hybridization and hit-to-lead optimization. Bioorganic and Medicinal Chemistry. 2013 Apr 1;21(7):1749–55.
CrossRef - Schwehm C, Li J, Song H, Hu X, Kellam B, Stocks MJ. Synthesis of new DPP-4 inhibitors based on a novel tricyclic scaffold. ACS Medicinal Chemistry Letters. 2015 Mar 12;6(3):324–8.
CrossRef - Xing J, Li Q, Zhang S, Liu H, Zhao L, Cheng H, et al. Identification of dipeptidyl peptidase IV inhibitors: Virtual screening, synthesis and biological evaluation. Chemical Biology and Drug Design. 2014;84(3):364–77.
CrossRef - Sokolović D, Ranković J, Stanković V, Stefanović R, Karaleić S, Mekić B, et al. QSAR study of dipeptidyl peptidase-4 inhibitors based on the Monte Carlo method. Medicinal Chemistry Research. 2017 Apr 1;26(4):796–804.
CrossRef - Kang NS, Ahn JH, Kim SS, Chae CH, Yoo SE. Docking-based 3D-QSAR study for selectivity of DPP4, DPP8, and DPP9 inhibitors. Bioorganic and Medicinal Chemistry Letters. 2007 Jul 1;17(13):3716–21.
CrossRef - Jiang C, Han S, Chen T, Chen J. 3D-QSAR and docking studies of arylmethylamine-based DPP IV inhibitors. Acta Pharmaceutica Sinica B. 2012 Aug;2(4):411–20.
CrossRef - Roy K, Kar S, Das RN. Introduction to 3D-QSAR. Underst Basics QSAR Appl Pharm Sci Risk Assess. 2015;291–317.
CrossRef - Dastmalchi S, Hamzeh-Mivehroud M, Asadpour-Zeynali K. Comparison of different 2D and 3D-QSAR methods on activity prediction of histamine H3 receptor antagonists. Iran J Pharm Res. 2012;11(1):97–108.
- Jagiello K, Grzonkowska M, Swirog M, Ahmed L, Rasulev B, Avramopoulos A, et al. Advantages and limitations of classic and 3D QSAR approaches in nano-QSAR studies based on biological activity of fullerene derivatives. J Nanoparticle Res. 2016;18(9):1–16.
CrossRef

This work is licensed under a Creative Commons Attribution 4.0 International License.
About The Author
![]()
A New Edition of Web of Science
Journal Impact Factor
2022: 0.5
Five Year: 0.8
Journal is Indexed in

Cabells Whitelist
![]()


