Indicator Made from Countryside Flower Petals
Ashoke Hazra
Department of Chemistry, A.K.P.C. Mahavidyalaya, Bengai, Hooghly. West Bangal, India
Corresponding Author E-mail: hazra.ashoke@gmail.com
DOI : http://dx.doi.org/10.13005/ojc/370534
Article Received on : 10-Sep-2021
Article Accepted on :
Article Published : 26 Oct 2021
Reviewed by: Dr. Femina Felix
Second Review by: Dr. Haresh Thakellapalli
Final Approval by: Dr. Ioana stanciu
Present research introduces on the natural indicator (Acid-Base). For this samples were collected from countryside flower petals. These are pink Madhabilata flower, violet Dahlia flower, yellowish red Miralibis Jalapa, light pink Nerium Oleander. With the help of pH meter colour changes were observed using Soxhlet extractor. Cold extract of the flower petals are prepared. For this study we use UV/Visible Spectrophotometer to determine the maximum wave length. The decreasing order of intercept from the above spectroscopic plots that pink Madhabilata> violet Dahlia>redish yellow Miralibis Jalapa> light pink Nerium Oleander. Natural indicators show prominent colour changes in acidic and basic solutions. So, it is easily replaceable to the synthetic indicator which is toxic in nature. These natural indicators are easily available, cheap, environment friendly and also nature friendly.
KEYWORDS:Absorption; Acid-Base, Dahlia; Madhabilata, Miralibis; Nerium Oleander; Natural Indicator; pH Wavelength
Download this article as:| Copy the following to cite this article: Hazra A. Indicator Made from Countryside Flower Petals. Orient J Chem 2021;37(5). |
| Copy the following to cite this URL: Hazra A. Indicator Made from Countryside Flower Petals. Orient J Chem 2021;37(5). Available from: https://bit.ly/3CmMw8I |
Introduction
In connection of our previous Experiment 1, here we observed that some common flower petals acts as natural indicators in acidic and basic conditions. Negative logarithm of concentration of hydrogen ion acts as pH of a solution. Value of pH 0 to 14 shows acidic and basic nature in a solution. pH value is more important for the analysis of a indicator. Here we discuss how solution acts as acidic or basic with the help of titrimetric method for the colour change in a particular pH range. We produce natural indicators and also to determine the colour scale. Most of the cases we use household materials as well as natural things.
Indicators are the pigments which are coming from different plants, fungus, algae 2-5. Red, blue or violet colour from flower petals are the one kind of anthocyanin which change colour using pH 6. Some naturally colourful thing changes the colour from when they are changes acidity and alkalinity e.g., grapes solution, brown tea, some pigments of flowers etc. These are known as acid-base indicator 7 .
In a particular chemical reaction, these change their colour in a certain stages 8-9. Some indicators used in laboratory which are Methyl yellow, Methyl orange, Phenolphthalein, Methyl red, Penta methoxy red, Alizarin S etc. These indicators are mainly used in the different titrimetric analysis. For acid-base titration, organic pigments which are weak acid acts as indicators 10, 11. Attempts have been made for the eco friendly natural indicators due to the negative impact of synthetic indicators. These natural indicators are easily available, non toxic, environment friendly 12-19. For a good indicator such properties are essential as they show sharp colour change in acid and basic solutions and change in colour in equivalence point. Indicators are colour or pigments that are found in leaf, flower petals, fruits, vegetable etc. Red, blue, pink, yellow, violet etc. colour flowers contain a pigment of anthocyanin which changes colour pH. Acid-base natural indicator first introduced in the Experimental History of colours of Robert Boylein 20 in 1964.
Methodology
Materials
Pink Madhabilata flower, Dahlia(Violet), Miralibis Jalapa and Nerium Oleander flowers, sodium hydroxide(NaOH) and H2SO4, CH3COOH, KOH, distilled water.
Apparatus
Mortar and pestle, digital weighing balance, burette, pipette, spatula, stirrer, glass rod, stand, clamp, soxhlet extractor and filter paper (Whatmann 40) were use for this experiment.
Sample Preparation
Different flower petals were collected from country side places. At ordinary room temperature these are dried. For confirming the drying of the samples, constant weighing continues. For grinding the samples, mortar and pestle were used. Then filtering the processes (about 25 gms of each sample) used whatmann 40 filter paper. After filtering, samples were ready to use for experiment.
Sample Extraction
The sample of flower petals was extracted by cold method of extraction 21.
Cold Extraction
At first four (Madhabilata flower, Dahlia(Violet), Miralibis Jalapa and Nerium Oleander flower) samples were weighed near about 25 gms. Then added 200 ml distilled water in each sample and settled these on overnight. Next day these decant solutions were taken in a clean beakers. Then these are concentrated in a water bath 22.
Characterization of Extract
For characterization of these flower petal extracts we use UV/Visible Spectrophotometer (Elico, 171, Mini spectro) for the determination of the maximum absorption wave length and with the use of pH meter (Elico L1 614 pH analyser) to determine the pH of the cold extracts.
Reaction of extracts with acids and bases
Samples were added to the different strengths of Acid and bases to observe the colour changes. For this purposes, different strengths of strong and weak acid & bases are used.
UV/Visible Spectroscopy
In UV/Visible spectrophotometer, the sample cell was washed with distilled water. At 400nm wave length, the machine was calibrated by distilled water. So, 0.001 ml of each extract was diluted with 10 ml of distilled water and 5 ml of the extract was used for experiment and placed in the cell. The absorbance of the extract was observed within the visible region (i.e., 400-750nm) and from the extrapolation of the graph we can easily determine the maximum wave length of absorption.
pH Study
Elico L1 614 pH analyser was use to determine the pH of the four samples in different strengths.
Results & Discussions
The results were tabulated in the Tables 1, 2, 3, 4. Table.1 to Table.4 shows the primary colour and colour change with acid and base of the four experimental naturally occurring colour pigments. Absorbance vs. Wavelength of these colour pigments shows in Fig.1 to Fig.4. From the graph it was noticed that pink Madhabilata shows better colour absorption peak than the other three. The colour changes of some standard indicators in acidic and basic solutions show in Table 5.
Table 1: Madhabilata Flower(Pink) (Cold extract) (primary colour of extract, Light pink)
|
Solvent |
+ |
Cold Extract |
= |
Colour change |
|
Acidic |
|
|
|
|
|
H2SO4 |
+ |
Cold Extract |
= |
Pink |
|
CH3COOH |
+ |
Cold Extract |
= |
Light Pink |
|
Basic |
|
|
|
|
|
NaOH |
+ |
Cold Extract |
= |
Sap Green |
|
KOH |
+ |
Cold Extract |
= |
Sap Green |
pH=8.4
Table 2: Dahlia Flower (violet) (Cold extract) (primary colour of extract, violet)
|
Solvent |
+ |
Cold Extract |
= |
Colour change |
|
Acidic |
|
|
|
|
|
H2SO4 |
+ |
Cold Extract |
= |
Light orange |
|
CH3COOH |
+ |
Cold Extract |
= |
Light orange |
|
Basic |
|
|
|
|
|
NaOH |
+ |
Cold Extract |
= |
Mustard oil colour |
|
KOH |
+ |
Cold Extract |
= |
Mustard oil colour |
pH=8.4
Table 3: Miralibis Jalapa (Yellowlish red) (Cold extract) (primary colour of extract, Yellowish red)
|
Solvent |
+ |
Cold Extract |
= |
Colour change |
|
Acidic |
|
|
|
|
|
H2SO4 |
+ |
Cold Extract |
= |
Redish brown |
|
CH3COOH |
+ |
Cold Extract |
= |
Redish brown |
|
Basic |
|
|
|
|
|
NaOH |
+ |
Cold Extract |
= |
Sap Green |
|
KOH |
+ |
Cold Extract |
= |
Sap Green |
pH=8.4
Table 4: Nerium Oleander (Redish pink) (Cold extract) (primary colour of extract, light pink)
|
Solvent |
+ |
Cold Extract |
= |
Colour change |
|
Acidic |
|
|
|
|
|
H2SO4 |
+ |
Cold Extract |
= |
Straw colour |
|
CH3COOH |
+ |
Cold Extract |
= |
Straw colour |
|
Basic |
|
|
|
|
|
NaOH |
+ |
Cold Extract |
= |
Greenish Yellow |
|
KOH |
+ |
Cold Extract |
= |
Greenish yellow |
pH=8.4
Table 5: Some common synthetic Acid-Base Indicators
|
Indicator Name |
Colour change interval(pH) |
Acidic colour |
Basic colour |
|
Thymol blue |
1.2-2.8 |
Red |
Yellow |
|
Methyl orange |
3.1-4.4 |
Red |
Yellow |
|
Methyl red |
4.4-6.2 |
Red |
Yellow |
|
Chlorophenol red |
5.4-6.8 |
Yellow |
Red |
|
Bromothymol blue |
6.2-7.6 |
Yellow |
Blue |
|
Phenol red |
6.4-8.0 |
Yellow |
Red |
|
Thymol blue |
8.0-9.6 |
Yellow |
Blue |
|
Phenolpthalein |
8.0-10.0 |
Colourless |
Red |
|
Alizarin yellow |
10.0-12.0 |
yellow |
Green |
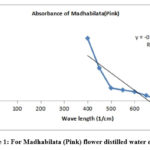 |
Figure 1: For Madhabilata (Pink) flower distilled water extract. |
 |
Figure 2: For Dahlia (violet) flower distilled water extract. |
 |
Figure 3: For Miralibis Jalapa (Redish yellow) flower distilled water extract |
 |
Figure 4: For Nerium Oleander (light pink) flower distilled water extract |
Fig. 1 shows the variation of absorbance with wave length of pink Madhabilata (cold extract). Here maximum absorbance is near about 2.20. But same plot of different flower petals (Fig.2 to Fig.4) observed. For light violet dahlia flower distilled water extract absorbance peak at 1.4, Fig.3 for redish yellow Miralibis Jalapa flower distilled water extract absorbance peak at 1.3, Fig. 4 for light pink Nerium Olender flower distilled water extract absorbance peak at 1. So, from the figures maximum absorbance of pink Madhabilata is high than the other three flowers extract.
From the UV visible spectrophotometric data it has been found that Absorption Vs. wavelength plot, the intercept value of pink Madhabilata is high than the other three. Here absorption is high. So, colour density is high than the other three. We search that naturally occurring colour which is cheap and easily available. So, pink Madhabilata is highly dense colour which is easily available in nature. The decreasing order of intercept from the above spectroscopic plots that pink Madhabilata> violet Dahlia>redish yellow Miralibis Jalapa> light pink Nerium Oleander.
From Table 1, it was observed that pink Madhabilata (cold extract) did not show any significant change in acidic and basic solutions, yet its pH was 8.4 (sap green). Prominent colour change was observed in basic solution. This is a good indication for natural indicator.
From Table 2, it was found that violet Dahlia respond violet to light orange at the acidic region and violet to mustard oil colour at basic region. Its colour change was prominent.
From Table 3, it was observed that yellowish red Miralibis Jalapa respond yellowish red to redish brown and in basic region it turns to sap green.
From Table 4, it was observed that light pink Nerium Oleander respond light pink to straw colour in acidic medium and in basic region it turns greenish colour (which is similar to Alizarin S). Its colour change was prominent. At basic region, its colour was similar with Alizarin S(well-known indicator of us) and at acidic region colour change did not match any standard indicators.
Dyes and pigments which contains in indicator that are interacting in plant tissues in presence of sunlight. The primary dyes of plants are chlorophyll, carotenoids, plastid, anthocyanin, betalanins etc. which are easily dissolved in vascular sap. Different pigments absorbed colour of different wave length of visible light. Flavonoids accompanied with anthocyanin shows a broad spectrum of different flower, fruits, and vegetables along with yellow.
From this study it has been found that naturally occurring flower petals are much more important to determine acid-base colour change. Here we found that colour responses in visible region of two flower petals.
Conclusion
From this experiment, it was observed that the cold extract of different flower petals show distinct colour changes in strong and weak acidic and basic solutions. All the extracts (Experimental) show the maximum absorption spectrum in visible wave length. The values of the extracts of natural indicators are similar to the synthetic indicator.
We search that naturally occurring colour which is cheap and easily available. Therefore, pink Madhabilata is highly dense colour which is easily available in nature. The decreasing order of intercept from the above spectroscropic plots that pink Madhabilata> violet Dahlia>redish yellow Miralibis Jalapa> light pink Nerium Oleander.
From the above findings it may be concluded that countryside natural indicators (different flower petals) may be easily replaced by synthetic indicators (toxic, non eco-friendly). Whereas natural indicators are low cost, non toxic, environment friendly, cheap, easily available and also user friendly.
To determine acidity and alkalinity, natural indicators are uses such as tannery industries, pathological laboratories, different industries, school/ college laboratories etc.
From this experiment finally we expect that countryside natural indicators may be easily replaceable by synthetic indicators for the betterment of our society.
From this study we motivate our society to use this natural indicator instead of synthetic indicator. We campaign the positive effect of natural indicator of different Schools, Colleges, Pathological centres, different industries where testing acid and basic properties identifies using indicators. In this way we can spread the effect of natural indicator.
Acknowledgement
For this work the author is grateful to the Principal of A.K.P.C. Mahavidyalaya as well as Department of Chemistry for all kind of necessary support.
Conflict of Interest
None
Funding Source
None
References
- Hazra, A.; Chem Sci Rev Lett., 2014, Vol 3(12), 876-880.
- Bhise, S.; Pimpodkar, N. V.; Shikalgar, S.; Shinde, N.; Surve, B.; Asian Journal of Pharmaceucital Analysis, 2014, 4(2), 82-84.
- Bhise, S. H.; Pimpodkar, N. V.; Surve, B. S.; Journal of Current Pharmaceutical Research, 2014, 4(4), 1124-1127.
- Bhise, S. H.; Pimpodkar, N. V.; Shinde, N. G.; Surve, B. S.; Shikalgar, S. S.; International Journal of Natural Products Research, 2014, 4(1), 33-35.
- Ahmed, M.; Ikoku, C.; Joju, E.; Laboratory Exercise in Chemistry, Fourth Dimension Publishers, Enugu, Nigeria, 1984.
- Kasture, A. V.; Mahadik, K. R.; More, H.N.; Wadodkar, S. G.; A Textbook of Pharmaceutical Analysis, Vol. 1, Nirali Prakashan, Maharasthra, India, 11th edition, 2005.
- Bamess, J. D.; Denny, R. C.; Mendham, J.; Quantitative Chemical Analysis, W. H. Freeman, New Delhi, India, 6th Edition, 2004.
- Daworiye, L.; Fekarurhobo, G.; Izonfou, W.; Obomanu, F.; Journal of Applied Science and Environ Management, 2006, 10(1), 5-8.
- Gupta, P.; Jain, P.; Jain, P. K.; International Journal of Pharmacy and Technology, 2013, 4(4), 5038-5045.
- Dave, K.; Pradeep, D. J.; Journal of Laboratory Chemical Education,; 2013, 1(2), 34-38.
- Abugri, D. A.; Apea, O. B.; Priechett; Green and Sustainable Chemistry; 2012, 2930, 117-122.
CrossRef - Geeta, D.; S.; Kanika, A.; Perminder, N.; International Journal of Research and Development in Pharmacy & Life SciencesJaspreet, 2011, 2(4), 177-179.
- Patil, F.; Ukpumwan, D. O.; Journal of Chemical Society of Nijeria, 2009, 27(2), 139-142.
CrossRef - Jadav, R. L.; Patil, M. V.; Use of phyllantus Reticulatus Fruit Extract As a natural Indicators in Acid- Base Titration, International Journal of Pharmacy and Pharmaceutical Sciences, 2012, 4(1), 490-491.
CrossRef - Deshpande, A.; Flower Extract of Ixoracocinea As a natural indicator in acid-base titration, Journal of Pharmacy Research, 2010, 3(10), 2512-2513.
- Jain, P.; Flower Sap: A natural Resource as indicator in Acidimetry and Alkalimetry, International Journal of Chem Tech Research, 2012, 4(4), 1619-1622.
- Patel, B. S.; Use of flower extracts as an Indicator in Acid Blue Titrations, Research Journal of Pharma and Tech , 2009, 2(2), 425-1-422.
- Kadam, S.; Raje, V.; Waghmare, K.; Yadav, A.; Comperative Study of natural and Synthetic indicators, Der Pharma Chemica, 2013, 5(1), 296-299.
- Robert, B.; 1966, The Experimental History of colours, www.google.com
- Flinn Scientific –Teaching Chemistry, eLearning Video Series, Publication No. 91564.
- Atkins, P. W.; “Anthocyanin pigments for sour cherries”’ Journal of American Chemical Society, 1987, 78, 979.
- Elumalai, A.; Eswaraiah, M. C.; Kasarla, R.; Ravi, P.; “ An alternative to synthetic acid base indicator Tagetes erecta Linn”’ Asian Journal of Research chemistry, 2012, 5(2), 218-220.
CrossRef

This work is licensed under a Creative Commons Attribution 4.0 International License.
About The Author
![]()
A New Edition of Web of Science
Journal Impact Factor
2022: 0.5
Five Year: 0.8
Journal is Indexed in

Cabells Whitelist
![]()


