Assessment of Water Quality Using Modified Water Quality Index and Geographical Information System in Madathukulam Taluk, Tiruppur District, Tamil Nadu, India
R. Chitradevi1,2 , M. Jeyaraj3*, Vikas D. Ghadamode4, K. Poonkodi5, Rani Venkadasamy6 and P.N. Magudeswaran7
1Research and Development Centre, Bharathiar University, Coimbatore - 641 046, Tamil Nadu, India.
2Department of Chemistry, Sri GVG Visalakshi College for Women, Udumalpet -642128, Tamil Nadu, India.
3Department of Chemistry, Sri Krishna College of Engineering and Technology,Coimbatore-641 008, Tamil Nadu, India.
4National Geophysical Research Institute, Hyderabad -500007, Andhra Pradesh, India.
5Department of Chemistry, Nallamuthu Gounder Mahalingam College, Pollachi-642001,Tamil Nadu, India
6Department of physics P.S.R Engineering College Sivakasi,626140, Tamil Nadu, India.
7Department of Chemistry, Hindusthan College of Engineering and Technology,Coimbatore-641 032,Tamil Nadu, India.
Corresponding Author E-mail: jeyaraja100@gmail.com
DOI : http://dx.doi.org/10.13005/ojc/370528
Article Received on : 04-Sep-2021
Article Accepted on :
Article Published : 08 Oct 2021
Reviewed by: Dr. Jasim Salman
Second Review by: Dr. Mustafa Gurhan
Final Approval by: Dr. Melody anak Kimi
The present investigation is an extensive study of surface and ground water quality of Madathukulam taluk, Tiruppur District, Tamil Nadu, India, to estimate the quality of water using Modified Water Quality Index (MWQI) and Geographic Information System (GIS) technique. In this study 35 water samples from Open well, Bore well, River, Lake and Pond were analysed for the physicochemical parameters like pH, temperature, total phosphate, total nitrate, turbidity, total dissolved solids, dissolved oxygen, biological oxygen demand, faecal coliform, electrical conductivity, total hardness, chloride, fluoride, sodium and potassium. The resulting values were computed to investigate the quality of water using geographic information system and water quality index and compared with the standard drinking water guidelines proposed by the WHO (2017) and BIS (2012) for drinking and agricultural purpose. Inverse distance weighted (IDW) interpolation technique was used for preparing the spatial distribution maps for each physiochemical parameter. The analytical result signifies that 40% of the study areas are slightly acidic. GIS based water quality index shows that 63% of the area has recorded with good quality water, while the remaining 37% are of medium quality of water. The MWQI proved to be a useful method to classify the water similar to NSF-WQI in Madathukulam Taluk.
KEYWORDS:Correlation Coefficient; GIS; Modified Water Quality Index; Madathukulam Taluk; NSF-WQI; WHO
Download this article as:| Copy the following to cite this article: Chitradevi R, Jeyaraj M, Ghadamode V. D, Poonkodi K, Venkadasamy R, Magudeswaran P. N. Assessment of Water Quality Using Modified Water Quality Index and Geographical Information System in Madathukulam Taluk, Tiruppur District, Tamil Nadu, India. Orient J Chem 2021;37(5). |
| Copy the following to cite this URL: Chitradevi R, Jeyaraj M, Ghadamode V. D, Poonkodi K, Venkadasamy R, Magudeswaran P. N. Assessment of Water Quality Using Modified Water Quality Index and Geographical Information System in Madathukulam Taluk, Tiruppur District, Tamil Nadu, India. Orient J Chem 2021;37(5). Available from: https://bit.ly/3iG1tKU |
Introduction
Due to boom in population, improper irrigation, fertilization, industries uncontrollable rise in heavy metal concentration, in past few decades, water bodies are polluted1-2. Safe drinking water is essential to humans and other life for safe metabolic activities and functioning of all organs of the body. For a healthy living, potable water is a vital. In order to get the safe potable water various methods are adopted to check the quality of drinking water. Natural processes and anthropogenic activities were responsible for the degradation of water quality throughout the world. Water resource management and contamination plays a vital role in water quality assessment. Water quality generally encompasses physical, chemical and biological parameters and can be assessed by using water quality index, GIS and statistical approach3. One of the commonly used tools for the quality of water is water quality index (WQI). WQI is one the powerful framework to explicit water quality which provides simple, stable, reproducible unit to measure and communicate data on the quality of the water to the concerned citizen and policy makers4. Geographical information system (GIS) is an effective tool for collection, storage, management and recovery of a spatial and non-spatial data utilised for spatial analysis. Using GIS interpolation groundwater quality map and spatial map for physico-chemical parameter are obtained and explained pictorially. Once the water is polluted the quality of the water cannot be regenerated hence it is to be monitored regularly.
The groundwater resources play an important role in meeting the ever increasing demands of the domestic, industry and agriculture sectors5. Like surface water, groundwater quality can be adversely affected as a result of anthropogenic activities that introduce pollutants into the environment. It can also be affected by natural processes that result in increased concentrations of certain constituents in the groundwater. Monitoring and assessing the quality of groundwater is significant for sustainable use of these resources6-7.
A systematic study of correlation and regression coefficients of the water quality parameters not only helps to assess the overall water quality, but also to quantify relative concentration of various pollutants in water. This provides the necessary information which may be used in water quality management programmes8-14.
For any city, for drinking and irrigation purposes a groundwater quality map is important and as preventive indication of potential environmental health problems. The present study has been carried out to assess the status of surface and ground water quality in and around Madathukulam Taluk, Tirupur district and to examine the changes in water quality that have happened during the last decade. Also the relation between various surface and ground water quality parameters has been derived by using correlation analysis. Correlation models based on observed water quality parameters provide general indication of the quality of pollution loads on relative magnitude of loads. This approach is also useful to detect changes in water quality constitutions within the system.
Materials and Methods
Study Area
Madathukulam is a taluk belonging to the Tiruppur district in Tamilnadu state. It is located at the latitude of 10.5596° north and longitude of 77.3655° east and covers a total area of 451.23 square kilometres, which is measured by using ArcGIS 10.8 software is represented in Fig. 1. It is situated at the boundary of the Dindigul district. There are four town panchayats with thirty-five villages. The study area is primarily an agricultural based Zone and there are six paper mills, one dyeing unit and one dairy unit. Amaravathi River runs through town of the Madathukulam Taluk. The major water resources for domestic, agriculture and industrial purposes are fulfilled by Amaravathi River, lakes, ponds, open well and bore well water.
 |
Figure 1: Study area map – Madathukulam Taluk |
Sampling and analytical procedure
For the assessment of surface and groundwater quality 8 samples from open well, 23 from bore well, 2 from river, 1 from lake and 1 from pond were collected in an acid-washed and pre-cleaned container during pre-monsoon (March-May) season of 2020 and labelled from S1 to S35. Physicochemical and biological analysis was performed for 15 parameters i.e as pH, Temperature (°C), Faecal Coliform (MPN/100 ml), Dissolved Oxygen (%), Biological Oxygen Demand (mg/L), Total Dissolved Solids (mg/L), Total Phosphates (mg/L), Turbidity (NTU), Total Nitrates (mg/L), Electrical Conductivity (mS), Total Hardness (mg/L), Chloride (mg/L), Calcium (mg/L), Magnesium (mg/L), Sodium (mg/L), Potassium (mg/L) and Fluoride (mg/L) using standard methods.
Temperature and total dissolved solids (TDS) were measured in the field during sampling using a sensitive thermometer (Digital thermometer DTM-902) and a TDS meter (Pocket TDS meter- Hanna) respectively for each sample and the other parameters are measured in the laboratory. Calcium, magnesium and total hardness were measured by titrimetric and sodium, potassium ion was detected by flame photometer (Elico -130). Turbidity was measured using turbidity meter (Elico-CL 52D). The Winkler’s method was used for the determination of biological oxygen demand (BOD) and dissolved oxygen (DO). Fluoride and Phosphate ions were analysed using a UV-Visible Spectrophotometer (Shimadzu Model: UV-1800). Faecal Coliform is determined by membrane filtration. All the experiments were carried out thrice for each sample to attain quality assurance and control the quality. All the water quality parameters are stated in mg/L except Faecal coliform, pH and turbidity. All the water quality parameters and their analytical results are tabulated in Table 1 and compared with WHO15 and BIS standard values.
Water Quality Index (WQI)
The Water Quality Index is an effective tool and has been determined by the NSF-WQI method that is useful in recognizing the status of water bodies. Nine parameters were selected for the calculation of NSF-WQI is DO, FC, pH, BOD, Temp, TP, TN, TUR and TDS. The following steps were involved in the calculation of the WQI:
NSF-WQI was computed by using qi and Wi as shown below
Where, Wi – Weighing factor of parameter i
qi– Water quality score of parameters i
n – Number of parameters

The MNSF-WQI formula was derived by altering NSF-WQI with seven water quality parameters. For that, the weighing factor of BOD and total phosphate (TP) were distributed to other seven parameters. In the NSF formula, the contributing factor of BOD and total phosphates were distributed to the other parameters such as dissolved oxygen (DO), faecal coliforms (FC), pH, total nitrates (TN), turbidity (TUR), temperature (Temp) and total solids (TS) by using the mathematical principle of proportion and summation as follows.
The resultant formula of MNSF-WQI is

Spatial analysis
The base map of Madathukulam Taluk was digitized using ArcGIS 10.8 software. The spatial distribution for water quality parameters pH, Temp, TP, TN, TUR, TDS, DO, BOD, FC, EC, TH, Cl–, F–, Na+ and K+ were done with the help of spatial analyst tool in ArcGIS 10.8 software given in Figures 2-17. Inverse distance weighted (IDW) interpolation technique was used for preparing the spatial distribution maps for each physiochemical parameter and water quality index.
Result and Discussion
The physico-chemical and biological characteristics of the water samples in different places of Madathukulam Taluk are given in Table-1. The water quality index was calculated using the nine parameters and the overall water quality index values are given in Table 2. The analysed physio-chemical parameters were compared with water quality standards WHO15. Furthermore, statistical analysis of groundwater and surface water samples beyond the drinking water limit are presented in the Table 3.
Table 1: Analysis of Some Physico-chemical parameters in Madathukulam Taluk
|
Sampling Points |
Source |
DO % |
FC MPN/100 |
pH |
BOD mg/L |
Temp°C |
TP mg/L |
TN mg/L |
TUR NTU |
TDS mg/L |
Con mS |
T.H mg/L |
Cl– mg/L |
F– mg/L |
Na+mg/L |
K+mg/L |
|
S1 |
BW |
73.6 |
3 |
7.23 |
0.5 |
25.4 |
0.1 |
0.3 |
0.1 |
382.4 |
0.8 |
344.8 |
255.2 |
0 |
69 |
6 |
|
S2 |
BW |
77.9 |
2 |
6.2 |
0.9 |
24.2 |
0.2 |
0.6 |
0.2 |
252.1 |
0.5 |
215.5 |
191.4 |
0 |
48 |
8 |
|
S3 |
OW |
56.2 |
6.5 |
6.4 |
2.5 |
25.6 |
2.5 |
3.6 |
1.5 |
1258.9 |
2 |
336.2 |
684.1 |
0 |
69 |
7 |
|
S4 |
BW |
65.9 |
3 |
6.9 |
3.6 |
25.6 |
0.1 |
0.5 |
0.2 |
479 |
1.07 |
346.2 |
684.1 |
0 |
47 |
2 |
|
S5 |
BW |
74.5 |
4 |
7.4 |
0.7 |
25.3 |
0.3 |
0.2 |
0.1 |
1300 |
2.88 |
615.4 |
748.2 |
0 |
36 |
0 |
|
S6 |
BW |
89.6 |
5 |
6.2 |
0.4 |
24.6 |
0.4 |
0.4 |
0.1 |
742 |
0.69 |
900 |
159.2 |
0 |
97 |
5 |
|
S7 |
BW |
81.2 |
4 |
6.8 |
0.6 |
26.3 |
0.3 |
0.1 |
0.1 |
443 |
1.05 |
326.9 |
350.9 |
0 |
35 |
3 |
|
S8 |
R |
56.8 |
110 |
6.1 |
2.8 |
28.4 |
0.2 |
0.6 |
1 |
114.1 |
0.25 |
173.1 |
148.7 |
0 |
17 |
5 |
|
S9 |
BW |
68.4 |
4 |
6.7 |
0.4 |
24.6 |
0.1 |
0.7 |
0.1 |
1570.6 |
3.37 |
461.5 |
798.7 |
0 |
26 |
2 |
|
S10 |
OW |
63.9 |
96 |
6.2 |
2.7 |
23.4 |
0.2 |
0.1 |
0.6 |
34 |
0.07 |
115.4 |
241.1 |
0 |
13 |
0 |
|
S11 |
BW |
89.5 |
5 |
6.4 |
0.5 |
24.2 |
0.1 |
0.2 |
0.1 |
401.2 |
0.99 |
576.9 |
258.8 |
0 |
19 |
1 |
|
S12 |
BW |
78.3 |
4 |
7.1 |
1.3 |
24.6 |
0.3 |
0.2 |
0.1 |
495 |
1.17 |
461.5 |
357.7 |
0 |
46 |
2 |
|
S13 |
BW |
75.4 |
3 |
7.2 |
0.8 |
26.9 |
0.5 |
0.8 |
0.1 |
317 |
0.75 |
346.2 |
209.1 |
0 |
31 |
1 |
|
S14 |
BW |
56.3 |
5 |
6.5 |
2.5 |
25.9 |
0.2 |
0.4 |
0.2 |
183 |
0.42 |
365.4 |
184.3 |
0 |
15 |
1 |
|
S15 |
BW |
65.3 |
4 |
6.3 |
1.5 |
25.1 |
0.4 |
0.9 |
0.1 |
651 |
1.63 |
750 |
492.7 |
0 |
36 |
2 |
|
S16 |
P |
42.3 |
120 |
7.3 |
2.6 |
27.9 |
1 |
0.2 |
0.9 |
1350.2 |
3.06 |
1173.1 |
699.7 |
0 |
39 |
2 |
|
S17 |
BW |
67.3 |
6 |
6.3 |
2.2 |
25.2 |
0.5 |
0.3 |
0.9 |
172 |
0.6 |
138 |
184.3 |
0 |
87 |
12 |
|
S18 |
BW |
56.3 |
4 |
7.1 |
2.6 |
26.3 |
0.2 |
0.9 |
0.1 |
170.1 |
0.5 |
146.7 |
297.8 |
0 |
35 |
9 |
|
S19 |
BW |
63.7 |
3 |
7.2 |
1.8 |
24.3 |
0.4 |
0.2 |
0.2 |
459 |
1.04 |
365.4 |
492.7 |
0 |
52 |
3 |
|
S20 |
BW |
56.4 |
2 |
6.9 |
1.9 |
26.3 |
1.5 |
0.3 |
0.1 |
46.2 |
0.1 |
173.1 |
187.9 |
0 |
23 |
2 |
|
S21 |
BW |
72.3 |
2 |
6.8 |
1.5 |
24.6 |
0.2 |
0.5 |
0.1 |
450.2 |
0.23 |
900 |
158.9 |
0.5 |
56 |
6 |
|
S22 |
BW |
89.6 |
3 |
6.7 |
0.5 |
25.9 |
0.3 |
1.5 |
0.1 |
75.2 |
1.5 |
566.6 |
253.6 |
1 |
69 |
9 |
|
S23 |
BW |
73.8 |
4 |
7.1 |
1.5 |
24.9 |
0.1 |
1.1 |
0.1 |
123.4 |
2.3 |
1033 |
123.4 |
0 |
45 |
5 |
|
S24 |
L |
45.3 |
110 |
6.5 |
2.9 |
28.9 |
1.5 |
2.3 |
1.5 |
456 |
1.05 |
600 |
231 |
0 |
64 |
2 |
|
S25 |
OW |
48.9 |
11 |
6.2 |
2.4 |
25.9 |
0.5 |
1.2 |
0.5 |
125.8 |
1.2 |
433.3 |
214.3 |
0 |
89 |
2 |
|
S26 |
BW |
73.2 |
5 |
6.3 |
2.3 |
24.6 |
1.5 |
0.7 |
0.1 |
354 |
1.03 |
566.6 |
210.2 |
0 |
59 |
5 |
|
S27 |
OW |
54.1 |
100 |
6.1 |
2.6 |
27.9 |
1 |
1.5 |
0.5 |
47 |
0.23 |
533.3 |
95.2 |
0 |
94 |
9 |
|
S28 |
BW |
69.4 |
4 |
7.2 |
1.8 |
24.2 |
0.2 |
0.6 |
0.1 |
251 |
0.58 |
600 |
89.5 |
0 |
56 |
7 |
|
S29 |
OW |
64.3 |
120 |
6.4 |
2.9 |
28.2 |
0.3 |
1.2 |
1.5 |
345 |
0.68 |
633.3 |
78.4 |
0 |
45 |
4 |
|
S30 |
BW |
65.8 |
5 |
6.5 |
1.3 |
24.5 |
0.3 |
0.1 |
0.1 |
41 |
0.23 |
1366 |
98.4 |
0 |
98 |
3 |
|
S31 |
BW |
56.3 |
4 |
6.7 |
1.5 |
25.6 |
0.1 |
0.4 |
0.1 |
256 |
0.24 |
800 |
69.8 |
0 |
35 |
7 |
|
S32 |
OW |
49.8 |
7.9 |
6.8 |
2.3 |
26.1 |
0.1 |
1.3 |
0.1 |
145 |
0.54 |
1600 |
86.3 |
0 |
56 |
4 |
|
S33 |
OW |
36.9 |
9.8 |
7.1 |
2.5 |
25.3 |
0.2 |
1.4 |
0.1 |
165 |
0.68 |
433.3 |
74.2 |
0 |
84 |
2 |
|
S34 |
OW |
49.5 |
8.6 |
6.7 |
2.6 |
24.6 |
0.4 |
1.5 |
0.1 |
84 |
1.24 |
833.3 |
145.6 |
0 |
69 |
4 |
|
S35 |
R |
53.2 |
123 |
6.3 |
3.1 |
24.7 |
0.1 |
1.9 |
0.1 |
95 |
1.45 |
1366 |
123.4 |
0 |
59 |
6 |
|
WHO(2017) Standand Value |
10 |
6.5-8.5 |
25-30 |
45 |
<5 |
<500 |
600 |
300 |
1000 |
1.5 |
200 |
12 |
||||
|
BIS (2012) |
Not detected |
6.5-8.5 |
25-30 |
<5 |
<500 |
600 |
1000 |
1.5 |
12 |
|||||||
Table 2: Calculated NSF-WQI and MNSF-WQI values.
|
Sampling Points |
Source |
NSF WQI |
MNSF-WQI |
|
S1 |
BW |
80.35 |
80.65 |
|
S2 |
BW |
79.03 |
77.76 |
|
S3 |
OW |
57.36 |
58.14 |
|
S4 |
BW |
72.64 |
76.97 |
|
S5 |
BW |
76.41 |
78.33 |
|
S6 |
BW |
74.05 |
75.22 |
|
S7 |
BW |
77.87 |
78.34 |
|
S8 |
R |
63.06 |
60 |
|
S9 |
BW |
74.95 |
76.37 |
|
S10 |
OW |
66.42 |
63.88 |
|
S11 |
BW |
79.25 |
79.59 |
|
S12 |
BW |
77.15 |
78.92 |
|
S13 |
BW |
77.19 |
76.12 |
|
S14 |
BW |
70.75 |
69.95 |
|
S15 |
BW |
68.97 |
69.79 |
|
S16 |
P |
54.29 |
53.96 |
|
S17 |
BW |
70.39 |
68.54 |
|
S18 |
BW |
72.89 |
72.73 |
|
S19 |
BW |
72.73 |
73.77 |
|
S20 |
BW |
69.92 |
66.04 |
|
S21 |
BW |
78.07 |
79.63 |
|
S22 |
BW |
82.52 |
80.15 |
|
S23 |
BW |
80.91 |
79.67 |
|
S24 |
L |
52.5 |
50.23 |
|
S25 |
OW |
64.93 |
61.6 |
|
S26 |
BW |
67.27 |
66.96 |
|
S27 |
OW |
57.99 |
52.84 |
|
S28 |
BW |
78 |
78.11 |
|
S29 |
OW |
63.44 |
62.98 |
|
S30 |
BW |
78.12 |
75.34 |
|
S31 |
BW |
73.82 |
71.94 |
|
S32 |
OW |
72.39 |
71.09 |
|
S33 |
OW |
68.85 |
67.24 |
|
S34 |
OW |
69.62 |
67.64 |
|
S35 |
R |
73.26 |
70.89 |
(BW–Bore well, OW–Open well, L – Lake, R – River, P –Pond)
Table 3: Correlation coefficient for different water quality parameters
|
Parameters |
DO |
FC |
pH |
BOD |
Temp. |
TP |
TN |
TUR |
TDS |
Con |
T.H |
Cl |
F |
Na+ |
K+ |
|
DO |
1 |
|
|||||||||||||
|
FC |
-0.3758 |
1 |
|||||||||||||
|
pH |
-0.2150 |
0.0589 |
1 |
||||||||||||
|
BOD |
-0.8047* |
0.5752* |
0.0082 |
1 |
|
||||||||||
|
Temp. |
-0.3962 |
0.6664* |
0.2518 |
0.4029 |
1 |
||||||||||
|
TP |
-0.1591 |
0.1676 |
0.0561 |
0.2791 |
0.2056 |
1 |
|||||||||
|
TN |
0.1810 |
-.0.3074 |
-0.0340 |
-0.1568 |
-0.0051 |
0.1571 |
1 |
||||||||
|
TUR |
-0.2769 |
0.8000* |
0.0263 |
0.4338 |
0.6370* |
-0.0778 |
-0.2285 |
1 |
|||||||
|
TDS |
0.1351 |
0.0623 |
0.1172 |
-0.3541 |
0.0139 |
0.0032 |
-0.1263 |
0.0105 |
1 |
||||||
|
Con |
0.1143 |
-0.0457 |
0.1223 |
-0.3235 |
-0.0197 |
-0.0513 |
0.0836 |
-0.1152 |
0.7582* |
1 |
|||||
|
T.H |
-0.1825 |
-0.0377 |
0.0230 |
0.04343 |
-0.0543 |
-0.0854 |
-0.0006 |
-0.1235 |
0.0886 |
0.2050 |
1 |
||||
|
Cl |
0.1989 |
-0.0473 |
0.1649 |
-0.4150 |
-0.0385 |
-0.044 |
-0.0707 |
0.0009 |
0.7777* |
0.7477* |
-0.1729 |
1 |
|||
|
F |
0.3108 |
-0.1115 |
-0.0275 |
-0.2260 |
-0.0234 |
-0.0593 |
0.4939 |
-0.1064 |
-0.1084 |
0.0127 |
0.0567 |
-0.0607 |
1 |
||
|
Na+ |
-0.0468 |
-0.1237 |
-0.0310 |
-0.0030 |
-0.0447 |
0.0876 |
-0.1871 |
-0.1395 |
-0.2167 |
-0.107 |
0.2847 |
-0.2714 |
0.1243 |
1 |
|
|
K+ |
0.1577 |
-0.0938 |
0.0044 |
0.0040 |
0.0215 |
-0.0043 |
0.1899 |
-0.147 |
-0.3499 |
-0.2394 |
-0.051 |
-0.322 |
0.3029 |
0.4321 |
1 |
pH is an important parameter which indicates the hydrogen ion concentration in water16 and its scale is used to specify the acidic or alkaline nature of water17. The pH is altered by the presence of dissolved chemical compounds and biological processes in the water. If the water has less than seven may cause tuberculation and corrosion while higher the values may produce incrustation and complication during chlorination for water disinfection18. Spatial analysis of pH value of water samples (Fig.2) ranged from 6.1 to 7.4 (avg. 6.68). The permissible limit of pH according to WHO is 6.5-8.5. 40% of the study areas are acidic, which signifies the acidic nature.
 |
Figure 2: Spatial distribution of pH |
Dissolved oxygen is the water quality parameter which is vital for the respiration of aquatic life and the living organism19 which measures the amount of dissolved oxygen in the water, whose value impact on the living organism in the water bodies. Too high or too low DO can damage aquatic life and results in poor water quality20. The reduction of oxygen is probably due to the influence of physico-chemical properties and it recommends the poor quality of water. Deficiency of DO gives bad odour to water due to anaerobic respiration of organic matter21 and low DO is an index of polluted water body22. The DO value of the analysed samples varied from 36.9% to 89.6% (avg. 64.6%). Spatial analysis of DO value of water samples (Fig.3) indicates that samples collected from groundwater results with average DO value above 60% whereas samples from open source i.e from open well, lake, pond results in a lower DO. Low DO values are reported in open source sampling points S8, S16, S24, S27 and S35. Low DO value may lead to the degradation of an aquatic system.
 |
Figure 3: Spatial distribution of DO |
Biological oxygen demand is the amount of oxygen which is consumed by bacteria and fungi during the decomposition of organic matters under aerobic conditions for five days at a particular temperature23-24. BOD value is an indication of the amount of biodegradable waste in the water, as it utilizes organic matter in their respiration and eliminates oxygen from the water. Spatial analysis of biological oxygen demand (Fig.4) ranges from 0.4 mg/L to 3.6 mg/L with an average value of 1.81mg/L. The lowest value of BOD (0.4 mg/L) is found in sampling point S6 and S9, whereas the highest value of BOD (3.6 mg/L) is found in S4. Faecal coliforms account for the total number of coliforms in the water, which corresponds to faecal contamination16. Faecal coliform values of the water samples ranged from 2 to 120 MPN/100ml (avg. 21.9 MPN/100ml). Spatial analysis of FC (Fig. 5) shows that sampling points S8, S10, S16, S24, S27 and S29 are above the permissible limits of WHO which are collected from open sources like open well, pond, and lake.
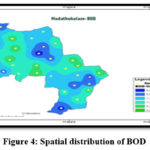 |
Figure 4: Spatial distribution of BOD |
 |
Figure 5: Spatial distribution of FC |
Temperature is one of the important physical parameters of water, since it controls various metabolic activities and life cycles. Temperature decides the rate of biochemical response in the aquatic ecosystem25 and influences the rate of chemical and biological reaction26. Spatial analysis of temperature (Fig.6) ranges from 23.4 0C to 28.9 0C with an average value of 25.6 0C. In the present study the lowest temperature 23.4 0C was recorded in S10 (Bore well) and the maximum temperature 28.9 0C is observed in S24 (lake). Total Phosphateis a key supplement for plant growth, but a high inflow of phosphorus into the water can increase eutrophication27. Total phosphate available in a given water source are due to sewage, detergents and fertilizers which leads to growth of microorganism. To accelerate the plant growth, farmers use maximum amount of phosphate fertilizer for the agriculture land which results in the contamination of water bodies through run off and affects aquatic life28-29. Spatial analysis of total phosphate (Fig.7) content of water varies from 0.1 mg/L from 2.5 mg/L and its average range is 0.47 mg/L.
 |
Figure 6: Spatial distribution of temperature |
 |
Figure 7: Spatial distribution of TP |
High level of total nitrate in water can cause eutrophication of surface water and serious health hazards30. Nitrate concentration increases due to anthropogenic activities, industry, domestic effluents etc. Spatial analysis of Total nitrate (Fig.8) ranged from 0.1 mg/L and 3.6 mg/L with mean of 0.617 mg/L and is within the permissible limit of WHO15. Turbidity is an optical property of water, which causes the light to be scattered and absorbed rather than transmitted in straight lines, it is mainly caused by the presence of suspended matterclay, slit, finely divided organic and inorganic matter, plankton and other microscopic organism31. Turbid water will be coloured which affects the physical appearance of water32. High turbidity causes poor visibility and affects aquatic life33. Spatial analysis map of turbidity (Fig.9) ranged from 0 NTU to 1.5 NTU, with an average of 0.27 NTU and it does not exceed 5 NTU which is the desirable limit as recommended by WHO15. The highest turbidity is observed in S24, S29 of 1.5 NTU.
 |
Figure 8: Spatial distribution of TN |
 |
Figure 9: Spatial distribution of turbidity |
Total dissolved solids (TDS)in water result from the presence of dissolved inorganic salts as well as organic matter in water. The major ions sodium, potassium, chloride, carbonate are responsible for TDS values34. Spatial analysis map (Fig.10) of total dissolved solids varied from 34 mg/L to 1570 mg/L with an average of 395 mg/L. TDS exceeded the desirable limit 500 mg/L of the water samples, but 88 % of the samples met the permissible level designated by WHO standards7. Excessive TDS in water disrupt ecological balance and cause suffocation of the aquatic fauna and can lead to constipation effects33,35 . The samples S3, S5, S6, S9, S15 and S16 were above the permissible limit and the remaining samples were below 500 mg/L. Electrical conductivity (EC)is the ability of water to carry a current of ions present in water. It is a measurement of the dissolved ions in the water, higher the ions in water, the higher will be the EC value36. It depends upon the presence of ions, total concentration, mobility and temperature. Spatial analysis map of (Fig.11) electrical conductivity ranged from 0.07 mS to 3.37 mS (avg. 1.032 mS), where all the samples are within the permissible limit, as per WHO7, the permissible limit for EC is 300 mS.
 |
Figure 10: Spatial distribution of TDS |
 |
Figure 11: Spatial distribution of EC |
Total Hardness of water is a degree of dissolved Ca2+ and Mg2+ content expressed as CaCO3 and it is the capacity of water to cause the precipitation of insoluble calcium and magnesium salts of the upper fatty acids of soapy solutions37. Magnesium is often combined with calcium in all kinds of water. According to WHO, the permissible limit of total hardness is 200 mg/L and maximum limit is 600 mg/L. In the present study total hardness of the analysed water sample ranged from 115.4 mg/L at S10 to 1600 mg/L at S32 with a mean value of 588 mg/L (Fig.12) and 11 sampling points (S5, S6, S15, S16, S21, S23, S29, S31, S32, S34, and S35) have a hardness exceeding 600 mg/L. The high levels of total hardness are found in all stations except S8, S10, S17, S18 and S20 and 57% of water samples have total hardness above the permissible limit recommended by WHO7.
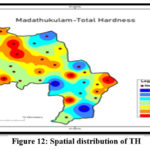 |
Figure 12: Spatial distribution of TH |
Chloride is one of the major inorganic anion present in water. The concentration of chloride can vary due to geochemical conditions, industrial waste, sewage disposal, leaching of salt residues into the soil. High concentration of chloride produces peculiar salty taste in drinking water38. The concentration of chloride and fluoride ranged from 69.8 mg/L to 798.7 mg/L (mean value of 276 mg/L) and 0 mg/L to 1 mg/L (mean value of 0.04 mg/L) respectively. According to WHO, the permissible limit for chloride and fluoride are 250 mg/L and 1.0 mg/L7. Spatial analysis of chloride (Fig.13) reveals that 60% of the samples have <250 mg/L and fluoride (Fig.14) content are lower than the WHO limit. Sodium and potassium ions are principal ion in body fluids, at low concentration it’s intake in form of a combined food or water sources is important. But increased intake of sodium in drinking water leads people to hypertension, heart disease or kidney problem39. The observed concentration of sodium and potassium ion varies from 13 mg/L to 98 mg/L and 0 mg/L to 12 mg/L with an average value of 51.94 mg/L and 4.23 mg/L respectively. The permissible limit of sodium is 200 mg/L and potassium is 12 mg/L respectively. Spatial analysis of sodium (Fig.15) and potassium (Fig.16) ion for water samples reveals that all the samples are within the permissible limit of WHO7.
 |
Figure 13: Spatial distribution of chloride |
 |
Figure 14: Spatial distribution of fluoride |
 |
Figure 15: Spatial distribution of sodium |
 |
Figure 16: Spatial distribution of Potassium ion |
Water Quality Index
Water quality index provides useful information on water quality by monitoring water quality parameters and it is the effective way to communicate the overall quality of the water. According to NSF-WQI water was classified into five types, if the WQI between 90-100 means excellent quality, 70-89 means good quality, 50-69 means medium quality, 25-49 means bad quality and 0-24 refers to very bad quality of water. In the present study, the calculated WQI ranges from 52.5 to 82.5 and the result, reveals that different sampling stations have different water quality. 63% of water sampling sites have good water quality and the remaining 37% fall into the medium quality category. The higher WQI (82.5) was recorded at S22 and the lower WQI (52.5) was observed in S24, this sample was collected from lake, the value indicate that the water quality was poor and shows higher level of pollution which are directly discharged into lake. Fig.17 illustrates the spatial distribution WQI map. The study highlights that the single value of WQI has enough and higher sensitivity to classify the water quality rather than long list of value with a large number of parameters. WQI methods will help developers in monitoring and assessment of the quality of water in the study area. The modified water quality index was derived by using seven water quality parameters instead of using nine parameters. The obtained results from NSF-WQI and MNSF-WQI are comparable. Fig.18 pictured the close relationship between the NSF and the Modified NSF water quality index values.
 |
Figure 17: Spatial distribution of WQI |
 |
Figure 18: Comparison of the WQI values of NSF and MNSF |
Correlation analysis
In order to observe the relationships between the physico-chemical parameters calculated, a correlation analysis was performed. A correlation coefficient (r) closer to +1 or -1 shows a perfect linear relationship between the two parameters and a correlation coefficient around zero means no relationship. Positive values indicate a positive relationship while negative values for r indicate a reciprocal relationship. Correlation coefficient (r) between any two parameters, x and y, among the selected water quality parameters of Madathukulam Taluk is shown in table 3. The degree of line association between any two parameters as measured by simple correlation coefficient (r) is represented in 17*17 matrix. From the table 3, it is observed that faecal coliform showed positive correlation with temperature (r=0.67), Turbidity (r=0.8). TDS is significantly in a positive correlation between conductance (0.76) and Cl (0.78), because a total dissolved solid depends on ions. There is a strong positive correlation between conductance and chloride (0.74), this is reliable with the fact that conductivity increases as the concentration of ion increases. Total hardness is in strong positive correlation with calcium hardness (r=0.75). Calcium hardness showed a significant positive correlation with magnesium hardness. DO, BOD, temperature, total phosphorous, total nitrate and chloride are negatively correlated. It can be resolved that the correlation analysis of the water quality parameter is highly important in the study of water bodies.
Conclusion
The present study reveals that the use of WQI and GIS methods could provide valuable information for assessment of water quality. The GIS is considered as an effective tool because with the GIS software, various maps showing the spatial distribution of water quality parameters have been prepared and analysed. These techniques have successfully demonstrated its capability of ground and surface water quality mapping of Madathukulam Taluk of Tiruppur district. A total of 35 water samples (23 from bore well, 8 from open well, 2 from river, 1 from lake and 1 from pond) were collected and investigated for various physico-chemical characteristics. The physicochemical parameters pH, TDS, TH are above the permissible limit referring to WHO (2017). On comparing the results of DO, FC, temperature of ground water and surface water, samples from surface water have low DO value and high FC and temperature. From this result it reveals that these values are triggered by the pollution due to paper, textile and dyeing industries in Madathukulam Taluk. GIS based Water Quality Index shows that 63% of the area has recorded with good quality water, while the remaining 37% are of medium quality of water. The result of the present study revealed that the chemistry of water bodies of the Madathukulam Taluk needs proper sanitation and proper plans for managing and protecting the surface water resources.
Acknowledgment
One of the authors R. Chitradevi is greatly thankful to Sri GVG Visalakshi College for Women, Udumalpet, Tamilnadu, India for irrecoverable support and providing the research facilities.
Conflict of Interest
The authors declare that they have no conflict of interest.
References
- Dutta, S.; Dwivedi, A.; Suresh Kumar, M. Environ. Monit. Assess. 2018, 190, 718. https://doi.org/10.1007/s10661-018-7100-x
CrossRef - Yalcin, M. G.; Aydin, O.; Elhatip, H. Environ. Monit. Assess, 2008, 137, 169–178. https://doi.org/10.1007/s10661-007-9737-8
CrossRef - Wu, Z.; Lai, X.; Li, K. Ecol. Indic. 2021, 121, 107021. https://doi.org/10.1016/j.ecolind.2020.107021
CrossRef - Verma, P.; Singh, P. K.; Sinha, R. R.; Tiwari, A. K. Appl. Water Sci. 2020, 10, 1–16. https://doi.org/10.1007/s13201-019-1088-4
CrossRef - Saleem, M.; Hussain, A.; Mahmood, G. Cogent. Eng. 2016, 3, 1-11. https://doi.org/10.10 80/23311916.2016.1237927
CrossRef - Selvam, S. J. Environ. Res. Technol. 2012, 2, 233–241.
- Singaraja, C.; Chidambaram, S.; Anandhan, P.; Prasanna, M.V.; Thivya, C.; Thilagavathi, R. Arab. J. Geosci. 2013, 6, 4167-4177. https://doi.org/10.1007/s12517-012-0675-6
CrossRef - Jayaraj, M.; Ramakrishnan, K.; Arunachalam, S.; Magudeswaran, P.N. Asian J. Chem. 2016, 28, 1469-1473. https://doi.org/10.14233/ ajchem.2016.19719
CrossRef - Jothivenkatachalam, K.; Nithya, A.; Chandramohan, S. Rasayan J. Chem. 2010, 3, 649-654.
- Maqbool, F.; Malik, A.H.; Bhatti, Z.A.; Pervez, A.; Suleman, M. Pak. J. Agric. Sci. 2012, 49, 95-100.
- Yadav, K.K.; Gupta, N.; Kumar, V.; Arya, S.; Singh, D. Recent Res. Sci. Techno. 2012, 4, 51-54.
- Heydari, M.M.; Abasi, A.; Rohani, S.M.; Hosseini, S.M.A. Middle-East J. Scientific Res. 2013, 13, 1238-1244.
- Rahman, A.U.; Muhammad, O.C. African J. Environ. Sci. Technol. 2014, 8, 86-90.
CrossRef - Gummadi, S.; Vishnuvardha, S.G.; Harika, D. IOSR J. Environ. Sci. 2014, 8, 27-32.
CrossRef - World Health Organization, Guidelines for drinking water quality first addendum to 3rd Ed. (1). World Health Organization (WHO). Recommendations Geneva 2017.
- Adimasu, W.W. J. Urban Environ. Eng. 2015, 9, 146-157. https://doi.org/10.4090/juee.2015.v9n2.146157
CrossRef - Jayaraj, M.; Ramakrishnan, K.; Arunachalam, S.; Jai Anathi.; Magudeswaran, P.N. Orient. J. Chem. 2016, 32, 2087-2094. http://dx.doi.org/10.13005/ojc/320436
CrossRef - Das, K. R.; Bhoominathan, S. D.; Kanagaraj, S.; Govindaraju, M. Appl. Water Sci. 2017, 7, 2907–2918. https://doi.org/10.1007/s13201-017-0579-4
CrossRef - Ewaid, S. H. Appl. Water Sci. 2017, 7, 3759–3765. https://doi.org/10.1007/s13201-016-0523-z
CrossRef - Surya L. P.; Mophin, K. K. Int. J. Technol. Eng. Stud. 2017, 4, 2348-1439.
- Sallae, A.J. Water-bom diseases. In: Fundamental Principles of Bacteriology, 7th Ed. Tata McGraw Hill Publishing Company Ltd., New Delhi 1974.
- Iqbal, P. J.; Pandit, A.K.; and Javeed, J.A. J. Res. Dev. 2006, 6, 81-85.
- Vaibhav, R.; Vighneshwara, S.G.; Kumar, C.; Vishal S. K. Int. J. IT Eng. 2019, 7, 13-29.
- Naubi, I.; Zardari, N.H.; Shirazi, S.M.; Ibrahim, N.F.B.; Baloo, L. Pol. J. Environ. Stud, 2016, 25, 231–239. https://doi.org/10.15244/ pjoes/60109
CrossRef - Oram, P.G. 2017, [Online]. www.waterresearch.net/index.php/stream-water-quality-importanceof-temperature
- Viessman, W.; Hammer, M.J. Water supply and pollution control, 7th Ed. The University of Michigan, Pearson Prentice Hall, USA, 2005.
- Garima, S.; Kumar, P. Int. J. Res. Engineer. Technol, 2013, 2, 609–614. https://doi.org/10.15623/ijret.2013.0204035
CrossRef - Ahamed, A.J.; Loganathan, K.; Jayakumar, R Sustain. Water Resour. Manag. 2015, 1, 273–291. https://doi.org/10.1007/s40899-015-0026-3
CrossRef - Bandela, N.N.; Vaidya, D.P.; Lomte, V.S.; Shivanikar, S.V. Poll. Res. 1999, 18, 411 – 414.
- Shah, K. A.; Joshi, G. S. Appl. Water Sci. 2017, 7, 1349–1358.
CrossRef - Mathuram, T.; Chandran, M.; Dinakara, K. Int. j. creat. res. Thoughts, 2017, 5, 2320-2882.
- Gupta, N.; Pandey, P.; Hussain, J. Water Science, 2017, 31, 11–23, https://doi.org/10.1016/j.wsj.2017.03.002
CrossRef - Pandey, H. K.; Tiwari, V.; Kumar, S.; Yadav, A.; Srivastava, S. K. Sustain. Water Resour. Manag, 2020, 6, 1-14. https://doi.org/10.1007/ s40899-020-00375-x
CrossRef - Garg, R.K.; Rao, R.J.; Uchchariya, D.; Shukla, G.; Saksena, D.N. Afr. J. Environ. Sci. Technol, 2010, 4,61 –76.
CrossRef - Prasad, G.; Satya, N, Indian J. Environ. Prot. 2004, 24, 60-64.
CrossRef - Pushpam P.M.; Bhagan, V.U.; Kumaraswamy, A. Intl. J. Latest Trends in Eng. Techno, 2013, 2, 235–240.
- Etim, E. E.; Odoh, R.; Itodo, A. U.; Umoh, S. D.; Lawal, U. Front. Life Sci, 2013, 3, 89–95. https://doi.org/10.5923/j.fs.20130303.02.
- Soumya, S. S.; Devatha, C. P.; Sudhakar, S.; Verma, M. K. Int. J. Eng. Res, 2015, 4, 689–694.
- Selvam, S.; G. Manimaran, G.; Sivasubramanian, P.; Balasubramanian, N.; Seshunarayana, T.; Environ. Earth Sci. 2013, https://doi.org/10.1007/ s12665-013-2662-y
CrossRef

This work is licensed under a Creative Commons Attribution 4.0 International License.
About The Author
![]()
A New Edition of Web of Science
Journal Impact Factor
2022: 0.5
Five Year: 0.8
Journal is Indexed in

Cabells Whitelist
![]()


