Spectroscopic Elucidation of Some Complexes of Vanillin Semicarbazone
1Department of Chemistry, Magadh University, Bodh-Gaya - 824234.
2Department of Chemistry, D. N. Y. College, Silaundha (V. K. S. University, Ara)
3Department of Chemistry, Patel College, Ghusia (V. K. S. University, Ara)
Corresponding Author E-mail: sharma.shivadhar@gmail.com
DOI : http://dx.doi.org/10.13005/ojc/370409
Download this article as:
![]()
3-Phenyl-4-methoxybenzaldehyde undergoes condensation with semicarbazide hydrochloride to form a Schiff-base i.e. 3-phenyl-4-methoxybenzaldehyde semicarbazone (abbreviated as MBS). It undergoes complexation with Vanadium(II), Manganese(II), and Copper(II). The comparison of FTIR-spectra of complexes with that of free ligand helps ascertain the coordination points of ligand through the nitrogen of –CH=N– group and oxygen of group. The axial ligands have been varied by chloride, acetate and nitrate ions. The UV/Visible and ESR spectra of complexes predicts their tetragonally distorted octahedral (D4h) symmetry. The tetragonal distortion parameter (Dt) is observed maximum for chloride while it is minimum for nitrate along z-axis. Both vanillin and semicarbazide are established biologically active compounds and hence their biological activities may be enhanced by their complexation and than a versatile field may be developed for further exploration.
KEYWORDS:ESR Spectra; 3-phenyl-4-methoxybenzaldehyde Semicarbazone; Tetragonal distortion; UV/Visible Spectra
Introduction
Although electron spin resonance (ESR) Spectrum which is also known as electron paramagnetic resonance (SPR) spectrum offers an excellent tool as well as a good concept to look into the structural intricacy of complex compounds having paramagnetic character, it has insufficiently been tapped in the field of coordination chemistry. In the most cases the usual X-band ESR in the range of 9.5 GHZ has been used[1-5]. But now a days several modified approaches have meritoriously been explored providing a better understanding of coordination chemistry 6-8
To quantify the correlation between structural and magnetic properties of coordination compounds their ESR spectral studies have been made by several workers9-11.R. S. Smith and co-workers12 have reported ESR study to identify the site of Cu(II) in Riboflavin Binding protein while Smith and co-workers13 have used ESR signals of complexes to ascertain their structural properties and their relation with biological activities. Maheshwari and co-workers14 have reported the distorted tetrahedral coordination environment around Cu(II) in its complexes with g|| (2.24) > gz (2.08) > g (2.0) suggesting dx2–y2 ground state15-17. The survey of literature reveals that the influence of axial ligands on the lowering of symmetry of octahedron has scarcely been made. Because of the large structural variability depending on the nature of axial ligands, we report herein the structural determination of some V(II), Mn(II) and Cu(II) chelates with different axial ligands by their spectral studies.
Experimental
All the chemicals used were of Anal-R-Grade. Vanilline was procured from the firm Acros Organics and semicarbazide hydrochloride from Merck and they were used as received. The ligand vanillin semicarbazone was prepared by refluxing the mixture of 100 mL mlethanolic solution of 0.01 mol (1.52 gms) of vanilline, (i.e., 3-hydroxy-4-methoxybenzaldehyde) and 100 mL ethanolic solution of 0.01 mol (= 1.15gms) of semicarbazide hydrochloride, on water bath for two hours and solution was cooled with stirring for ten minutes with mechanical stirrer whereby a colourless solid was observed which was left to settle for an hour. It was suctioned and the precipitate was backwashed with water. It was crystallized in ethanol. About 1.78 gms of the product was obtained (nearly 86% yield) its melting point was recorded 228°C. The chemical reaction may be given as scheme-I.
 |
Scheme 1 |
The ligand was used for complexation by refluxing the respective metal salts with ligand taken in 1 : 2 molar ratio in ethanolic medium for 2 to 4 hours. The resulting solution was left overnight whereby solid appeared which was washed and filtered and finally it was recrystallized in ethanol.
The molar conductivity of complexes was determined in Dimethylformamide using Sistronic direct reading 304 conductivity meter. The FTIR-Spectra (KBr) were recorded in the range of 200-4000 cm–1 on a Nicolet Manga-550 FTIR spectrophotometer and their UV/Visible spectra were recorded on a Hitachi U-2000 spectrophotometer. The ESR spectra were recorded on X-band EPR-Varian E-line Century Series spectrometer. The magnetic moment of complexes was determined by Gouy balance at room temperature. Microanalytical values with otherphysical parameters are presented in Table-1.
Table 1: Microanalytical values, Molar conductivity and Magnetic susceptibility values of ligand vanillinsemicarbazone (VSCH) and complexes. % Composition Cal/(Found)
|
S.No. |
Ligand & Complexes |
Colour |
Yield% |
Metal |
Carbon |
Hydrogen |
Nitrogen |
Clhlorine |
m (BM) |
l in ohm–1 cm2ml–1 |
|
1. 2.
3.
4.
5.
6.
7.
8.
9.
10. |
Ligand [V(MBS)2Cl2]
[V(MBS)2(CH3COO)2]
[V(MBS)2(NO3)2]
[Mn(MBS)2Cl2]
[Mn(MBS)2(CH3COO)2]
[Mn(MBS)2(NO3)2]
[Cu(MBS)2Cl2]
[Cu(MBS)2(CH3COO)2]
[Cu(MBS)2(NO3)2] |
Blue
Blue
Dull Blue Light Pink Light Pink Pink
Green
Light Green Whitish Green |
86
78
70 71
67
73
77
72
75
70 |
–
9.30 (9.44) 8.60 (8.68) 8.40 (8.60) 10.02 (10.11) 9.20 (9.30) 9.04 (9.21) 11.40 (11.49) 11.00 (11.06) 10.39 (10.48) |
51.50 (51.67) 39.47 (40.00) 44.30 (44.99) 36.20 (36.42) 39.21 (39.70) 44.30 (44.66) 36.00 (36.18) 39.40 (39.45) 43.98 (44.03) 35.61 (35.67) |
5.15 (5.26) 4.00 (4.07) 4.20 (4.77) 3.50 (3.70) 4.00 (4.09) 4.70 (4.73) 3.50 (3.68) 3.88 (3.98) 4.59 (4.67) 3.58 (3.63) |
20.00 (20.09) 15.32 (15.55) 14.01 (14.31) 18.00 (18.88) 15.24 (15.44) 14.10 (14.21) 18.70 (18.76) 15.10 (15.20) 13.95 (14.01) 18.40 (18.49) |
–
13.05 (13.14) –
–
12.98 (13.05) –
–
12.70 (12.85) |
–
3.75
3.74
3.77
5.95
5.84
5.96
1.98
2.01
1.97 |
–
17.00
15.00
17.00
18.00
20.00
20.00
16.00
15.00
17.00 |
Results and Discussion
Very low values of λ are predicting their non-electrolytic character leading to their formulation as [M(MBS)2X2]18-20.
λ
FTIR Spectra
The important FTIR bands of interest absorbed by free ligand and its complexes are presented below in tabular form.
Table 2: Important FTIR bands in cm–1 of free ligand and its complexes.
|
Bands |
Assignment in Free Ligand |
Position in Metal Complexes |
|
3525(Br) 3470 (S) 3290 (S) 3090 w 2960 2875 1690 (S) 1640 (S) New bands 495-500 420-425 |
nO–H(Phenolic) nN–H(asy) nN–H(sy) nC–H(aromatic) (asym) (sym) nC=O nC=N |
3525 cm–1 3465 ~3290 ~3090 2965 2875 1650-1660 1590-1610 nM–N nM–O |
The broad band appearing at 3525 in FTIR spectrum of the free ligand is assigned to nOH (Phenolic)21-23 of the free ligand which remains almost intact even after complexation. It shows non participation of phenolic oxygen in co-ordination. Sharp absorption at 3470 cm–1 and 3290 cm–1may be due to nN–H(asy) and nN–H(sym) respectively24-25. Their positions do not undergo change appreciably in FTIR spectra of the complexes and hence it is inferred that –ǸH group is not participating in coordination. v –c1= o group of ligand absorbs sharply at 1690 cm–1. 26-27. This band undergoes negative shift and absorbs at 1650-1660 cm–1 in FTIR spectra of all the complexes. It supports the coordination of carbonyl oxygen of ligand to metal ions.
A band at 1640 cm–1 in the FTIR spectrum of the ligand has been attributed to nC=Nstretching vibrations. In complexes this band undergoes red shift and appears at 1590-1610 cm–1. It confirms the coordination of N of azomethine moiety of the ligand[28-31]. A tacit support for the above propositions is brought out more clearly from the far FTIR spectra of the complexes which display new weak bands appearing at 495-500 cm–1 and 420-725 cm–1 due to nM–N and nM–O stretching vibration respectively[32-33].
In addition to these, some other bands also appeared in the FTIR spectra of the complexes. In chloride complexes, i.e. complex no. 2, 5 and 8 a new band appears at 365-370 cm–1 which indicates the presence of coordinated Cl– ions at trans positions[34]. In complexes no. 4, 7 and 10 three medium intensity bands are present in the range of 1445-1460, 1310-1320 and 1000-980 cm–1,that confirm the presence of unidentately coordinated nitrate (NO3¯) group35-37. The band at 1000-980 cm–1 is the characteristic absorption band for coordinated nitrate group and the absorption band at 1445-1460 cm–1 confirms the monodentate coordination mode of NO3–group[38]. Furthermore two bands appearing at 1620-1630 and at 1300 cm–1 in complexes 3, 6 and 9 may safely be assigned to the asymmetric and symmetric stretching of monodentate acetate ion39,40.
Vanadium (II) Complexes
The V(II) complexes exhibit magnetic moment 3.74-3.77 BM. V(II) is a d3 system for which ms = 3.88 BM. The experimental value of m is less than ms value for three unpaired electrons. In octahedral symmetry, V(II) has 4A2g crystal field component of 4 F term is singly degenerate and hence no orbital contribution is expected. Therefore, complexes should exhibit mvalue close to ms, i.e. 3.88 BM. But as the next excited crystal field component of 4F is 4T2g which causes the mixing of the singly degenerate A2g term with triply degenerate 4T2g term. Subsequently magnetic moment value of a complex is given by meff = ms(1–4l/10Dq) where l is spin orbit coupling constant which is positive for d3 system[40]. The d-d transitions cause four absorption bands in UV/Visible spectrum of V(II) complexes. Their assignments may be given as–
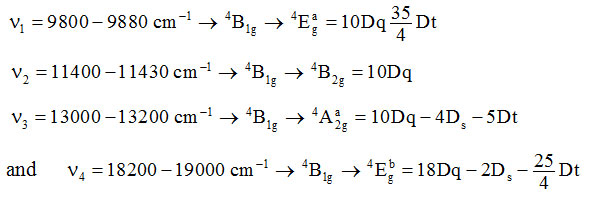
The various crystal field parameters were calculated from these transitionsand are given below in table-3.
Table 3: Values of Crystal Field Parameters (in cm–1) of vanadium(II) complexes.
|
Complexes |
Dq(xy) |
Dq(z) |
Dt |
Ds |
| [V(MBS)2Cl2] [V(MBS)2(CH3COO)2] [V(MBS)2(NO3)2] |
1140 1142 1143 |
819.76 828.125 833 |
183 179.12 177.14 |
–628.75 –656.75 –663.925 |
These values support tetragonally distorted octahedral (really D4h) symmetry around V(II) in complexes40.
Manganese(II) Complexes
Mn(II) complexes recorded 5.84-5.96 BM magnetic moment at room temperature showing the presence of five unpaired electrons.So, they are high spin octahedral complexes25,41,42. UV/Visible spectra of these Mn(II) complexes displayed four bands of very low intensity. Mn(II) is a d5-system for which the ground state term is 6S which under octahedral symmetry transforms as 6A1g. The other higher states are of quartet or doublet spin states. So, obviously these transitions are spin forbidden and hence of low intensity. The assignment of these bands may be given as below:
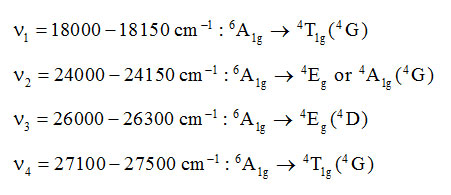
These spin forbidden transitions are not governed by 10 Dq and really depend on Racah parameters B and C. Dq values have however been derived using Tanabe-Sugano diagram. The Table-4 displays the Dq, B, C and nephelauxetic effect (β) of Mn(II) complexes:
Table 4: Crystal Field Parameters (in cm–1) of Manganese(II) complexes.
|
Complexes |
Dq |
B |
C |
b(%) |
| [Mn(MBS)2Cl2] [Mn(MBS)2(CH3COO)2] [Mn(MBS)2(NO3)2] |
904.5 879.5 954.0 |
753.77 768.68 763.24 |
3312.46 3072.4 3273.52 |
24.48 20.36 20.49 |
From these values it could be inferred distorted octahedral symmetry around Mn(II) in these complexes43-47.
Copper(II) Complexes
These complexes exhibit magnetic moment 1.97-2.01 BM which is indicative of six coordinated distorted octahedral symmetry of Cu(II) complexes with appreciable distortion along z-axis48-50. In UV/Visible spectra they displayed a very broad band ranging between 11,500-18500 cm–1. The band was resolved by Gaussian analysis using Fortran Fitting Program. Each of the resolved spectra displayed four bands. Taking the cue from the reports of Liehr51, and Sugano & Tanabe[52] the splitting of 2D of d9 Cu(II) may be given as in scheme-II:
 |
Scheme 2 Click here to View scheme |
So, the four bands may be assigned as below:
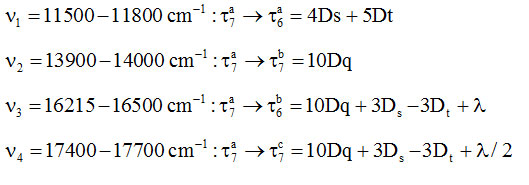
On the basis of energy associated with different transitions, the various crystal field parameters were calculated and values have been given in Table-5.
Table 5: Crystal Field Parameters (in cm–1) of Copper(II) complexes.
|
Complexes |
Dq |
Dt |
Ds |
l |
| [Cu(MBS)2Cl2] [Cu(MBS)2(CH3COO)2] [Cu(MBS)2(NO3)2] |
1400 1390 1395 |
546.15 563.79 594.35 |
2192.5 2195.26 2207.06 |
–800 –793 –790 |
The results fairly suggest tetragonally distorted octahedral (D4h) symmetry of Cu(II) complexes53-54.
ESR Spectra of Complexes
The X-band ESR Spectra of V(II) complexes in polycrystalline form at room temperature displayed eight groups, each consisting of five super hyper fine lines. V(II) is a d3 system with three unpaired electrons and hence S = 3/2. Thus zero field operates here and three ESR signals are expected as per the selection rule of DMs=. As 51V has nuclear spin, I = 7/2, the interaction of electron spin with nuelear spin (7/2) causes splitting of each of three signals into 2I + 1 = 2 × 7/2 + 1 = 8 hyperfine lines. The further interaction with two N-nuclei with I = 1 of the ligands causes the further splitting of each of the eight lines into (2nI + I) = 2 × 2 × 1 + 1 = 5 superhyperfine lines. The resolution of lines is fine at high field. Table-6 display the spin Hamiltonian parameters of V(II) complexes.
Table 6: Different Spin Hamiltonian Parameters of V(II) complexes.
|
Complexes |
g|| |
gav |
cm–1×10⁻⁴ |
A|| cm–1×10⁻⁴ |
D |
|
|
[V(MBS)2Cl2] [V(MBS)2(CH3COO)2] [V(MBS)2(NO3)2] |
1.976 1.972 1.980 |
1.974 1.969 1.978 |
1.975 1.971 1.979 |
74 70 68 |
76 70 69 |
0.125 0.124 0.127 |
 |
Scheme 3: Arrangement of same donor atoms at cis position. |
 |
Scheme 4: Arrangement of same donor atoms at trans position. |
These values provide the additional support for tetragonally distorted octahedral complexes of V(II)55,56. From this it could be inferred that the arrangement of the planer ligands around V(II) is like (Scheme-III) because in the second arrangement of ligands (Scheme-IV) a situation is produced where three values of g tensor i.e. gx, gy and gz would have been obtained.
The ESR Spectra of Mn(II) complexes show five groups of poorly resolved six lines. It is a d5 system with S = 5/2 and hence due to zero field splitting, three doubly degenerate (Kramer’s degeneracy, ±5/ 2, ± 3/2, ±1/2) states are obtained which split under applied magnetic field producing five signals. These signals further undergo hyperfine splitting as the interaction of electron spin (S = 5/2) with nuclear spin (I = 5/2) of 55Mn into 2 × 5/2 + 1 = 6 lines. However, the super hyperfine splitting of these fine lines due to interaction with two N of nuclear spin I = 1 of the ligands couldn’t be observed. Table-7 presents the values of various spin Hamiltonian parameters of Mn(II) complexes.
Table 7: The different Spin Hamiltonian Parameters values of Mn(II) complexes.
|
Complexes |
g| | |
gav |
cm–1×10⁻⁴ |
A| | cm–1×10⁻⁴ |
D |
G |
|
|
[Mn(MBS)2Cl2] [Mn(MBS)2(CH3COO)2] [Mn(MBS)2(NO3)2] |
2.0018 2.0020 2.0021 |
2.0004 2.0007 2.0005 |
2.008 2.0014 2.0010 |
–84 –83 –83 |
–81 –80 –81 |
0.06432 0.06444 0.06438 |
4.5 4.1 4.2 |
The values of G > 4 show negligible exchange interaction between different Mn(II) centers in the polycrystalline form[57]. The values of g||, g ⊥ and gav provide a good support to distorted octahedral symmetry of Mn(II) complexes derived from their UV/Visible spectra58,59.
In the case of Cu(II) complexes, the interaction of one electron spin (S = 1/2) with nuclear spin (I = 3/2) of 63Cu, their ESR spectra displayed four lines.Super hyperfine coupling with nuclear spin of two N-atoms of the ligands coordinated to Cu(II), however, is not observed. The analysis of spectra leads to anisotropic values of g and A24 which are given in Table-8.
Table 8: The different Spin Hamiltonian Parameters of Cu(II) complexes.
|
Complexes |
g| | |
gav |
G |
cm–1×10⁻⁴ |
A| | cm–1×10⁻⁴ |
|
|
[Cu(MBS)2Cl2] [Cu(MBS)2(CH3COO)2] [Cu(MBS)2(NO3)2] |
2.0681 2.0556 2.0598 |
2.2754 2.2624 2.2638 |
2.1372 2.1245 2.1278 |
4.02 4.7 4.4 |
101 105 100 |
120 121 124 |
From the table it is obvious that g||, g ⊥ which is in accordance with the ground state configuration of 60,61.
From the values of ESR parameters it is concluded that all the Cu(II) complexes are tetragonally elongated octahedral.
Conclusion
The forgoing electronic and ESR spectral study of complexes, reveals tetragonally distortion in their octahedral symmetry. From the values of tetragonal distortion parameter (Dt) it may be concluded that there is greater distortion when the axial positions are occupied by Cl–ion and it is minimum when there is NO3 ion along z-axis.
Ackowledgement
The authors are thankful to Dr. Md. Alamgir, the Analyst, P. G. Department of Chemistry, M. U., Bodh-Gaya for recording FTIR and UV/Visible spectra of complexes.
Conflicts of Interest
The authors have no conflict of interest.
References
- Kristoffer, K.; Schmidt, P. P.; Katterie, B.; Strand, K. R.; Palmer, A. E.; Lee, S. K.; Solmon, E. I.; Graslund, A. and Barra, L., J. Biol. Inorg. Chem., 2003, 8, 235.
CrossRef - Gold farb, D. and Arieli, D., Annu. Rev. Phys. Chem. 2004, 51, 441.
CrossRef - Mobius, K.; Savitsky, A.; Schregg, A.; Plato, M and Fuchs, M., Phys. Chem., 2005, 7, 19.
CrossRef - Goldtarb, D., Phys. Chem., 2006, 8, 2325.
CrossRef - Ranjan, R.; Rani, R.; Kumar, V.; Singh, A. K.(Jr.) and Sharma, S., J. Ind. Chem. Soc., 2008, 85, 317.
- Lubitz, W.; Reijerse, E. and Van Castel, M., Chem. Rev., 2007, 107, 4331.
CrossRef - Gyatathri, N. and Suresh, M. S., Asian. J. Chem., 2017, 29(3), 541-546.
CrossRef - Van Doorslaer, S.; Caetti, I.; Fallis, I. A. and Murphy, D. M., Coord. Chem. Rev., 2009, 253, 2116.
CrossRef - Ruffer, T.; Braner, B.; Powell, A.; Hewitt, I. and Salvan, G., Inorg. Chim. Acta.,2007, 360, 11.
CrossRef - Pillet, S.; Soutiasou, M.; Mathoniere, C. and Lecomte, C., J. Am. Chem. Soc., 2004, 126, 1219.
CrossRef - Braner, B.; Weigend, F.; Fittipaldi, M.; Gatteschi, D.; Reijerse, E. J.; Guerri, A.; Ciattini, S.; Salvan, G. and RufferRobia, Inorg. Chem., 2008, 47, 6633.
CrossRef - Smith, R. S; Bencze, K. Z.; Russ, K. A.; Wasiukanis, K.; Parsons, M. B. and Stemmler, T. L., Inorg. Chem., 2008, 47, 6867.
CrossRef - Smith, R. S.; Pala, I.; Parsons, M. B., J. Inorg. Biochem.,2006, 100(II), 1730.
CrossRef - Palamisamy, U.; Maheshwari, M.; Vanderster, S.; Barends, S.; Vanweze, G. P.; Massera, C.; Roy, S.; Den Dulk, H. and Gamez, P., J. Reedijk. Inorg. Chem., 2008, 47, 31719.
- Albada, G. A. V.; Mutikainen, I.; Riggio, I.; Turpeinen, U. and Reedijk, J., Polyhedron, 2001, 20, 2659.
CrossRef - Willett, R. D.; Pon, G. and Nagy, C., Inorg. Chem., 2001, 40, 4342.
CrossRef - Meppelder, G. J. M.; Halbach, T. S.; Spaniol, T. P.; Mulhaup, R. and Okuda, J., J. Organomet. Chem., 2009, 694, 1235.
CrossRef - Qualgicano, J. V.; Fujita, J.; Franz, G.; Philips, D. J.; Walmsley, J. and Tyree, J., J. Am. Chem. Soc., 1961, 83, 3770.
CrossRef - Mahapatra, B. B. and Patel, N., J. Indian Chem. Soc., 2009, 86, 529.
- Sathya Narayan, D. N. and Patel, C. C., Indian J. Chem. Sect. A, 1967, 5, 360.
- Mahapatra, B. B. and Sargani, A. K., J. Indian Chem. Soc., 2009, 86, 559.
- Malik, S.; Kumar, M. and Sharma, D. K., J. Indian Chem. Soc., 2010, 87, 539.
- Kumar, V.; Singh, R. K.; Kumari, V.; Kumar, B. and Sharma, S., Orient. J. Chem., 2018, 34(4), 1937-1944.
CrossRef - Bharti, S.; Chaudhry, M.; Rawat, S. P.; Sangeeta; Ahmad, N. K.; Sharma, S. R.; Saket, S. S.; Singh, B.; Das, B. and Kumar, S., J. Ind. Chem. Soc., 2016, 93, 953.
- Prasad, D.; Kumar, D.; Kumar, A.; Subhas, B. N.; Kumar, V. and Sharma, S., J. Env. Bio-Sci., 2019, 33(2), 291-302.
- Ezhilarasi, J. R.; Malarkodi, J. H. and Divya, S., Asian. J. Chem., 2017, 29(12), 2619-2622.
CrossRef - Al-Jibouri, M. N., Musa, T. M. and Ismail, A. H., Asian, J. Chem., 2018, 30(9), 2017-2021.
CrossRef - Rai, R.; Kumari, R. and Rai, B. K., Asian J. Chem., 2017, 29(12), 2707-2710.
CrossRef - Karim, A.; Rani, R.; Ranjan, R.; Kumar, U.; Kumar, V. and Sharma, S., Asian. J. Chem., 2017, 29, 626.
CrossRef - Pradhan, R.; Sinha, S. K.; Verma, P.; Kumar, S. and Sharma, S., Asian J. Chem., 2018, 30(9), 1989-1993.
CrossRef - Kumar Birendra; Kumar, B.; Kumar, S.; Kumar, D. and Sharma, S., Orient. J. Chem., 2017, 33(5), 2643-2646.
CrossRef - Sinha, N.; Kumar, S.; Kumar, D.; Chandra, C. M.; Kumar, S. and Sharma, S., Asian, J. Chem., 2018, 30(II), 2424.
CrossRef - Kumar, B.; Rani, R.; Prasad, D.; Singh, P. K.; Kumar, A. and Sharma, S., Orient J. Chem., 2019, 35(4), 1463.
CrossRef - Chandra Chandra, S and Gautam, A., J. Indian Chem. Soc., 2008, 85, 980.
- Palsi, P. S., “Spectroscopy of Organic Compounds”, 4th ed., New Age International (P) Ltd., New Delhi, India 199.
- Nakamoto, K., “Infrared Spectra of Inorganic & Coordination compounds,Ist edition John Wiley and Sons. Inc., New York, London. 1962.
- Chandra, S.; Jain, D.; Sarkar, A. and Anupama, J. Indian Chem. Soc., 2009, 86, 220.
- Prasad, R. N. and Mathura, M., J. Indian Chem. Soc., 2011, 88, 415.
- Earnshaw, A., “Introduction to Magneto Chemistry”,Ist edition Academic Press, London, New York, 1968, 58.
- Rastogi, A.; Anurag and Nayan, R., J. Indian Chem. Soc., 2009, 86, 783.
- Cotton, F. A.; Progress in Inorganic chemistry, Interscience Publishers, 1964, Vol-6, P-43.
CrossRef - Ahuja, I. S., Indian J. Chem., 1983,22A, 262.
- Sharma, R. C.; Jain, C. L.; Rastogi, S. C. and Vats, J. L.,Inorg. Chem. Acta., 1976, 16, 103.
CrossRef - Revanasidappa, M.; Basavaraj, C.; Suresh, T. and Angadi, S. D., J. Indian Chem. Soc., 2009, 86, 127.
- Jorgenesen, C. K.,Prog. Inorg. Chem., 1962, 7, 73.
- Chaurasia, M. R.; Saxena, S. K. and Khatri, H. D., Indian J. Chem., 1981, 20A, 741.
- Kumar, D.; Singh, K. A.; Kumar, A.; Prasad, D.; Kumar, V. and Sharma, S., Asian, J. Chem., 2020, V-32(II), 2009-2014.
- Gill, N. S.; Nijuttal, R. H.; Scaife, D. E. and Ashrap, D. W., J. Inorg. Nucl. Chem., 1961, 18, 196.
CrossRef - Ghosh, S. P., J. Indian Chem. Soc., 2002, 74, 367.
CrossRef - Nane, F. S.; Shivadhakar, S. G. and Chandekhan, T. K., J. Indian Chem. Soc., 2002, 79, 376.
- Liehr, A. D., J. Phys. Chem., 1960, 64, 43.
CrossRef - Sugano, S. and Tanabe, Y., J. Phys. Soc. Jpn., 1958, 13, 880.
CrossRef - Shukla, D.; Chandra, S.; Tyagi, R. and Kumar, M., J. Kuwait. Chem. Soc., 2005, 32, 61.
- Shukla, D. and Tyagi, R., J. Sandichem. Soc., 2005, 9, 2.
- Melson, G. A. and Figgis, B. N., “Transition Metal Chemistry”, Marcel Dekker, Inc. New York, 1982, Vol. 8.
- Charg, Y. R.; Mc. Pherson, G. L. and Atwood, J. L.,Inorg. Chem., 1979, 14, 3079.
- Chandra, S.; Gupta, L. K. and Shukla, D., J. Sandi. Chem. Soc., 2003, 7, 331.
- Chandra, S.; Shukla, D. and Gupta, L. K., J. Indian Chem. Soc., 2008, 85, 800.
- El-Baradie, K. Y.; Issa, R. M. and Gaber, M., Indian J. Chem., 2004, 43A, 1126.
- Ray, U. S.; Banerjee, D.; Mostafa, G.; Lu, T. H.; Sinha, C., New. J. Chem., 2004, 28, 1432.
- Nandi, S. N.; Roy, S.; Das. K.; Datta, A. and Sinha, C., J. Ind. Chem. Soc., 2016, 93, 1253.
Second Review by: Dr. Shamo Tapdiqov
Final Approval by: Dr. Mehmet Emin Argun


![]()


