Rheological study of orange honey with influence on concentration
Ioana Stanciu
University of Bucharest, Faculty of Chemistry, Department of Physical Chemistry, 4-12 Elisabeta Blvd, 030018, Bucharest, Romania.
Corresponding Author E-mail: Istanciu75@yahoo.com
DOI : http://dx.doi.org/10.13005/ojc/370413
Article Received on : 07 Jun 2021
Article Accepted on : 08 Jul 2021
Article Published : 12 Jul 2021
Reviewed by: Dr. C.Sagi Rani
Second Review by: Dr. Norida Binti Ridzuan
Final Approval by: Dr. Murathati poglu
The rheological behavior of orange honey was studied in the temperature range 25-45 degrees Celsius with Haake VT 550 viscometer when the HV1 viscosity sensor at high shear rates 3.3 and 1312s-1. The assortment of orange honey has a dilating behavior being influenced by concentration and humidity. Honey was studied with a humidity of 16%, 17%, 19% and 21%. The rheological behavior is influenced by both humidity and its composition.
KEYWORDS:Concentration; Orange Honey; Rheology
Download this article as:| Copy the following to cite this article: Stanciu I. Rheological study of orange honey with influence on concentration. Orient J Chem 2021;37(4). |
| Copy the following to cite this URL: Stanciu I. Rheological study of orange honey with influence on concentration. Orient J Chem 2021;37(4). Available from: https://bit.ly/3xyY2eI |
Introduction
There are many factors that influence the chemical composition of honey: the quality and composition of the raw material (nectar or manna), its abundance, climatic factors, how bees are exploited, how they are harvested, conditioned and preserved. The honey obtained will have specific characteristics to the conditions in which it was produced 1-14.
The elements that make up honey can be divided into three groups: water, sugars, non-sugars. The major constituents of honey are water and sugars, which represent 99% of honey.
Normally, honey harvested, processed and preserved in good conditions has a humidity between 17-18%. The nectar brought to the hive has a high water content (over 52%), but the filling is done only after the humidity is maximum 20%, the percentage of water in the honey being inversely proportional to the degree of filling of the combs. The high atmospheric humidity determines the increase of the humidity in the hive, as well as a high humidity of the honey, due to its hygroscopic properties.
Atmospheric humidity must not exceed 60% in storage rooms. Honey with a high glucose content (such as rapeseed) will be more hygroscopic and will have a shorter shelf life, having to be stored in airtight containers and stored in dry rooms. Honey with a subunit glucose / fructose ratio, (such as acacia or clover), can be intended for longer consumption. Crystallized honey is always more hygroscopic than fluid or liquid honey.
Honey can be considered a concentrated solution of sugars, due to the fact that the main components of honey are sugars:
Orange honey is produced from orange blossoms and has a special aroma, complete with special distinctive features15.
Material and methods
The orange honey used in this work is provided by Greece. Orange honey was studied with a viscometer Haake VT 550 when the HV1 viscosity sensor at temperatures between 25 and 45 degrees Celsius at shear rate 3 and 1312s-1 every 5 degrees on the entire range of shear speeds. The accuracy of the temperature was 0.1° C.
Results and discussion
In addition to temperature, another factor that can influence the viscosity of fluids is concentration. It is logical to think that an increase in the concentration of the dissolved or dispersed solid phase will lead to an increase, probably nonlinear, in the viscosity. Empirical relationships between viscosity and concentration have been established for several fluid systems. Thus, for a Newtonian fluid such as aqueous sucrose solutions, linear dependence was established:
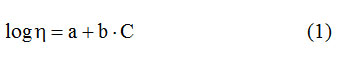
In this expression, C represents the percentage concentration of sucrose, and a and b are constants that can be determined either graphically (a being the intersection of the graph at the ordinate, and b is the slope of the graph) or by linear regression. The parameter a being the intersection of the graph on the ordinate is the very logarithm of the solvent concentration, log Cs, ie a = log Cs.
Taking into account the above, it appears that the dependence of the concentration viscosity is also a logarithmic dependence, which could be of the form:
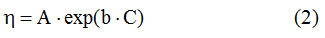
Logarithmizing this relation and substituting log A = a, will lead to obtaining the linear expression of the dependency η = f (C), described by relation (1).
Tabele 1: The influence moisture content on the viscosities of orange honey .
|
Moisture content (%) |
Viscosity (mPa . s) |
||||
|
25° C |
30° C |
35° C |
40° C |
45° C |
|
|
15.9 |
18.39 |
9.504 |
5.220 |
3.066 |
1.873 |
|
17.0 |
10.67 |
5.736 |
3.249 |
1.952 |
1.247 |
|
19.0 |
5.548 |
3.092 |
1.818 |
1.138 |
0.751 |
|
21.0 |
3.202 |
1.826 |
1.123 |
0.721 |
0.502 |
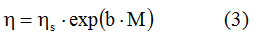
The experimental data in Table 1 regarding the influence moisture content on the viscosities of orange honey at allow the verification of the dependence described by relation (2). In the case of orange honey, C in relations (1) and (2) represents the moisture content expressed as a percentage, and a is the viscosity of honey in the absence of moisture in its composition. In the composition of honey, depending on its origin, there are variable amounts of: fructose, glucose, sucrose, trehalose, maltose, isomaltose, raffinose, erlose, panose, isomaltotriosis, maltotriosis, maltotetrosis. If we denote the moisture content with M, and the viscosity of the carbohydrates in honey in the absence of water with ηs, the expression (2) will have the form:
The linearization of the above relation with the data from table 1, allowed that from the graphical dependence, by linear regression to calculate the values of the constants ηs and b at the 5 temperatures used. The Origin 7.0 program was used, and the data obtained are those from table 2. Note the very high value of the linear correlation factor R, higher than 0.99 at all temperatures monitored.
It can also be seen that temperature has a linear influence on the value of the constant b. By linear regression applied to the dependence b = f (T), the following expression of linear dependence was obtained between the value of b and the temperature (° C):
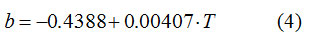
The correlation factor is excellent, R = 0.99887, so that the values of b can be estimated at any temperature in the range.
Table 2 shows that there is a nonlinear dependence ηs = f (T). The appearance of the graph suggests a logarithmic dependence. Considering an Arrhenius dependence of the form:
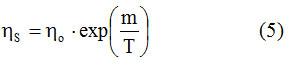
By linearizing it, the graph in Figure 1 is obtained. An excellent linear correlation factor is observed (R = 0.99986), which means that the dependence ηs = f (T) is excellently described by the Arrhenius type relation (5).
The dependence of the dynamic viscosity on temperature and concentration is described by equation (6) 16-19
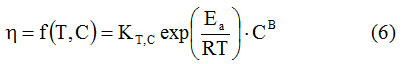
The three constants (KT, C, Ea, B) can be determined from the experimental data, by nonlinear regression.
Table 2: The influence of temperature on the constants s and b in the case of orange honey.
|
Temperature (°C) |
s (Pa . s) |
b |
R |
|
25 |
3520.1 |
-0.3362 |
0.9920 |
|
30 |
1366.3 |
-0.3176 |
0.9942 |
|
35 |
533.5 |
-0.2959 |
0.9936 |
|
40 |
237.3 |
-0.2783 |
0.9934 |
|
45 |
99.34 |
-0.2541 |
0.9931 |
 |
Figure 1: Linearization of the nonlinear dependence ηs = f (T) for the data in Table 1 in the case of orange honey. |
The dependence of the dynamic viscosity on temperature, concentration and shear rate is described by equation (7) 17:
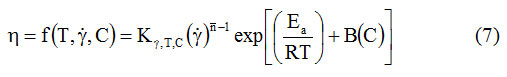
In this expression, the influence of shear rate is given in the form of the law of power. The value of the 4 parameters (K y, T, C, n, Ea, B) can be calculated with step regression analysis. This calculation procedure influences the size of the constants, and for this reason these constants cannot be assigned a precise physical significance.
Conclusions
Most varieties of honey are Newtonian fluids. Honey is a concentrated solution consisting mainly of fructose and glucose, with traces of other carbohydrates, proteins, minerals and other minor constituents. The water content of honey varies, depending on the assortment, between 17 – 20%. The dilating behavior (or shear thickening – which increase their viscosity when shearing) is characteristic of some varieties of honey.
References
- Germain I., Dufresne T., Ramaswamy H.S., 2006, Journal of Food Engineering, 73(1), 64-74.
CrossRef - Boussaid A., Chouaibi M., Rezig L., Missaoui R., Donsí F., Ferrari G., & Hamdi S., 2015. International journal of food properties, 18(12), 2624-2637.
CrossRef - Stanciu I., Journal of Science and Arts, 2018, 18(2), 453-458.
- Oroian M., Amariei S., Escriche I., & Gutt G., 2013. Food and bioprocess technology, 6(1), 228-241.
CrossRef - Eleya M.M.O. & Gunasekaran S., 2007, Rheology of fluid foods for dysphagic patients. In 3 rd International Symposium on Food Rheology and Structure, 221-224.
- Lazaridou A., Biliaderis C.G., Bacandritsos N. & Sabatini A.G., 2004, Journal of Food Engineering, 64(1), 9-21.
CrossRef - Strowd L., Kyzima J., Pillsbury D., Valley T., & Rubin B., 2008, Chest, 133(6), 1397-1401.
CrossRef - Yanniotis S., Skaltsi S., & Karaburnioti S., 2006, Journal of Food Engineering, 72(4), 372-377.
CrossRef - Stanciu I., 2011, Journal of Science and Arts, 1, 55-58.
- Escriche I., Tanleque-Alberto F., Visquert M., & Oroian M., 2017, LWT, 86, 108-115.
CrossRef - Adeleye B., & Rachal C., 2007, Journal of the American Dietetic Association, 107(7), 1176-1182.
CrossRef - Quinchia L.A., Delgado M., Reddyhoff A.T., Gallegos C., Spikes H.A., 2014, Tribology International, 69, 110–117.
CrossRef - Stanciu I., 2014, International Research Journal of Pure and Applied Chemistry, 531-540.
CrossRef - Schellart W.P., 2011, Journal of Structural Geology, 33(6), 1079-1088.
CrossRef - Stanciu I., 2013, Journal of Science and Arts, 4(25), 355-360.
CrossRef - Castaldo D., Palmieri L., Lo Voi A., Costabile P., 1990, J. Text. Stud., 21, 253-264
- Mackey K.L., Olofi R.Y., Morgan R.G., Steffe J.F., 1989, J. Food Proc. Engn., 12, 1-11
CrossRef - Stanciu I., 2015, Oriental Journal of Chemistry, 31(3), 1383-1387.
CrossRef - Stanciu I., 2015, Oriental Journal of Chemistry, 31(4), 2017-2023.
CrossRef

This work is licensed under a Creative Commons Attribution 4.0 International License.
About The Author
![]()
A New Edition of Web of Science
Journal Impact Factor
2022: 0.5
Five Year: 0.8
Journal is Indexed in

Cabells Whitelist
![]()


