Reverse Phase Chromatographic Method of Analysis for Assay and Content Uniformity Estimation of Drug Substance Sitagliptin, Metformin and Empagliflozin from Available Marketed Formulation
Gopal Mohanrao Kadam1, Avinash Laxmanrao Puyad1*, Tukaram Mohanrao Kalyankar2 and Rajeshwar Vishwanath Kshirsagar2
1School of chemical sciences, S.R.T.M. University, Nanded-431606
2School of Pharmacy, S. R. T. M. University, Nanded-431606.
Corresponding Author E-mail: avinashlpuyad@gmail.com
DOI : http://dx.doi.org/10.13005/ojc/370424
Article Received on : 04 Jun 2021
Article Accepted on : 05 Jul 2021
Article Published : 12 Jul 2021
Reviewed by: Dr. Faiz Bin Arith
Second Review by: Dr. K. Vanitha Prakash
Final Approval by: Dr. Wasinton Simanjuntak
A new method of analysis with reverse phase chemistry was designed and developed. Validation for method of analysis was performed for its intended use to calculate assay and content uniformity of drug substance sitagliptin, metformin and empagliflozin in the drug products. The method has a run time of 10 minutes on X-bridge C18 column having 250 mm length, 4.6 mm internal diameter and Particle Size of 5µm, by the use of 0.1% Trifluoroacetic acid Buffer 40%: Methanol 40%: Acetonitrile 20% ratio as constituent composition in the proposed mobile phase and chromatography run at wavelength of 224 nm. The retention time of Metformin, Empagliflozin and Sitagliptin, were 3.383, 5.571 and 6.429 minutes, respectively. International Conference on Harmonization guideline was referred for validation. The method showed adequate sensitivity for precision, linearity and accuracy parameter (between the range 25-75μg/mL, 250-750μg/mL and 2.5-7.5μg/mL for sitagliptin, metformin and empagliflozin respectively). The percentage recoveries obtained for sitagliptin, metformin and empagliflozin are in the range of 98.0 – 102.0 %. As results are within the acceptance [1], hence the new developed and proposed method is suitable for quantification of one, two or three component drugs, separately or in combination.
KEYWORDS:Content Uniformity; Empagliflozin; Metformin; Sitagliptin; RP-HPLC
Download this article as:| Copy the following to cite this article: Kadam G. M, Puyad A. L, Kalyankar T. M, Kshirsagar Rajeshwar V. K. Reverse Phase Chromatographic Method of Analysis for Assay and Content Uniformity Estimation of Drug Substance Sitagliptin, Metformin and Empagliflozin from Available Marketed Formulation. Orient J Chem 2021;37(4). |
| Copy the following to cite this URL: Kadam G. M, Puyad A. L, Kalyankar T. M, Kshirsagar Rajeshwar V. K. Reverse Phase Chromatographic Method of Analysis for Assay and Content Uniformity Estimation of Drug Substance Sitagliptin, Metformin and Empagliflozin from Available Marketed Formulation. Orient J Chem 2021;37(4). Available from: https://bit.ly/3i44xQd |
Introduction
Sitagliptin, metformin drugs are used to treat type 2 diabetes health issues, along with diet, exercise, and for overweight patients either alone or in combination with other types of oral hypoglycemic agents and empagliflozin drug is used in patients having type 2 diabetes along with diet and exercise. The drugs are taken either single or in combination with each other and are taken orally 2-3.
The chemical structures of sitagliptin, metformin and empagliflozin are as follows:
 |
Figure 1: representing the Structure of Sitagliptin. |
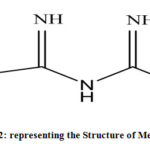 |
Figure 2: representing the Structure of Metformin. |
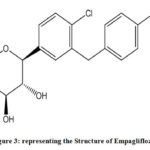 |
Figure 3: representing the Structure of Empagliflozin. |
Initially, trials were taken to optimize an analytical method for metformin and empagliflozin. A method of analysis with reversed-phase chemistry using high-performance liquid chromatographic instrument was designed to develop and calculate contents of metformin and empagliflozin by using INNO C18 column (4.6 mm internal diameter with 150 mm length and particle size of 5μm).The constituents in mobile phase mixture are pH 3.0 phosphate buffer 30 % and methanol 70% ratio at a constant flow in the instrument i.e.1.0 mL/minute and injection volume of 10 µL in the waters manufactured HPLC, with auto sampler and type of separation module 2695,with PDA detector 2996. Results for the developed method showed that there are no interfering peaks from blank solution at the specified retention time of metformin and empagliflozin. Retention time for metformin was observed at about 1.8 minute with tailing factor of not more than 2.0 & plate counts of more than 2000 and for empagliflozin was observed at about 2.7 minute with tailing factor not more than 2.0 & plate counts of more than 2000. A specific and simple RP-HPLC method was developed. As, metformin & empagliflozin are available in marketed formulation in single as well as in different combinations as empagliflozin tablets, metformin tablets, empagliflozin & metformin tablets, sitagliptin & metformin tablets. Hence, the research further continued by including one more drug substance sitagliptin. The aim was to achieve novelty in research by developing a new method for assay & content uniformity test for multicomponent analysis of drugs and for two tests (Assay and content uniformity).
Review of literature study done for development of a new method 4-10. From the literature study 11-19 as tabulated in table-1, it is observed that there are few methods available only for assay test determination of single or two drug components and single method for assay and content uniformity test is not available. To the best of our knowledge, it was observed that a single method to estimate three drug components for two tests i.e., assay and content uniformity (content of single dosage unit) test to estimate and calculate the drug substance sitagliptin, metformin and empagliflozin in the marketed drug product is not available. Hence, the research work was initiated for development and to validate a new, simple, accurate and economical method by RP-HPLC equipped with PDA detector. Sample preparation, diluent, and mobile phase in the proposed method is easy to prepare and economical and this method of analysis can be used for routine determination and calculation of drug components as well as to estimate stability batches analysis in quality control and research laboratory for assay and content uniformity calculation of drug substance sitagliptin, metformin and empagliflozin in available marketed drug product.
Table 1: Comparison of the method proposed by us with earlier reported methods.
|
Sr.No. |
Journal Name |
Reference No. |
Targeted research work |
Drug components |
|
1 |
International Journal of Applied Pharmaceutics, 2019, 11(5); 60-65 |
11 |
Assay |
Empagliflozin |
|
2 |
Asian Journal of Pharmacy and Technology,2019,9(3);208-211 |
12 |
Assay |
Empagliflozin |
|
3 |
Journal of Advanced Pharmacy Education and Research,2013,3(4);475-479 |
13 |
Assay |
Sitagliptin |
|
4 |
Indian journal of pharmaceutical sciences,2009,71;318-320 |
14 |
Assay |
Metformin |
|
5 |
International Research Journal of Pharmacy and Medical Sciences (IRJPMS), 2018, Volume 1, Issue 5;16-22 |
15 |
Assay |
Empagliflozin and Metformin |
|
6 |
World Journal of Pharmacy and Pharmaceutical Sciences, 2017, Vol. no. 6, Issue 9; 872-885 |
16 |
Assay |
Empagliflozin and Metformin |
|
7 |
International journal of science & research methodology, 2020, Vol.:15, Issue: 1; 110-121 |
17 |
Assay |
Sitagliptin and Metformin |
|
8 |
Orient Journal of Chemistry, 2012, Volume 28(1);463-469 |
18 |
Assay |
Sitagliptin and Metformin |
|
9 |
International Journal of Chem Tech Research,2018, 11;428-435 |
19 |
Assay |
Sitagliptin and Metformin |
|
10 |
Proposed method |
NA |
Assay & content uniformity |
Empagliflozin, Sitagliptin and Metformin |
Method development trials
Trials were performed to optimize a new HPLC method for multicomponent analysis and are summarized in below table 2. Chromatograms are shown in figure 4 & 5.
Table 2: Summary of method development trials
|
Trial No. |
Method details |
Observation & Conclusion |
|
1 |
Column: Phenomenex C18, 250*4.6mm, 5um Mobile phase: Phosphate Buffer 30%: Methanol 60%: Acetonitrile 10% ratio Flow of system: 1.0 mL/min Diluent: Water: Methanol (50:50) v/v |
Resolution between sitagliptin and empagliflozin is 0.90. As resolution is not achieved above 2.0, solvent acetonitrile to be removed in mobile phase to achieve separation. |
|
2 |
Column: Phenomenex C18, 250*4.6mm, 5um Mobile phase: Phosphate Buffer 30%: Methanol 70% ratio Flow of system: 1.0 mL/min Diluent: Water: Methanol (50:50) v/v |
Resolution between sitagliptin and empagliflozin is 1.49. As resolution is improved however not achieved above 2.0, column brand to be changed to check effect on separation. |
|
3 |
Column: X Bridge C18,250*4.6mm, 5um Mobile phase: Phosphate Buffer 30%: Methanol 70% ratio Flow of system: 1.0 mL/min Diluent: Water: Methanol (50:50) v/v |
Resolution between sitagliptin and empagliflozin is 1.46. As resolution is not improved by changing column, mobile phase buffer to be changed and composition to be increased to 40% in mobile phase to achieve resolution. |
|
4 |
Column: X Bridge C18,250*4.6mm, 5um Mobile phase: 0.1% Trifluoro acetic acid 40%: Methanol40%: Acetonitrile 10% ratio Flow of system: 1.0 mL/min Diluent: Water: Methanol (50:50) v/v |
Resolution between sitagliptin and empagliflozin is 4.04. Resolution is achieved however Sitagliptin retention time is 7.9 minutes & to achieve early elution, acetonitrile % to be increased to 20%. |
|
5 |
Column: X Bridge C18, 250*4.6mm, 5um Mobile phase: 0.1% Trifluoro acetic acid 40%: Methanol 40% : Acetonitrile 20% ratio Flow of system: 1.0 mL/min Diluent: Water: Methanol (50:50) v/v |
Resolution between sitagliptin and empagliflozin is 3.57. Resolution is achieved. All peaks are well separated. |
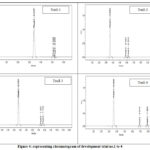 |
Figure 4: representing chromatogram of development trial no.1 to 4 |
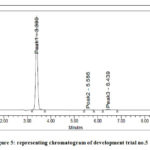 |
Figure 5: representing chromatogram of development trial no.5 |
Materials and methods
Chemicals and Reagents
Sitagliptin, metformin, empagliflozin standard and active pharmaceutical ingredients were received upon request from Fortune Pharma Lab., located at Hyderabad., India. The commercially available marketed drug product with the brand name Jardinance 10 mg (Empagliflozin 10 mg) and Istamet tablet 50mg/500 mg of strength (Sitagliptin-50 mg drug substance and Metformin-500 mg drug substance) purchased from the nearby local medical store. All solvents, chemicals and required reagents indented for this research work were of highly pure chromatographic i.e., pure grade water, methanol, acetonitrile, and trifluoroacetic acid was procured, manufactured by Merck.
Instrumentation
A Waters manufactured HPLC system type of model 2695 having photodiode array detector, inbuilt autosampler injector with Empower-2 qualified software was used. Weighing instrument, sonicator bath, oven for drying purpose was used for the experiments.
Chromatography of the method of analysis
Resolution and separations for three drug components was achieved on the X-Bridge C18 column, 250 mm length with 4.6 mm internal diameter and 5µm of Particle Size. The mobile phase mixture utilized to achieve resolution and separation to calculate content determination was 0.1% Trifluoroacetic acid Buffer 40%: Methanol 40%: Acetonitrile 20% at a flow of system 1.0 mL/minute and auto injection volume is 10μL. The inbuilt column oven of the system was maintained at ambient temperature, and the drugs were subjected for detection at fixed wavelength of 224 nm.
Mobile phase of method of analysis
Liquid mobile phase was prepared by inclusion and mixing 400 mL of 0.1% trifluoroacetic acid buffer, 400 mL methanol and 200 mL of acetonitrile (40:40:20 % ratio). The constituent mobile phase was subjected for sonication up to 15 minutes and filtered with filtration assembly by the use of 0.45μm membrane filter.
Diluent in the method of analysis
A composition of mixture in the volume 400 mL 0.1% trifluoroacetic acid buffer, 400 mL methanol and 200 mL of acetonitrile (40:40:20 % ratio) as a diluent in the method of analysis.
Standard stock solution of method of analysis
Precisely as well as carefully weighed, and transferred 50 mg of sitagliptin standard, 500 mg metformin standard and 5 mg of empagliflozin standard into a 50 mL previously dried and clean volumetric certified flask. Added a small quantity of diluent and subjected to sonication to dissolve the components in it completely and made volume of the flask up to the mark by diluent (1000 ppm of sitagliptin, 10000 ppm of metformin and 100 ppm of empagliflozin).
Standard solution of method of analysis
Further pipetted 2.5 mL of the above Sitagliptin, Metformin and Empagliflozin stock containing solution into 50 mL previously dried and clean volumetric certified flask and filled up to the line of flask with diluent. Mixed very well (50 ppm of sitagliptin,500 ppm of metformin and 5 ppm of empagliflozin).
Sample solution for assay method of analysis
Step1
Accurately weighed 10 tablets of Jardinance 10 mg (Empagliflozin 10 mg) formulation and crushed in mortar and pestle. Then transferred powder of tablet which is crushed, equivalent to the drug substance10 mg of Empagliflozin into 100 mL previously dried and clean volumetric certified flask. Added the diluent mixture to about 70 mL, and subjected to sonication for 30 minutes to extract the drug totally in the solution and made volume of the flask up to the line marked, with the diluent mixture. This solution was subjected to filtration through 0.45-micron PVDF type of syringe filter (100 ppm of empagliflozin, sample stock-1).
Step2
Precisely as well as carefully weighed 10 tablets of Istamet 50mg/500 mg (Sitagliptin-50 mg drug substance and Metformin-500 mg drug substance) formulation and crushed in mortar and pestle. Then transferred powder of tablet which is crushed, equivalent to the drug substance 50 mg of sitagliptin and drug substance 500 mg metformin into 50 mL previously dried and clean volumetric certified flask. Added the diluent mixture to about 35 mL, and subjected to sonication for 30 minutes to extract both the drug completely in the solution and made volume of the flask up to the line marked, with the diluent mixture. This solution was subjected to filtration through 0.45-micron PVDF type of syringe filter (1000 ppm of sitagliptin & 10000 ppm of metformin, sample stock -2).
Step3
Further pipetted 2.5 mL each of sample, stock -1 & stock -2 and then transferred into 50 mL clean and previously dried volumetric certified flask and made volume of the flask up to the line marked, with the diluent mixture and mixed well (50 ppm of sitagliptin,500 ppm of metformin and 5 ppm of empagliflozin).
Sample solution for content uniformity (the content of a single strength unit)
Step 1
Accurately weighed one tablet of Jardinance 10 mg (Empagliflozin 10 mg) formulation and transferred tablet into 100 mL previously dried and clean volumetric certified flask. Added the diluent mixture to about 70 mL, and subjected to sonication for 30 minutes to extract the drug totally in the solution and made volume of the flask up to the line marked, with the diluent mixture. This solution was subjected to filtration through 0.45-micron PVDF type of syringe filter (100 ppm of empagliflozin, Sample stock -1).
Step 2
Accurately weighed one tablet of Istamet 50mg/500 mg (Sitagliptin-50 mg drug substance and Metformin-500 mg drug substance) formulation and transferred into a 50 mL previously dried and clean volumetric certified flask. Added the diluent mixture to about 35 mL, and subjected to sonication for 30 minutes to extract both the drug totally in the solution and made volume of the flask up to the line marked, with the diluent mixture. This solution was subjected to filtration through 0.45-micron PVDF type of syringe filter (1000 ppm of sitagliptin & 10000 ppm of metformin, sample stock -2).
Step 3
Further pipetted 2.5 mL each of sample, stock -1 & stock -2 and then transferred into 50 mL clean and previously dried volumetric certified flask and made volume of the flask up to the line marked, with the diluent mixture and mixed well (50 ppm of sitagliptin,500 ppm of metformin and 5 ppm of empagliflozin).
Validation of chromatography method
The optimized and developed chromatography method was subjected to perform the validity of the method as per the guidelines available from ICH. The validation of the chromatography method was performed for system suitability, specificity of method, accuracy of method, precision of method, Intermediate precision of method, linearity of method, and robustness and detailed procedure is mentioned below with results.
System Suitability of method of analysis
The system suitability of method of analysis was confirmed by preparing and injecting standard solution of sitagliptin (50 μg/mL), metformin (500 μg/mL), and empagliflozin (5 μg/mL), and the solutions were subjected for injection into system six times and the parameters of chromatography like analyte retention time, analyte peak tailing, resolution between two components and USP criteria of plate count were noted.
Specificity of method of analysis
As mentioned in ICH stated guidelines, the term “Specificity” is the ability of the method of analysis to specifically separate or resolve the particular component or components of targeted drug substance analyte in the composition of other components or matrix.
Linearity of method of analysis
The stock solution containing standard of sitagliptin, metformin and empagliflozin, was made by using diluent mixture. From the stock solution containing standard, various levels of standard concentration solutions were made in the concentration range of 25-75μg/mL, 250-750 μg/mL and 2.5-7.5μg/mL for sitagliptin, metformin and empagliflozin respectively and injected into chromatography system. The calibration plot of linearity (peak area of analyte vs. concentration of drug substance) were created in calculation sheet by using analysis results (from number of readings and sets are 3) at specified concentrations of drug substance. The linearity of the method was subjected for evaluation with the least square calculation method by using calculation sheet.
Accuracy of method of analysis
The accuracy for proposed method of analysis was determined with addition of standard at three different predefined concentrations of drug substance in the method at 50%, 100% as well as 150%, and calculated for reporting purpose, the theoretical i.e., true value and found i.e., value obtained for comparison.
Precision of method of analysis
The precision for proposed method of analysis was confirmed from the peak area of drug substance, obtained by injecting six replicate samples prepared for sitagliptin (50 μg/mL), metformin (500 μg/mL), and empagliflozin (5 μg/mL). The intermediate precision of method of analysis was also carried out. The results obtained were calculated in calculation sheet for relative standard deviation i.e., % RSD of method.
Robustness method of analysis
The Robustness of method of analysis was checked and confirmed by changing small however deliberately changing in method of analysis parameters like flow of system (±0.1 ml/minute), organic phase ratio in composition of mobile phase (±10% of total volume). System suitability of method of analysis was checked.
Degradation check in the method of analysis
Specificity for method of analysis was confirmed by studying degradation in acid, base, peroxide, thermal, and UV stress conditions. The samples were exposed to the mentioned conditions and the peak obtained from the chromatography was checked for purity and demonstrated that the method is capable to resolve and separate all quantifiable degradation products in same chromatographic test method.
Acidic condition study
Further pipetted 2.5 mL each of sample stock -1 & sample stock -2 (empagliflozin, sitagliptin & metformin sample stock) and then transferred into a 50 mL clean and previously dried volumetric certified flask. Added 3.0 mL, 0.1N HCl and kept at room temperature for 24 hours. After 24 hours, refluxed for about 15 minutes at 60 ºC and allowed to cool at room temperature. This solution was subjected to neutralize with 3.0 mL, 0.1N NaOH and diluted up to the marked line with diluent mixture. As a final step, this solution was subjected to filtration through 0.45-micron PVDF type of syringe filter (50 ppm of sitagliptin,500 ppm of metformin and 5 ppm of empagliflozin).
Alkaline condition study
Further pipetted 2.5 mL each of sample stock -1 & sample stock -2 (empagliflozin, sitagliptin & metformin sample stock) and then transferred into a 50 mL clean and previously dried volumetric certified flask. Added 3.0 mL, 0.1N NaOH and kept at room temperature for 24 hours. After 24 hours, refluxed for about 15 minutes at 60 ºC and allowed to cool at room temperature. This solution was subjected to neutralize with 3.0 mL, 0.1N HCl and diluted up to the marked line with diluent mixture. As a final step, this solution was subjected to filtration through 0.45-micron PVDF type of syringe filter (50 ppm of sitagliptin,500 ppm of metformin and 5 ppm of empagliflozin).
Oxidative degradation
Further pipetted 2.5 mL each of sample stock -1 & sample stock -2 (empagliflozin, sitagliptin & metformin sample stock) and then transferred into a 50 mL clean and previously dried volumetric certified flask. Added 3 mL 1% H2O2 solution and kept at room temperature for 24 hours. After 24 hours, diluted up to the mark with diluent. As a final step, this solution was subjected to filtration through 0.45-micron PVDF type of syringe filter (50 ppm of sitagliptin,500 ppm of metformin and 5 ppm of empagliflozin).
Thermal degradation
Sitagliptin, metformin and empagliflozin samples were placed in uniform way in petri plate and subjected for heating at 1100 C (in oven) for 24 hours.
Photolytic degradation:
The photostability nature of the drug substance in the drug product was studied by exposure of the sample to direct sunlight light up to 12 hours.
Further pipetted 2.5 mL each of sample, stock -1 & stock -2 and then transferred into 50 mL clean and previously dried volumetric certified flask and made volume of the flask up to the line marked, with the diluent mixture and mixed well (50 ppm of sitagliptin,500 ppm of metformin and 5 ppm of empagliflozin).
Results and discussion for method validation parameters
Validation of method of analysis is completed to show for its intended use and to establish quality characteristics of the developed method of analysis, meet the predefined acceptance of the targeted analytical test method. Validation of method of analysis was completed referring ICH published Q2 guideline. In this section, results of all parameters are tabulated and observations are noted.
Suitability of method of analysis
suitability of method of analysis was achieved by evaluation of the parameters like tailing of analyte, theoretical plates, resolution between peaks, and % RSD of injections from multiple injections. The values obtained, shows acceptable results and are tabulated in tables 3, 4, 5 and 6. Chromatogram of standard solution is shown in figure 6.
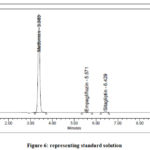 |
Figure 6: representing standard solution. |
Table 3: Results of system suitability from standard solution injection.
|
No. |
Analyte name |
Concen-tration (ppm) |
Analyte Rt |
Analyte Area |
Analyte plate count |
Analyte Tailing |
Resolution between analytes |
|
1 |
Sitagliptin |
50 |
6.415 |
152877 |
10112 |
0.96 |
3.64 |
|
2 |
Metformin |
500 |
3.383 |
10893692 |
8328 |
1.02 |
NA |
|
3 |
Empagliflozin |
5 |
5.564 |
32258 |
11141 |
1.06 |
12.11 |
Table 4: Results of system suitability from standard solution injections for sitagliptin
|
Analyte name: Sitagliptin |
|||||
|
No. |
Analyte Rt |
Analyte Area |
Analyte plate count |
Analyte Tailing |
Resolution between analytes |
|
1 |
6.415 |
152877 |
10112 |
0.96 |
3.64 |
|
2 |
6.417 |
151496 |
10166 |
0.95 |
3.63 |
|
3 |
6.421 |
159298 |
10172 |
0.95 |
3.65 |
|
4 |
6.429 |
155765 |
10393 |
0.94 |
3.62 |
|
5 |
6.430 |
155944 |
10530 |
0.93 |
3.62 |
|
6 |
6.444 |
156039 |
10847 |
0.90 |
3.71 |
|
Mean |
155236 |
||||
|
Std. Dev. |
2737.9 |
||||
|
%RSD |
1.7 |
||||
Table 5: Results of system suitability from standard solution injections for drug substance Metformin
|
Analyte name: Metformin |
||||
|
No. |
Analyte Rt |
Analyte Area |
Analyte plate count |
Analyte Tailing |
|
1 |
3.383 |
10893692 |
8328 |
1.02 |
|
2 |
3.383 |
10919204 |
8273 |
1.02 |
|
3 |
3.383 |
10879621 |
8224 |
1.01 |
|
4 |
3.385 |
10886278 |
8212 |
1.02 |
|
5 |
3.385 |
10883289 |
8344 |
1.02 |
|
6 |
3.386 |
10916881 |
8586 |
1.04 |
|
Mean |
10896494 |
|
||
|
Std. Dev. |
65378965.3 |
|
||
|
%RSD |
0.2 |
|||
Table 6: Results of system suitability from standard solution injections for drug substance empagliflozin.
|
Analyte name: Empagliflozin |
|||||
|
No. |
Analyte Rt |
Analyte Area |
Analyte plate count |
Analyte Tailing |
Resolution between analytes |
|
1 |
5.564 |
32258 |
11141 |
1.06 |
12.11 |
|
2 |
5.565 |
32931 |
11308 |
1.04 |
12.22 |
|
3 |
5.568 |
32801 |
11291 |
1.06 |
12.18 |
|
4 |
5.571 |
32919 |
10870 |
1.03 |
11.91 |
|
5 |
5.578 |
33990 |
11213 |
1.04 |
12.07 |
|
6 |
5.579 |
32507 |
11203 |
1.03 |
12.04 |
|
Mean |
32901 |
|
|||
|
Std. Dev. |
594.7 |
||||
|
%RSD |
1.8 |
||||
Specificity
Any interfering peaks, from blank solution at retention times of sitagliptin, metformin and empagliflozin retention time are not observed in this method. Hence, this method was proved to be specific.
Retention times of metformin, empagliflozin, and sitagliptin, were 3.383, 5.571 and 6.429 minutes for standard solution and 3.385, 5.579 and 6.444 minutes for sample solution respectively.
 |
Figure 7: representing blank (diluent). |
 |
Figure 8: representing standard. |
 |
Figure 9: representing sample. |
Linearity of method of analysis
The linearity of method of analysis was subjected to evaluate at different range of concentration (50 % to 150 %) against standard level of sitagliptin, metformin and empagliflozin.
The calibration plot of linearity (peak area of analyte vs. concentration of drug substance in µg/mL) was created in calculation sheet by analysis results obtained (from number of reading and sets are 3) at specified concentration of drug substance.
R2 value for sitagliptin, metformin and empagliflozin was calculated and observed 0.9992, 0.9994 and 0.9997 respectively. The summary of the results, is tabulated in tables 7, 8 and 9 and shown in Fig. 10, 11, 12 & 13.
Table 7: Linearity results for sitagliptin
|
S.No. |
Linearity Level |
Standard stock solution taken (µL) |
Diluted volume up to mark (mL) |
Concentration (ppm) |
Area |
|
1 |
50 % |
1250 |
50 |
25.0 |
87438 |
|
2 |
75 % |
1875 |
50 |
37.5 |
134113 |
|
3 |
100 % |
2500 |
50 |
50.0 |
181266 |
|
4 |
125 % |
3125 |
50 |
62.5 |
230245 |
|
5 |
150 % |
3750 |
50 |
75.0 |
273289 |
|
Correlation Coefficient |
0.999 |
||||
 |
Figure 10: Calibration Graph for Sitagliptin Click here to View figure |
Table 8: Linearity results for metformin
|
S. No. |
Linearity Level |
Standard stock solution taken (µL) |
Diluted volume up to mark (mL) |
Concentration (ppm) |
Area |
|
1 |
50 % |
1250 |
50 |
250 |
5533712 |
|
2 |
75 % |
1875 |
50 |
375 |
8409615 |
|
3 |
100 % |
2500 |
50 |
500 |
11221992 |
|
4 |
125 % |
3125 |
50 |
625 |
13768045 |
|
5 |
150 % |
3750 |
50 |
750 |
16898907 |
|
Correlation Coefficient |
0.999 |
||||
 |
Figure 11: Calibration Graph for Metformin. |
Table 9: Linearity results for empagliflozin
|
S. No. |
Linearity Level |
Standard stock solution taken (µL) |
Diluted volume up to mark (mL) |
Concentration (ppm) |
Area |
|
1 |
50 % |
1250 |
50 |
2.5 |
17070 |
|
2 |
75 % |
1875 |
50 |
3.8 |
24837 |
|
3 |
100 % |
2500 |
50 |
5.0 |
33671 |
|
4 |
125 % |
3125 |
50 |
6.3 |
42017 |
|
5 |
150 % |
3750 |
50 |
7.5 |
51023 |
|
Correlation Coefficient |
0.999 |
||||
 |
Figure 12: Calibration Graph for Empagliflozin Click here to View figure |
 |
Figure 13: Overlay of Linearity levels. |
Accuracy of method of analysis
To check the accuracy of method of analysis, analysis was carried at three multiple levels, 50 %, 100 %, 150%. Percentage accuracy in terms of recovery was calculated, and the result values obtained are noted in table as below 10, 11 and 12.
Table 10: representing accuracy values, Sitagliptin
|
Concentration in % (Specification Level) |
Analyte Area |
Drug substance Added (ppm) |
Drug substance Amount obtained (ppm) |
Recovery in % |
Recovery (Avg.) |
|
50 % Set 1 |
78762 |
25.00 |
25.37 |
101.47 |
101.14 |
|
50 % Set 2 |
78112 |
25.00 |
25.16 |
100.64 |
|
|
50 % Set 3 |
78639 |
25.00 |
25.33 |
101.32 |
|
|
100 % Set 1 |
159298 |
50.00 |
51.31 |
102.62 |
101.14 |
|
100 % Set 2 |
155765 |
50.00 |
50.17 |
100.34 |
|
|
100 % Set 3 |
155944 |
50.00 |
50.23 |
100.46 |
|
|
150 % Set 1 |
233730 |
75.00 |
75.28 |
100.38 |
100.58 |
|
150 % Set 2 |
233289 |
75.00 |
75.14 |
100.19 |
|
|
150 % Set 3 |
235628 |
75.00 |
75.89 |
101.19 |
Table 11: representing accuracy results, Metformin
|
Concentration in % (Specification Level) |
Analyte Area |
Drug substance Added (ppm) |
Drug substance Amount obtained (ppm) |
Recovery in % |
Recovery (Avg.) |
|
50 % Set 1 |
5401809 |
250.00 |
247.87 |
99.15 |
99.49 |
|
50 % Set 2 |
5426824 |
250.00 |
249.02 |
99.61 |
|
|
50 % Set 3 |
5432191 |
250.00 |
249.26 |
99.71 |
|
|
100 % Set 1 |
10919204 |
500.00 |
501.04 |
100.21 |
100.08 |
|
100 % Set 2 |
10879621 |
500.00 |
499.23 |
99.85 |
|
|
100 % Set 3 |
10916881 |
500.00 |
500.94 |
100.19 |
|
|
150 % Set 1 |
16098907 |
750.00 |
738.72 |
98.50 |
98.39 |
|
150 % Set 2 |
16055545 |
750.00 |
736.73 |
98.23 |
|
|
150 % Set 3 |
16088046 |
750.00 |
738.22 |
98.43 |
Table 12: representing accuracy results, Empagliflozin
|
Concentration in % (Specification Level) |
Analyte Area |
Drug substance Added (ppm) |
Drug substance Amount obtained (ppm) |
Recovery in % |
Recovery (Avg.) |
|
50 % Set 1 |
16665 |
2.50 |
2.53 |
101.30 |
100.94 |
|
50 % Set 2 |
16411 |
2.50 |
2.49 |
99.76 |
|
|
50 % Set 3 |
16738 |
2.50 |
2.54 |
101.75 |
|
|
100 % Set 1 |
32258 |
5.00 |
4.90 |
98.05 |
101.48 |
|
100 % Set 2 |
33919 |
5.00 |
5.15 |
103.09 |
|
|
100 % Set 3 |
33990 |
5.00 |
5.17 |
103.31 |
|
|
150 % Set 1 |
49023 |
7.50 |
7.45 |
99.33 |
99.62 |
|
150 % Set 2 |
49090 |
7.50 |
7.46 |
99.47 |
|
|
150 % Set 3 |
49386 |
7.50 |
7.51 |
100.07 |
Method precision & intermediate precision
Parameter was performed to check performance of method. Six samples at a concentration of 50 μg/mL of sitagliptin, 500 μg/mL of metformin and 5 μg/mL of empagliflozin are injected. The values tabulated in tables 13, 14, 15, 16, 17 and 18 % RSD results observed below are noted.
Table 13: representing repeatability values (Method precision), Sitagliptin
|
No. |
Analyte Rt |
Analyte Area |
Analyte plate count |
Analyte Tailing |
Resolution between analytes |
|
1 |
6.391 |
176519 |
9699 |
1.03 |
3.54 |
|
2 |
6.400 |
176202 |
9704 |
1.01 |
3.56 |
|
3 |
6.407 |
178059 |
9742 |
1.03 |
3.53 |
|
4 |
6.407 |
178530 |
9678 |
1.03 |
3.55 |
|
5 |
6.412 |
176142 |
9743 |
1.02 |
3.57 |
|
6 |
6.420 |
178382 |
9589 |
1.03 |
3.56 |
|
Avg |
177306 |
||||
|
Std. Dev |
1132.79 |
||||
|
% RSD |
0.6 |
|
|||
Table 14: representing repeatability values (Method precision), Metformin
|
No. |
Analyte Rt |
Analyte Area |
Analyte plate count |
Analyte Tailing |
|
1 |
3.381 |
10884334 |
8594 |
1.02 |
|
2 |
3.382 |
10990504 |
8500 |
1.02 |
|
3 |
3.382 |
11000201 |
8461 |
1.02 |
|
4 |
3.382 |
10989075 |
8515 |
1.03 |
|
5 |
3.382 |
10926237 |
8566 |
1.02 |
|
6 |
3.383 |
10952941 |
8519 |
1.03 |
|
Mean |
10957215 |
|||
|
Std. Dev |
45300.24 |
|||
|
% RSD |
0.4 |
|||
Table 15: representing repeatability values (Method precision), Empagliflozin
|
No. |
Analyte Rt |
Analyte Area |
Analyte plate count |
Analyte Tailing |
Resolution between analytes |
|
1 |
5.552 |
32186 |
11492 |
1.06 |
12.26 |
|
2 |
5.555 |
32232 |
11698 |
1.05 |
12.16 |
|
3 |
5.556 |
32493 |
11648 |
1.01 |
12.11 |
|
4 |
5.559 |
32894 |
11549 |
1.04 |
12.07 |
|
5 |
5.563 |
33063 |
11461 |
1.04 |
12.25 |
|
6 |
5.568 |
33164 |
11186 |
1.07 |
12.21 |
|
Avg |
32672 |
||||
|
Std. Dev |
425.69 |
||||
|
% RSD |
1.3 |
||||
Table 16 representing repeatability values (Intermediate precision), Sitagliptin
|
No. |
Analyte Rt |
Analyte Area |
Analyte plate count |
Analyte Tailing |
Resolution between analytes |
|
1 |
6.415 |
152877 |
10112 |
0.96 |
3.64 |
|
2 |
6.417 |
151496 |
10166 |
0.95 |
3.63 |
|
3 |
6.421 |
159298 |
10172 |
0.95 |
3.65 |
|
4 |
6.429 |
155765 |
10393 |
0.94 |
3.62 |
|
5 |
6.430 |
155944 |
10530 |
0.93 |
3.62 |
|
6 |
6.444 |
156039 |
10847 |
0.90 |
3.71 |
|
Avg |
155236 |
|
|||
|
Std. Dev |
2737.9 |
||||
|
% RSD |
1.8 |
||||
Table 17: representing repeatability values (Intermediate precision), Metformin
|
No. |
Analyte Rt |
Analyte Area |
Analyte plate count |
Analyte Tailing |
|
1 |
3.383 |
10893692 |
8328 |
1.02 |
|
2 |
3.383 |
10919204 |
8273 |
1.02 |
|
3 |
3.383 |
10879621 |
8224 |
1.01 |
|
4 |
3.385 |
10886278 |
8212 |
1.02 |
|
5 |
3.385 |
10883289 |
8344 |
1.02 |
|
6 |
3.386 |
10916881 |
8586 |
1.04 |
|
Mean |
10896494.2 |
|
||
|
Std. Dev |
17335.87 |
|||
|
% RSD |
0.2 |
|||
Table 18: representing repeatability values (Intermediate precision), Empagliflozin
|
No. |
Analyte Rt |
Analyte Area |
Analyte plate count |
Analyte Tailing |
Resolution between analytes |
|
1 |
5.564 |
33258 |
11141 |
1.06 |
12.11 |
|
2 |
5.565 |
33931 |
11308 |
1.04 |
12.22 |
|
3 |
5.568 |
33801 |
11291 |
1.06 |
12.18 |
|
4 |
5.571 |
33919 |
10870 |
1.03 |
11.91 |
|
5 |
5.578 |
33990 |
11213 |
1.04 |
12.07 |
|
6 |
5.579 |
33507 |
11203 |
1.03 |
12.04 |
|
Avg |
33734 |
||||
|
Std. Dev |
290.23 |
|
|||
|
% RSD |
0.9 |
||||
Robustness of method of analysis
The robustness is studied to check, flow of system (± 0.1 mL/minute) and solvent mixture composition (± 10%), and its effect on the area, tailing, and plate count. The results are tabulated in tables 19, 20 and 21.
Table 19: representing robustness, Sitagliptin
|
Parameter evaluation |
Analyte Area |
Analyte Rt |
Analyte plate count |
Analyte Tailing |
Resolution between analytes |
|
Less Flow in the system, 0.9 mL/minute |
206052 |
7.103 |
10168 |
1.01 |
3.63 |
|
Actual Flow in the system, 1.0 mL/minute |
152877 |
6.415 |
10112 |
0.96 |
3.64 |
|
More Flow in the system, 1.1 mL/minute |
169796 |
5.833 |
9183 |
1.02 |
3.49 |
|
Less organic phase |
205002 |
7.003 |
10158 |
1.01 |
3.61 |
|
More organic phase |
168790 |
5.840 |
9145 |
1.02 |
3.42 |
Table 20: representing robustness, Metformin
|
Parameter evaluation |
Analyte Area |
Analyte Rt |
Analyte plate count |
Analyte Tailing |
|
Actual Flow rate of 0.9 mL/minute |
12619965 |
3.746 |
9160 |
1.03 |
|
Less Flow rate of 1.0 mL/minute |
10893692 |
3.383 |
8238 |
1.02 |
|
More Flow rate of 1.1 mL/minute |
10173220 |
3.078 |
8548 |
1.02 |
|
Less organic phase |
12629865 |
3.741 |
9142 |
1.01 |
|
More organic phase |
10172520 |
3.072 |
8531 |
1.02 |
Table 21: representing robustness, Empagliflozin
|
Parameter evaluation |
Analyte Area |
Analyte Rt |
Analyte plate count |
Analyte Tailing |
Resolution between analytes |
|
Less Flow rate of 0.9 mL/minute |
39137 |
6.164 |
11774 |
1.02 |
12.38 |
|
Actual Flow rate of 1.0 mL/minute |
32258 |
5.564 |
11141 |
1.06 |
12.11 |
|
More Flow rate of 1.1 mL/minute |
30696 |
5.056 |
11089 |
0.98 |
11.96 |
|
Less organic phase |
39047 |
6.154 |
11572 |
1.02 |
12.23 |
|
More organic phase |
30196 |
5.013 |
11007 |
0.99 |
12.01 |
All system suitability parameters are within the pre-defined acceptance criteria and there is no much shift in retention time for deliberately changed parameters as compared to the parameters in as such method. From the results obtained, it is proved method is robust.
Degradation observations
As no interference in blank and at degradant peaks, results showed purity of sitagliptin, metformin and empagliflozin drug substances, and hence method of analysis is specific and stability-indicating. The values are summarized in below table 22.
Table 22: representing values of forced degradation studies-sitagliptin, metformin & empagliflozin.
|
Sr.No. |
Stress parameter |
Stress Condition |
Degradation by Area % |
Peak Purity |
|
1 |
Standard |
NA |
NA |
Passes |
|
2 |
Acidic |
0.1 N, HCl 24 hours |
0.19 |
Passes |
|
3 |
Basic |
0.1 N, NaOH 24 hours |
1.60 |
Passes |
|
4 |
Oxidative |
1 %, H2O2 24 hours |
2.26 |
Passes |
|
5 |
Thermal |
110°C, 24 hours |
2.40 |
Passes |
|
6 |
Photolytic |
Sunlight, 12 hours |
2.69 |
Passes |
The three drug components, when exposed to above mentioned stress degradation conditions showed less degradation even for harsh degradation conditions and proved stability indicating nature to perform stability studies in the proposed method.
Advantages
Advantages of the new proposed, developed and validated method are, Other reported methods determine only assay, however our new method determines assay and content uniformity (content of single dosage unit). As assay and content of a single unit can be determined in a single analysis, correlation of result between content of sample matrix from the whole as well as a single unit can be determined. This data is useful in the evaluation of manufactured batches.
Conclusion
A new method of analysis with reverse phase chemistry was designed and developed to calculate assay and content uniformity of sitagliptin, metformin and empagliflozin pharmaceuticals. The method of analysis was validated for specified test parameters as mentioned in ICH published guidelines. From validation data and results obtained, it can be concluded that the target of developing a common chromatographic method for assay and content uniformity test has been achieved. This specific, economical, and efficient method can be used to estimate sitagliptin, metformin and empagliflozin as individual components as well as in combination in pharmaceuticals.
Acknowledgement
The researchers express their thankfulness to Fortune Pharma Lab., located at Hyderabad, India for supplying samples.
References
- Garcia, P.; Buffoni, E.; Gomes, F.; Vilchez, J. Analytical Method Validation, 2011, DOI, 10.5772/21187.
- Erin, L.; Shannon, M.; Elizabeth, C. Pharmacy and Therapeutics, 2012, 37(12),699-708.
- Uche, A.; Nicole, O.; Efrah, B.; Angie, T. Pharmacy and Therapeutics, 2015, 40(6),364-368.
- Gabor, S. HPLC in pharmaceutical Analysis, 1991, I ,101-173. London: CRC Press.
- Hobart, H.W.; Merritt L.L.; John, A.D. Instrumental Methods of Analysis,1998, 7th Ed. 580-610.CBS Publishers, New Delhi.
- Sharma, B.K. Instrumental Method of Chemical Analysis,2001, 20th Ed., 54-83. Goel Publishing House, Meerut.
- Kar, A. Pharmaceutical Drug Analysis,2005, 2nd Ed., 455-466. New Age International Publisher, New Delhi.
- Snyder, L.R.; Kirkland, J.L.; Glajch, J.L. Practical HPLC Method Development,1997, 3rd Ed., 227.Wiley, New York.
CrossRef - Skoog, D.A.; West, D.M. Principles of Instrumental Analysis,1980, 2nd Ed., 674-675, 690-696.Saunders Golden Sunburst Series, Philadelphia.
- Validation of Analytical Procedure: Text and Methodology, Q2(R1). ICH Guidelines, 2005.
- Basak, M.; Gouru S.R.; Bera A.; Nagappan, K.V. International Journal of Applied Pharmaceutics, 2019,11(5), 60-65.
CrossRef - Sridevi, M.P.; Kumar, H.T.; Rao, S.Y.; Rao, V.P. Asian J. Pharm. Tech., 2018,9(3),208-211.
CrossRef - Lavanya, R.; Yunoos, Md. J. Adv. Pharm. Edu. & Res., 2013,3(4), 475- 479.
- Kar, M.; Choudhury, P.K. Indian journal of pharmaceutical sciences,2009, 71, 318-320.
CrossRef - Vinay, K.D.; Seshagiri, R.J. International Research Journal of Pharmacy and Medical Sciences (IRJPMS),2018, Volume 1, Issue 5,16-22.
- Patel, A.M.; Chaudhary, A.B. World Journal of Pharmacy and Pharmaceutical Sciences,2017, Vol 6, Issue 9, 872-885.
crossRef - Odela, M; Manohar, K. R. International journal of science & research methodology,2020, Vol.15, Issue 1, 110-121.
- Bhende, S.D.; Varanasi, M.B.; Abbulu, K; Swetha, M.D.; Shravanthi, V.; Kumari, J.K.; Shayamala, T. Orient Journal of Chemistry, Volume.2012, 28(1),463-469.
CrossRef - Adsul, S.; Bidkar, J.; Harer, S.; Dama, G. International Journal of Chem Tech Research,2018, 11,428-435.
CrossRef

This work is licensed under a Creative Commons Attribution 4.0 International License.
About The Author
![]()
A New Edition of Web of Science
Journal Impact Factor
2022: 0.5
Five Year: 0.8
Journal is Indexed in

Cabells Whitelist
![]()


