New Reagent of Coupling Reaction for Spectrophotometric Determination of Paracetamol in Pharmaceutics
Kurdistan F. Azeez , Tara F. Tahir* and Dashne M. Kokhasmail
Department of Chemistry, Faculty of Science and Health,Koya University, Koya KOY45, Kurdistan Region - F.R.Iraq.
DOI : http://dx.doi.org/10.13005/ojc/370416
Download this article as:
![]()
New reagent 2- hydroxybenzaldehydewas used in a coupling reaction for determination of paracetamol via spectrophotometric method. The proposition of simplicity, inexpensive, rapidity and sensitivity were conducted via spectrophotometric procedure. The method was based on diazotization of paracetamol and coupling with 2-hydroxybenzaldehyde in alkaline medium. Linear concentration range (0.50 - 12.00) µg/ml was comply Beer’s law at maximum wavelength 444 nm and detection limit (LOD) 0.05 µg/ml. The molar absorptivity and regression coefficient of (R2) were 1.2032×10⁴ l/mol.cm, 0.9995, respectively. The suggested method was profitablyadapted for the determination of paracetamol in pharmaceutics. The results attained were in good agreement with thatone by standard method high performance liquid chromatography (HPLC).
KEYWORDS:Azo Dyes; Coupling Reaction; 2-Hydroxybenzaldehyde; Paracetamol; Spectrophotometric Method
Introduction
The most common analgesic and antipyretic compound have been used in therapy is paracetamol, since 1950. Paracetamol is considered as one of the crucial human medicine that has therapeutic properties as well as it causes hepatotoxicity when it is overdosed, and this has confirmed by WHO 1.
Poisoning byparacetamol is likelyvirulent. The essential source of cytolytic hepatitis is N-acetyl-p-benzoquinone-imine (NAPQI), which is a harmful metabolite of paracetamol, that is leading to dose-dependent hepatocyte necrosis and death in many countries2,3.
High performance liquid chromatography (HPLC) is the most periodically technique used for evaluation of paracetamol in pharmaceutics, however still spectrophotometer technique is very popular in this field4. Hyphenated techniques such as chromatographic HPLC method with UV or MS are specific and sensitive technique but they are taking more time in the analysis and more costly5,6. UV-visible spectrophotometer has been used for direct and indirect determination of paracetamol based mainly on a coloured product resulted from the reaction of chromogenic reagent with paracetamol. There are other visible spectrophotometric methods in which paracetamol submitted to specific reactions to produce a coloured derivative directly, or sometimes indirectly. A few of these methods encloselaborious steps such as extraction, heating, and pH controlling7. Azo coupling reaction is the most prominent visible spectrophotometric methods for determination of paracetamoland its derivative (para aminophenol). Their attractivity is related to the ease of preparation and fast production, besides their wide range of shades 8.
This work is to optimize and endorse a UV-Visible spectrophotometric method based on a new azo reaction for determination of paracetamol in pharmaceutics, that feasible in the situation of limited resources in laboratories.
Materials and methods
Instrumentation
Agilent Technologies Cary Series,UV/visible spectrophotometer, double beam is used and equipped with a glass cell of a 1-cm optical path.Agilent 1100 HPLC instrumentregulated by a system of ChemStation Data witha quaternary pump G1311A and VWD-G1314 A of UV detector. The operation condition of the last system is a C18 column reverse phase of 300 mm × 4.6 mm, 5 μm). Trifluoroacetic acid (0.1 % v/v) and acetonitrile are used as mobile phase with ratio (80:20 v/v).
Chemicals and reagents
Acetic acid %99.9 (CH3COOH), methanol %99.7 (CH3OH) and sulfuric acid %98 (H2SO4) from Merk.Calcium carbonate (CaCO3) %98 and 2-hydroxy benzaldehyde (C7H6O2) %99.9 from Sigma Aldrich.Potassium hydroxide %85 (KOH), sodium nitrite %99.5 (NaNO2) and sodium carbonate %99.5 (Na2CO3) from Riedel-De Haen AG. Hydrochloric acid %36.5 (HCl) from E.U. Magnesium stearate %99 Mg(C18H35O2)2 from BDH. Nitric acid %70 (HNO3) from Scharlau.Sodium hydroxide (NaOH) from SCP and starch from Difco.Pure paracetamol standard %99.99 from Awamedica-Erbil/Iraq.
Preparation of reagents and standard stock solution
2-Hydroxybenzaldehyde, 1.0% (w/v) in methanol.Sodium nitrite, 1.0% (w/v) aqueous solution.Hydrochloric acid, (0.1, 4M) aqueous solution, individually.Sodium hydroxide, 1.0% (w/v) aqueous solution.Starch, 0.1% (w/v) hot aqueous solution. 0.1% (w/v) calcium carbonate, in 0.1 M hydrochloric acid aqueous solution. Magnesium stearate, 0.1% (w/v) in a mixture of ether (50 ml), nitric acid (20 ml)and distilled water (20 ml). The mixture is refluxed until it is completely dissolved, then cool down. 0.25 g of standard paracetamol powder is refluxed with 20ml HCl(4M) and distilled water (30ml) of for 30minutes to prepare 5000µg/ml working standard solution of paracetamol9.
Preparation of samples
Pharmaceutical products of threevarious brands (each one contains 500 mg paracetamol) are weighed and grind into a fine powder then mix thoroughly. Powder mixture that contains0.0664g powder Piodol (Pioneer-Iraq/Sulaymaniyah), 0.0613g powder Paracetol(M.D.I-Iraq/Baghdad) and 0.0599 g Parazar (Awamedica- Iraq/ Erbil) of paracetamolareweighed accurately, then mixed with 20ml HCl(4M), distilled water(30ml)and mixed for 10 min. The mixture is filtered using filter-paper (Whatman No.41), to remove insoluble and is washed with methanol. The filtrate and the washing solutionare diluted with distilled water into 50 ml volumetric flask10.
Methods
Performing procedure is based on azo dyes method, which comprises two steps; first step is formation of a diazonium salt, and the second step is coupling reaction of the resulted diazonium salt with a coupling agent8.
The operating method is as follows: 1.0 ml hydrochloric acid (0.1 M) is added into 10 ml volumetric flask that is contained 1.5 ml sodium nitrite (1.0%). After stirring, the prepared paracetamol solution is added to the mixture at temperature below 5 ºC in ice bath. After shaking for 2 min, 1.0 ml sodium hydroxide (1.0%)are poured followed by 1.0 ml 2-hyrdoxybanzaldehyde(1.0%)while mixing in the ice bath. The yellow colour gained is recorded at 444 nm vsthe blank reagent of hydrochloric acid, sodium nitrite, sodium hydroxide and 2-hyrdoxybanzaldehydemixture (Scheme 1).
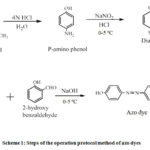 |
Scheme 1: Steps of the operation protocol method of azo dyes. |
The spectrum of paracetamol solution showed that the absorbance got maximum at ʎmax 243 nm while the absorbance of the prepared azo dye solution was measured at its maximum wavelength of 444 nm against blank solution (Fig. 1).
 |
Figure 1: Absorption spectra of (a) paracetamol, (b)-i- azo dye paracetamol-2-HBA, -ii- blank reagent vs distilled water. |
Optimizations were implemented on operating protocol described above regardingdifferent chemicals of concentrations and volumes.
Optimization
Chemical optimization
Among sort of acids, hydrochloric acid had highest absorbance of 0.8273 at maximum volume 1.0 ml (Fig. 2). Increasing acid volume is resulted in the absorbance increase, while after 1 ml acid volume the excess acid is converted the diazonium ion to (Ar-NH +Cl–)diazonium salts and the absorbance is decreased 11.
 |
Figure 2: Decreasing the absorbance upon increasing volume of 0.1 M HCl after 1.0 ml. |
Fig. 3 indicates that sodium nitrite (1.0%) solution of 1.5 ml is enough to obtain a maximum absorption to convert NH2 group of p-amino phenol to diazoniumsalt in the subsequent experiments11.
 |
Figure 3: Decreasing the absorbance upon increasing volume of 1.0% sodium nitrite after 1.5 ml. |
Amount of 1.0 ml 2-hydroxy benzaldehyde(1.0%) solution was used in the subsequent experiments due to the increasing of amount of azo dye that is formed in the solution (Fig. 4).
 |
Figure 4: Maximum absorbance at 1.0 ml sodium nitrite (1.0%). |
A solution of sodium hydroxide (1.0%)was fulfilledfor coupling reaction of diazonium ion salt with 2-hydroxy benzaldehyde, among other bases like potassium hydroxide and sodium carbonate. Figure 5 indicatesthe maximum absorption at 1.0 ml sodium hydroxide solution(1.0%) because the excess of hydroxide ion reacts with the reagent (the diazonium ion ArN2+) and tends to convert it to a non-ionized compound (ArN2OH) that do not couple with 2-hydroxy benzaldehyde11.
 |
Figure 5: Maximum absorbance at 1.0 ml sodium hydroxide solution (1.0%). |
Physical optimization
A maximum intensity 0.9535 of colored azo dye is reached as the reagent of coupling was poured to the diazonium ion solution and after 2 minutes of standing period. Reduced absorbance 0.6327, 0.6683, 0.6491 and 0.6118 detected when the standing time of 1, 3, 4 and 5 min were, respectively.
Temperature and time are crucial factor of azo dye stability12. Temperatures of ice bath (0- 5) ºC as well as room temperature (25 ± 2)ºC are applied in the reaction of diazotization. Maximum absorbance, 0.9542 indicated in ice bath since diazonium salt decomposes above temperatures of 5 ºC 8. Time is pivotal for preparation and absorbance reporting. Instant development of the yellow color of azo dye is developedwhich remains stable for 1 h (Fig. 6).
 |
Figure 6: Stability of azo dye represented via absorbance versus time. |
Analytical parameters
Three different concentrations of paracetamol were chosen with five replications measurements for each of them to calculate relative standard deviation. Maximum RSD% of0.48% was attained of paracetamolunder optimized experimental conditions13(Table 1). Linearity of the calibration curve was adhered to Beer’s law in the concentration range (0.50 -12.00)µg/ml with detection limit 0.05 µg/ml (Fig. 7). The molar absorptivity and regression coefficient (R2) were 1.2032×10⁴ l/mol.cm and 0.9995, respectively.
In the suggested procedure, accuracy and precision was afforded via absorbance measurements of the azodyes of the diazonium salt for paracetamol of three different concentrations (0.50, 6.00 and 12.00 µg/ml), individually of five replicate measurements for each one (Table 1). Values between 0.01% – 0.48% and -1.70% – 2.00%, were recorded of RSD% and E % respectively. The validity and applicability of the suggested procedure are indicated from RSD% and E% values.
 |
Figure 7: Calibration curve at maximum wavelength 444 nm. |
Table 1: Precision and accuracy of the calibration curve.
|
Concentration of paracetamol (µg/ml) |
Obtained by proposed method (µg/ml) |
SD |
RSD% |
E%* |
|
0.50 |
0.51 |
1.80×10⁻⁴ |
0.48 |
+2.00 |
|
6.00 |
5.90 |
1.14×10⁻⁴ |
0.02 |
-1.70 |
|
12.00 |
12.05 |
1.14×10⁻⁴ |
0.01 |
+0.40 |
* Average of five determinations.
Application and comparison
The assessment of interferences in paracetamol pharmaceutical tablets and capsules are essential due to other ingredients that may cause an error in the assay 14. Pure paracetamolof 6.00 µg/ml is mixed with the interference solutions of (30.00 µg/ml) magnesium stearate, (50.00 µg/ml) starch, and (70.00 µg/ml) calcium carbonate, individually. The final volume ofthe prepared solutions was 25.00mL.A comparison was made between the spectra resulted of 6.00µg/mlparacetamol standard solution and the interferences spectrum. Error more than ±5% was unacceptable if the studyof interference.Study of interferences was showed no significant levels thatdetected in the determination of paracetamol in the presence of the common ingredientsof the medicine (Table 2).
Table 2: Interreferences and determination of paracetamol.
|
Interference |
Acceptable amount added (µg/ml) |
E%* |
|
Magnesium stearate |
30.00 |
-2.90 |
|
Starch |
50.00 |
-0.06 |
|
Calcium carbonate |
70.00 |
-1.60 |
* Average of three determinations
The results of paracetamol assessment in the pharmaceutical tablets was profitably bestowed. There were no interferences in the pharmaceutical tablets that affected the determination of paracetamol. Three pharmaceutical tablets were examined for analysis of paracetamol and was compared with the assay of standard paracetamol using HPLC. The results showed the appropriateness of the suggested procedure for the analysis of paracetamol in pharmaceutical tablets (Table 3). Isolation and assessment of pharmaceutical products using HPLC has been assessed in trace concentrations as low as parts per trillion4,6.
The calculated t- and F-values at 95% confidence level, did not violate the theoretical values (Table 3). Wherefore, there is no overtone difference between the suggested method and the standard HPLC. Furthermore, uncomplicated, rapid, economical,and accuratespectrophotometric method was used in this work for determination of paracetamol in pharmaceutical tablets.
Table 3: Assessment of paracetamol in pharmaceutical tablets testing the suggested method and standard HPLC method
|
Pharmaceutical tablet |
Content (mg/tablet) declared |
Values of suggested procedure (mg/tablet) |
Values of HPLC (mg/tablet) |
Recovery% |
E%* |
t and F values** |
|
S1 S2 S3 |
500.00 500.00 500.00 |
495.00±0.16 497.50±1.09 501.50±1.10 |
500.50±0.08 499.50±0.15 501.00±0.09 |
99.00 99.50 100.30 |
-1.09 -0.40 0.09 |
t = 1.06, F = 1.74 t = 1.16, F = 1.61 t = 1.12, F = 1.90 |
S1, S2 and S3 are pharmaceutical samples of three companies: Pioneer-Iraq, M.D.I.-Baghdad/Iraq, and Awamedica-Erbil/Iraq, respectively
*Average of five determinations, **Theoretical calculation of t and F at 95% confidence level (n=5) was 2.78 and 6.39, respectively, ***The values ± are the standarddeviation of the five replications of each sample
In the articles, paracetamol was assessed using various reagents and methods over spectrophotometric technique. Table 4 is showed the determination of paracetamol variousreagent reactions with their parameters besides the suggested method. Pre-extraction of the sample, easy and short time of the reaction are the advantages of the suggested methodover some of the analytical method.
Table 4: Optimized results of paracetamol determination using different reagents and the suggested method .
|
Method based on |
Ref. |
LR (µg/ml) |
LOD (µg/ml) |
|
Glynn and Kendal |
Bilel C., et al., 2020 |
40.00 -400.00 |
10.00 |
|
sodium nitroprusside |
Yanyan, Z., 2011 |
0.19 – 96.00 |
0.01 |
|
Derivative spectrophotometry |
Rodenas,V., 2000 |
1.00 – 15.00 |
0.14 |
|
Suggested method |
|
0.50 -12.00 |
0.05 |
LR: Linear range, LOD: Limit of detection
Conclusion
Practicality of simplicity and rapidity are significant advantages of the suggested method for the assessment of paracetamol in pharmaceutical products. Besides,the free interferences of the suggested method from common tablet excipients. Stability of the colored reagent dye and time of reaction are allowed the analysis method to compose less brutal control of the experimental parameters. Economical reagent and easily reachable procedure that don’t comprise any laborious sample preparation are characteristic for this work. These characteristics are upgraded the application of this work in routine quality control of paracetamol in industrial laboratories.
Ackowldgment
Authors are thankful for Department of Chemistry, Faculty of Science and Health, Koya University for providing the chemicals and the instrument to support this research work. Our thanks go to Awamedica pharmaceutical company in Erbil-Iraq for their support.
Conflicts of Interests
All authors have none to declare
References
- Athersuch,T.J.;Antoine,D.J.;Boobis,A.R.;Coen,M.;Daly,A.K.;Possamai,L.;The Royal Society of Chemistry.2018,7(3), 347-57.
CrossRef - Kennon-McGrill, S.;McGrill, M.R.;J ClinTransl Res.2017,3(3), 297-310.
- Bilel. C.;Anissa, Z.; Meriem, N.B.;Chaïmaa, R.; Haciba, R.;ToxicologieAnalytique and Clinique.2020, 326, 1-12.
- Keerthisikha, P.;Sreenivasa, C.A.;Bharathi, K.;SpectrochimicaActa Part A: Molecular and Biomolecular Spectroscopy. 2020, 243,118801.
CrossRef - Hewavitharana, A.K.; Lee, S.; Dawson, P.A.;Markovich, D.; Shaw, P.N.;Analytical Biochemistry. 2008,374 (1),106-111.
CrossRef - Mahesh, A.;Pharmaceutical methods. 2011, 2 (1),61-66.
CrossRef - Yanyan, Z.; Yan, Z.;Quanmin, L.; Xinzhen, D.;Journal of Analytical Chemistry. 2011,66 (2), 215-220.
CrossRef - Anal Bhiochem. 2015, 4(2), 1-4.
- Kamla, M.E.; Hanna, M.W.;Nawal, A.K.;Marwa, F.B.;Bulletin Pharmaceutical Society.2009,32 (2), 339-347.
CrossRef - Shah, J.; Jan, M.R.; Khan, M.A.;Journal of the Chinese Chemical Society.2005,52, 347-352.
CrossRef - Morrison, R.; Boyd, R.N.;Organic Chemistry. 6th Ed. India: Prentice- Hall. 2002,772-774.
- Bruice, P.Y.; Organic chemistry. 5th ed., Prentice Hall India, 2004,684-688.
- International Conference on Harmonisation. 2005.Topic Q2 (R1): Validation of Analytical Procedures: Text and Methodology. International Conference on Harmonisation, Switzerland.
- Yanyan, Z.; Yan, Z.;Quanmin, L.;Xinzhen, D.;Journal of Analytical Chemistry. 2011,66 (2), 215-220.
CrossRef


![]()


