Determination of Aliphatic and Polycyclic Aromatic Hydrocarbons in Marine Core Sediments off Johor, Malaysia
Raihanah Na Ilah Ruzani1, Suhaimi Suratman1*, Muhammad Fais Fadzil1, Pang Swee Yun1, Nur Shahirah Rozmi1 and Norhayati Mohd Tahir2
1Institute of Oceanography and Environment, Universiti Malaysia Terengganu, 21030 Kuala Nerus, Terengganu, Malaysia.
2Faculty of Science and Marine Environment, Universiti Malaysia Terengganu, 21030 Kuala Nerus, Terengganu, Malaysia.
Corresponding Author E-mail: miman@umt.edu.my
DOI : http://dx.doi.org/10.13005/ojc/370422
Article Received on : 04-Jun-2021
Article Accepted on : 26-Jul-2021
Article Published : 29 Jul 2021
Reviewed by: Dr. Ildefonso Baldiris Navarro
Second Review by: Dr. Bashdar Ismael Meena
Final Approval by: Dr. Khairul Nizam Bin Mohamed
Aliphatic hydrocarbons and polycyclic aromatic hydrocarbons (PAHs) were studied in two sediment cores of southern South China Sea off Johor coastal area. The concentrations of the total identified resolved aliphatic hydrocarbons
(TiRAHs) in the coastal station (STC104) ranged from 0.35 to 2.07 µg/g while the offshore station (STC100) varied from 0.05 to 14.7 µg/g. The concentrations of total PAHs were varied from not detected to 33.9 ng/g. The nalkanes distribution in STC104 were predominant in short chain carbons from marine productivity, petroleum mixture and minor higher plant input, while STC100 exhibited a bimodal distribution with mixed input of marine and terrestrial origin. PAHs isomer ratios cross-plot have showed mixed input of pyrogenic and petrogenic inputs while perylene was dominated in STC100 followed by fossil fuels and pyrogenic source. Presence of perylene in both cores suggesting the contribution of biogenic sources. Principal component analysis was used to cluster the relationship of the hydrocarbons at both sediment cores.
Core Sediments; n-alkanes; PAHs; petrogenic; Johor Coastal Area
Download this article as:| Copy the following to cite this article: Ruzani R. N. I, Suratman S, Fadzil M. F, Yun P. S, Rozmi N. S, Tahir N. M. Determination of Aliphatic and Polycyclic Aromatic Hydrocarbons in Marine Core Sediments off Johor, Malaysia. Orient J Chem 2021;37(4). |
| Copy the following to cite this URL: Ruzani R. N. I, Suratman S, Fadzil M. F, Yun P. S, Rozmi N. S, Tahir N. M. Determination of Aliphatic and Polycyclic Aromatic Hydrocarbons in Marine Core Sediments off Johor, Malaysia. Orient J Chem 2021;37(4). Available from: https://bit.ly/3iZT9VN |
Introduction
Aliphatic and polycyclic aromatic hydrocarbons (PAHs) are the most basic compounds in the environment1. Their distribution held useful tool in organic geochemistry as they can be used to identify the sources of organic matter (OM) in the environment. These hydrocarbons could be generated via biogenic, diagenetic, petrogenic and pyrogenic process2. In general, aliphatic hydrocarbons (AHs), i.e., n-alkanes, pristane and phytane are ubiquitous in the environments, as constituents of petroleum products, epicuticular waxes of terrestrial higher plants or biologically synthesis products of natural precursors in aquatic environments3. Strong odd- carbon number predominance at longer chain n-alkanes homologues is contribution of terrestrial higher plant inputs4 while short chain homologues indicate marine inputs5. Crude oils containing 30–35% hydrocarbons, which abundant in lighter fraction (<C15)6. PAHs in the environment have been a concern to the researchers worldwide due to their carcinogenicity, mutagenicity, and teratogenicity properties. They tend to bioaccumulate in the environment due to their stable and persistence structure that led to slow decomposition. Most of PAHs were introduced into the marine environment through the human activities that utilizing petroleum products (petrogenic origin), atmospheric deposition (pyrolysis process) and/or produced diagenetically7.
Molecular markers tend to accumulate in sediments due to their hydrophobic properties which cause them to bind to particulate matters and gradually deposited together with the sediment1. Core sediment function as historical archives of OM that undergoes physio-chemical processes via atmospheric deposition, runoff, mixing and sedimentation. By looking at the trends of markers in the sediments, they can provide clues of the past events that mark significant occurrence in the environment such as oil spills, the development of civilization or economical activities8.
The semi-enclosed of Western Pacific Ocean,southern South China Sea (SCS) has been collected many natural and anthropogenic organic carbon from various sources over the years 9. They are also the largest receiver of fluvial Sediments among the marginal seas around the world 10. SCS is also known as a famous shipping route for Southeast Asia,bridging between Europe and Middle East countries to other Asian countries i.e.,China,Taiwan,Japan,and Korea.The location also accommodates human populations, economical activities such as oil refineries at Pengerang Integrated Petroleum Complex , sewage treatment and fisheries near the coastal area. However ,to this date,the study of hydrocarbons in core sediments are very limited in southern SCS area.This study aimed to comparing the distribution and the vertical profiles of two sediment cores from southern SCS as well as to determine their origin using molecular indices.
Materials and Methods
Two sediment cores were collected from the coastal waters off Sedili,Johor, Malaysia (Figure 1) during are search cruise campaign conducted by Institute of Oceanography and Environment (INOS) in August 2014. The samples were taken using gravity corer and the disturbance to the surface sediment layers were minimized. Near coast (STC104) (1º43’48” N,104º16’7” E) and off shore sediment cores (STC 100) (1º44’51”N,104º53’55”E) were 142 cm and 140 cm long, respectively. Both cores were divided into segments accordingly (approximately 2cm each from surface to 30 cm core depth and 4 cm each from 30 cm to the rest of the cores) wrapped in pre-cleaned aluminium foil and stored at -20℃ until further treatments. The sediments were then freeze-dried, homogenized, and weighed prior the analysis.
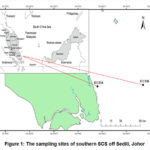 |
Figure 1: The sampling sites of southern SCS off Sedili, Johor. |
About 1 g of sediments were used for determination of total organic carbon (TOC) using Walkley-Black titration method11,12.
The extraction methodology of sediment samples for n-alkanes and PAHs was followed accordingly from Mohd Mursyid et al.13. Prior to extraction, about 20 g of freeze-dried sediments were spiked with internal standards mixture (2H50 tetracosane, [2H10] phenanthrene and [2H12] perylene) and ultrasonic agitation for about 30 minutes in 50 mL methanol (MeOH)-dichloromethane (CH2Cl2) (3:1 v/v) mixture. The extraction was repeated twice. The total extracts were thenconcentrated using rotary evaporator and gentle stream of N2 to 3 mL. The extracts
were saponified with 1 mL 6 % KOH in MeOH-H2O (80:20) plus 1 mL MiliQ water at 80℃ for 1 hour, in order to isolate neutral lipids (basic solution, pH >13) from acidic lipids (acidic solution, pH<2)14. Neutral lipids that contain aliphatic (AHs) and PAHs were then fractionated into two fractions, using column chromatography method that containing 3.2 g silica (5% water-deactivated) and sodium sulphate. The column was first eluted with 8 mL of hexane (hex) (AHs fraction), followed by 8 mL of 10% of DCM in hex and 7 mL of hex:DCM (1:1, v/v) (PAHs fraction). Then, AHs and PAHs fraction were concentrated using nitrogen evaporator to 500 µL and 200 µL, respectively. Next, 2 µL of AHs and PAHs fractions were concentrated prior to instrumental injection.
Identification of AHs and PAHs were performed with Shimadzu QP-2010 Plus gas chromatography-mass spectrometer (GC-MS) fitted with a fused silica capillary column (29.8 m length x 0.25 mm internal diameter, 0.25 µm film thickness). Injector temperature was set at 300℃ in splitless mode. Column temperature programme setting for AHs and PAHs were set to hold at 50℃ for 1 min, heated to 140℃ at 5℃/min, ramp to 300℃ at 4℃/min, and then hold for 15 min. The carrier gas used is helium (99.9% purity) with pressure of 67 kPa and column flow rate 1.19 mL/min.
Aliphatic hydrocarbons studied were n-alkanes (nC12–nC36) and isoprenoids (pristane and phytane). On the other hand, PAHs in the study can be classified into three classifications: low molecular weight (LMW)(2–3 ring) such as naphthalene (Nap), acenaphthene (Ace), acenaphthylene (Acy), fluorene (Flo), phenanthrene (Phe) and anthracene (Ant); high molecular weight (HMW)( 4-6 rings) such as fluoranthene (Fla), benzo[a]anthracene (BaA), chrysene (Chr), benzo[k]fluoranthene (BkF), benzo[b]fluoranthene (BbF), benzo[a]pyrene (BaP), benzo[e]pyrene (BeP), indeno[1,2,3-c,d]pyrene (Ind) and benzo[ghi]pyrene (BghiP), and perylene (Pery).All analytes were identified and quantified based on the retention time and key mass fragment ions of the injected external standards. The results were blank subtracted and corrected with recoveries of internal standards. The mean recoveries and standard deviation (SD) for 2H50 and 2H10 are 92.0%±0.17 and 93.6%±0.07, respectively.
Analysis of variance (ANOVA) and principal component analysis (PCA) were also performed using the IBM SPSS Statistics 26.0 software. Prior to statistical analysis, the data were normalized to reduce data redundancy and ensure similar data distribution. For PCA, the Kaiser-Mayer-Olkin test and Bartlett’s Test of Sphericity were conducted to ensure the adequacy of data for structure detection with acceptable values of >0.5 and <0.05, respectively. The data set were evaluated through rotation method of varimax with Kaiser Normalization, followed by scores regression which then plotted into biplot.
Results and discussion
Total organic carbon
Total organic carbons (TOC) variations along the depth cores were shown in Figure 2. Analysis of TOC provides organic matter (OM) influx into the sediments that is essential in analysing environmental condition15. TOC results for STC104 and STC100 were in the range of 1.01–1.52% (1.25±0.15%) and 0.21–1.16% (0.79±0.27%), respectively. In general, STC104 does not exhibit dramatic changes along the core. On the other hand, TOC content in offshore station (STC100) was lower than the coastal station (STC104) and show dramatic changes down the core. High TOC value at 0–2 cm of STC104 core could originate from the land discharge of Kuala Sedili, Johor coastal, specifically terrigenous inputs and most likely resistant to degradation7. Those trends could be depicted by high sedimentation at the coastal and high percentage of fine sedimentary fractions along with distance of offshore from coastal which cause the prevention of oxygen diffusion to the sediment, therefore conserving the organic particles in it16. A study carried out by Mohd Tahir et al.17 showed a similar trend for low levels of TOC at the offshores station with the range of 0.41–2.23%.
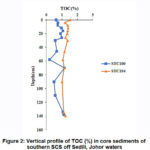 |
Figure 2: Vertical profile of TOC (%) in core sediments of southern SCS off Sedili, Johor waters. |
The vertical profile of total resolved aliphatic hydrocarbons (TiRAH) in the core samples are shown in Figure 3a, their concentrations were ranged 0.35–2.07 µg/g (0.90±0.48 µg/g) dry weight (dw) and 0.05–14.7 µg/g (1.8±3.73 µg/g) dw in core STC104 and STC100, respectively. Normalization of total aliphatic hydrocarbons to the bulk TOC is to determine the input of n-alkanes respective to the organic carbon content in the sediment and to establish the hydrocarbon concentrations in coarse sediment fraction that may be affected by the dilution effect7,15. The TiRAHs/TOC in STC104 and STC100 were ranged 0.08–0.31 µg/goc and 0.01–2.58 µg/goc (0.19±0.47 µg/goc), respectively (Figure 3b).
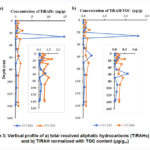 |
Figure 3: Vertical profile of a) total resolved aliphatic hydrocarbons (TiRAHs) (µg/g) and b) TiRAH normalized with TOC content (µg/goc) |
In the study area, both cores show the trends of elevated concentration of AHs near to the coastal that gradually decreasing towards open sea except for few sections of offshore station (26–28 cm and 58–62 cm). In STC104, the levelled trend is shown except at the core section of 16–18 cm, 30–34 cm and 70–74 cm. These trends could be influenced by the high sedimentation rate at the coastal and dilution effect towards the sea18. Abundant of AHs were observed at depth 26–28 cm (STC104) and 16-18 cm (STC100). The existence of several forest reserve area combined with few national and marine parks in Johor could contribute to the n– alkanes inputs into the cores. These results are slightly higher than off the coast Kemaman and Dungun, Terengganu (0.15–6.91 µg/g)17 but lower than the offshore area of Kuching, Sarawak (35.6–2,466 µg/g). According to Yusoff et al.19, high amount of TAHs in the Kuching sediments could be due to the tourism and maritime activities around Bako Bay.
The mean distribution of n-alkanes in the studied cores are shown in Figure 4. Abundant presence of n-alkanes in the range of n-C25 to n-C35 usually associated to the inputs of higher plant wax while Cmax of lower carbon numbers are derived from various sources such as marine plankton, bacteria or petroleum-contaminated sediments5,7. STC104 exhibited distribution with Cmax at n-C14 and strong predominance of short chain n-alkanes. In STC100, bimodal distribution was exhibited with Cmax at n-C35 and n-C16. Distribution in STC104 suggests source of marine productivity or petroleum whereas a mixed input of terrestrial and marine sources is defined in STC100.
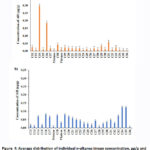 |
Figure 4: Average distribution of individual n-alkanes (mean concentration, µg/g and standard deviation) in a) STC104 (coastal) and b) STC100 (offshore). |
Selected diagnostic ratios to determine the n-alkanes’ sources are tabulated in Table 1. Carbon preference index (CPI) is the most commonly used ratio to distinguish natural and anthropogenic AHs, specifically to differentiate the sources of marine productivity, higher plant wax and fossil fuel byproducts. CPI values lower than 1 indicate marine productivity, while close to 1 value is attributed to petroleum input. Value more than 2 is related to biogenic sources20. In the study area, the overall CPI (CPI12-36) values obtained from core samples of STC104 core ranged 0.1 to 0.7 whereas STC100 is between 0.1 and 2.5. For STC104, CPI suggesting the station was either originated from marine productivity or petroleum, or both. Based on the CPI values from STC100, the top 34 cm depth contain mixed input of petroleum and marine productivity whereas lower than 46 cm depth accumulate terrestrial inputs.
Table 1: Selected n-alkane diagnosticratios in core samples.
|
|
Overall
CPI12–36 |
LMW/HMW |
|
TAR |
%TerrAlk |
Pris/Phy |
||||
|
Station(STC) |
104 100 |
104 100 |
10 |
100 |
104 100 |
104 100 |
||||
|
|
|
|
4 |
|
|
|
||||
|
Depth (cm) |
|
|
|
|
|
|
|
|
|
|
|
0–2 |
0.6 |
0.2 |
1.8 |
8.6 |
5.2 |
1.5 |
22.6 |
6.5 |
0.5 |
0.0 |
|
4–6 |
0.6 |
0.2 |
2.1 |
6.4 |
3.4 |
2.7 |
19.9 |
10.8 |
0.4 |
0.0 |
|
8–10 |
0.2 |
0.4 |
5.7 |
14.9 |
3.2 |
0.1 |
10.1 |
2.1 |
0.7 |
0.0 |
|
12–14 |
0.4 |
0.4 |
2.8 |
6.0 |
3.8 |
0.5 |
14.3 |
8.8 |
0.3 |
0.6 |
|
16–18 |
0.7 |
0.5 |
3.6 |
6.2 |
0.3 |
1.0 |
3.8 |
10.5 |
0.2 |
0.0 |
|
20–22 |
0.4 |
1.1 |
3.5 |
22.0 |
3.3 |
0.03 |
14.5 |
3.8 |
0.4 |
1.1 |
|
26–28 |
0.3 |
1.1 |
4.2 |
1.0 |
1.9 |
0.5 |
12.5 |
7.6 |
0.3 |
0.2 |
|
30–34 |
0.2 |
1.3 |
5.1 |
0.6 |
4.2 |
100 |
10.6 |
46.1 |
0.3 |
0.0 |
|
46–50 |
0.1 |
2.5 |
10.8 |
0.4 |
1.9 |
4.4 |
4.8 |
46.0 |
0.0 |
0.0 |
|
58–62 |
0.4 |
1.7 |
2.8 |
0.8 |
4.5 |
1.3 |
18.3 |
28.3 |
0.3 |
0.0 |
|
70–74 |
0.3 |
1.9 |
3.5 |
0.3 |
3.5 |
7.1 |
8.8 |
36.5 |
0.1 |
0.0 |
|
90–94 |
0.5 |
2.1 |
2.1 |
0.4 |
3.6 |
17.9 |
18.5 |
43.8 |
0.1 |
1.2 |
|
110–114 |
n.a |
1.7 |
n.a |
0.7 |
n.a |
6.3 |
n.a |
36.3 |
n.a |
0.6 |
|
134–138 |
n.a |
1.7 |
n.a |
0.7 |
n.a |
4.3 |
n.a |
32.5 |
n.a |
0.4 |
|
134–136 |
0.6 |
n.a |
1.6 |
n.a |
4.2 |
n.a |
23.8 |
n.a |
0.1 |
n.a |
|
138–140 |
n.a |
1.7 |
n.a |
0.6 |
n.a |
22.5 |
n.a |
33.9 |
n.a |
1.9 |
|
140–142 |
0.2 |
n.a |
5.8 |
n.a |
2.4 |
n.a |
9.3 |
n.a |
0.3 |
n.a |
CPI12-36 = 0.5[(oddΣC13-C35/evenΣC12-C36)+ (oddΣC13-C35/evenΣC12-C36)]; Pris/Phy= sum of phytane over phytane, LMW/HMW = ΣC12-C23/ΣC24-C36; TAR = (nC27+nC29+nC31)/(nC15+nC17+nC19); % Terr
Alk = percentage of terrestrial n-alkanes (sum of Wax Cn over total n-alkanes), which is based on Wax Cn = Cn – 0.5[Cn+1 + Cn-1] where Cn = 25, 27, 29, 31, 33, 35 and negative values are counted as 0.
n.a = sample not available
Low molecular weight (LMW) over high molecular weight (HMW) ratio is utilized to differentiate n-alkane sources, where HMW n-alkanes are abundant in terrigenous input while LMW n-alkanes could be derived from petroleum or marine organism productivity21. STC104 have showed greater accumulation of short chain n-alkanes compared to long chain n-alkanes of terrestrial origins. As for STC100, the result shows high LMW/HMW ratios for top 28 cm depths suggesting the theory of anthropogenic or marine productivity inputs, while the rest of the core segments indicate the accumulation of terrigenous inputs into the sediment.
Terrestial over aquatic ratio (TAR) is used to to determine the relative contribution of biogenic n-alkanes either from terrestrial higher plants inputs or biogenic aquatic inputs. TAR below 1 indicate marine sources while more than 1 shows clear source of terrigenous input. Those sources can be calculated by sum of n-alkanes of higher plant waxes (n-C27, n-C29, n-C31 over sum of n-C15, n-C17 and n– C19. Most of the depth samples of core STC104 revealed contribution of terrestrial inputs except at 16–18 cm depth that exhibit drastic increases of aquatic origin (0.3). In ST100, all core sections show high TAR value indicate terrigenous loading, except at 8–14 cm and 20–28 cm depth that convey an aquatic origin. The probable causes of this trend are the existence of wetland near Sungai Sedili or the development of tourism hotspot and economic activies along the coastline of Kota Tinggi that prompt deforestation. The development could contribute to the increasing value of terrigenous loadings into the sediments composition due to the structure stability of long chain holomogue series n-alkanes8.
Percentage of terrestrial wax n-alkanes (%Terr Alk) were calculated to determine the content of higher plant wax residual (wax Cn). The %Terr Alk values in core STC104 (3.8–23.8%) are lower than core STC100, and were varied with depth. Low percentage of Terr Alk were at the top 28 cm core section of STC100 (1.6– 10.8%) while the sections below exhibited higher values of n-alkanes originated from the discharge of terrestrial higher plants (28.3–46.1%).
Pristane and phytane are the products from phytol in chlorophyll component that produced under different condition22. These isoprenoids hydrocarbons were present in all sections of STC104 core except at depth 46–50 cm, while only seven core sections of STC100 detect them. The calculation of pristane/phytane (Pr/Phy) ratio ranged 0.0–0.7 and 0.0–1.9 in STC104 and STC100, respectively. Isoprenoids in STC104 indicate the contribution of crude oil into the sediment or depositional environment under anoxic condition. As for STC100, core sections 20–22 cm, 90–94 cm and 138–140 cm contain higher Pris/Ph ratio, suggesting the presence of zooplankton, while the rest were either originated from crude oil or no presence at all.
The vertical profile of the total concentrations of PAHs (ΣPAHs) in core STC104 and STC100 were shown in Figure 5a and Figure 5b, respectively. ΣPAHs in STC104 were ranged from 0.02 ng/g to 14.0 ng/g (6.33±4.29 ng/g), whereas in STC100, ΣPAHs were ranged from not detected to 33.9 ng/g (9.31±10.3 ng/g). According to Baumard et al.23, the level of PAHs in sediments are classified into low to moderate contamination for the concentrations within the ranges of 0–1000 ng/g, 1000–5000 ng/g indicate high pollution while >5000 ng/g indicate severely contaminated sediments. Based on the classification, the PAHs level in both cores were considerably low. The values in the study area were far lower compared to the strait of Johor (650–1441 ng/g)24 and Terengganu water (20-790 ng/g)13 that were mainly originated from pyrolytic sources.
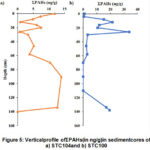 |
Figure 5: Verticalprofile ofΣPAHs(in ng/g)in sedimentcores of a) STC104and b) STC100 |
LMW PAHs are usually derived from samples mixed with petroleum origin while HMW PAHs are generated from the incomplete combustion of OM such as biomass and coal combustion [25]. Perylene can be produced naturally during early diagenesis from its natural precursor i.e in situ degradation of terrestrial and marine precursors such as phytoplankton, mainly diatoms26, 27. The vertical profile of LMW, HMW and natural PAHs in the studied cores are shown in Figure 6. For core STC104, most of the core sections were dominated by LMW PAHs, except for core sections 0–6 cm, 46–50 cm and 140–142 cm was dominated by HMW PAHs and Pery (30–34 cm and 58–62 cm). In STC100, the surface section (0–6 cm) composed of mainly perylene whereas down to 28 cm depth are dominating in LMW PAHs. The lower core sections of STC100 contain mostly of perylene except at depth 70–74 cm that originated from pyrolysis process. Overall, PAHs in the study area are mainly contributed by petrogenic input follow closely by natural and pyrogenic inputs. This result was consistent to the study carried out by Liu et al.28 where higher petroleum inputs accumulated in the SCS are due to geographical condition and rapid city urbanization and industrialization. Region like Northern China with colder climate used more coal combustion as heat source which generated high concentration of pyrogenic PAHs compared to tropical climate. Since SCS located in the equatorial zone which acclimate humid weather, pyrogenic sources coming from coal combustion as heat sources are rarely used, whereas the pyrogenic sources detected in the study area may originated from shipping activities or atmospheric deposition.
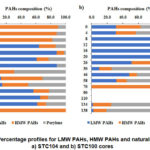 |
Figure 6: Percentage profiles for LMW PAHs, HMW PAHs and natural PAHs in a) STC104 and b) STC100 cores. |
Different PAH isomer ratios including Fla/(Fla+Py), LMW/HMW, BaA/(BaA+Chry) and Ind/(Ind+BghiP) were plotted into cross plots (Figure 7). PAH isomer ratios were used to assess their possible sources by assuming that isomers were undergoes similar physico-chemical processes during transportation into the environment and the PAH cross plot as to avoid misinterpretation that could arise from single use isomer ratios29. The LMW/HMW ratio <1 indicates pyrogenic, and >1indicates petrogenic7,13; Fla/(Fla+Py) ratio <0.4 indicates petrogenic, and >0.4 indicates pyrogenic; BaA/(BaA/Chr) ratio indicates <0.2 petrogenic, 0.2–0.35 indicates petroleum combustion, and >0.35 incomplete combustion.; Ind/(Ind+BghiP) ratio <0.2 indicates petrogenic, 0.2–0.5 petroleum combustion, and >0.5 biomass combustion27. Fla/(Fla+Py) ratios in the core STC104 and STC100 (0.0–1.0) suggested mixed input of non-combusted petroleum and fossil fuels combustion, probably from engine exhausts or industrial emission whereas core STC100 (0.3–0.8) revealed contribution from petroleum origin.
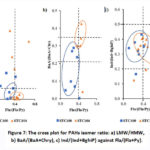 |
Figure 7: The cross plot for PAHs isomer ratio: a) LMW/HMW, b) BaA/(BaA+Chry), c) Ind/(Ind+BghiP) against Fla/(Fla+Py). |
Overall, by comparing LMW/HMW, BaA/(BaA+Chry) and Ind/(Ind+BghiP) with Fla/(Fla+Py), fossil fuels combustion were the major sources in core STC104, whereas most of core sections in STC100 showed slightly higher amount of petroleum followed by perylene and combustion of petroleum. The petroleum by- products sources dominated in core STC104, probably from vehicular exhaust, that could possibly come from maritime activities and the development of Pengerang Integrated Petroleum Complex (PCIC) near the study area while the minor input from biomass combustion, could be due to palm oil plantation or automotive emissions. As for STC100, mixed input of petrogenic and pyrogenic sources could possibly be due to oil seeps from shipping activities or combustion of fossil fuels or coals. This trend were seen in study carried out by Ma et al.30 stated that petrogenic sources in the coastal shelf were derived from coal, oil seeps and sediments.
Perylene was detected in the core sediments from both stations. From the Figure 6, perylene trends in both cores showed slight increasing distribution down the core. The percentage of perylene over the total of penta-aromatic isomers (%pery/PAI) were calculated, in order to differentiate whether the perylene coming from natural or anthropogenic sources (Figure 8). Pery/PAI ratio >10% would imply the presence of natural perylene1. As the result, most of the perylene from both stations STC104 and STC100 were derived from natural sources, except for certain core sections in STC104 (140–142 cm) and STC100 (70–114 cm) which show absence of perylene.
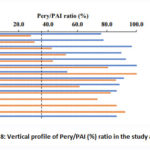 |
Figure 8: Vertical profile of Pery/PAI (%) ratio in the study area. |
One-way ANOVA of total hydrocarbons (THC) (sum of aliphatic hydrocarbons and PAHs) have showed that there is a statistically significant difference (F = 13.5, p = 0.001) between the two cores, suggesting the hydrocarbon inputs in both stations are different. Thus, PCA was carried out to further characterize the sources of the hydrocarbon markers in these cores. The PCA result is shown in Table 2 and Figure 9.
Table 2: Rotated factor loading of PCA for selected hydrocarbon markers in the sediment samples.
|
Variables |
Coastal station(STC104) |
Offshorestation (STC100) |
|||
|
|
PC1 |
PC2 |
PC1 |
PC2 |
PC3 |
|
2-ringPAHs |
-0.164 |
0.901 |
0.487 |
0.646 |
-0.063 |
|
3-ringPAHs |
0.824 |
-0.034 |
0.073 |
0.140 |
0.851 |
|
4-ringPAHs |
0.924 |
-0.180 |
0.068 |
-0.398 |
0.763 |
|
5-ringPAHs |
0.948 |
0.053 |
0.924 |
-0.132 |
0.144 |
|
6-ringPAHs |
0.931 |
-0.075 |
0.484 |
-0.054 |
0.821 |
|
Perylene |
0.689 |
0.387 |
0.940 |
-0.041 |
0.266 |
|
Terrestrialalkanes (TerrAlk) |
0.575 |
0.630 |
0.049 |
-0.884 |
0.005 |
|
Marinealkanes (MarAlk) |
-0.026 |
0.731 |
-0.321 |
0.830 |
-0.096 |
|
Total variance explained (%) |
54.648 |
24.186 |
29.057 |
26.104 |
26.082 |
PCA rotation method: Varimax with Kaiser normalization; factor loading>0.7 are marked in bold; 2-ring
PAHs = Nap; 3-ring PAHs = Σ(Acy, Acp, Flo, Phe, Ant); 4-ring PAHs = Σ(Fla, Py, BaA, Chr); 5-ring PAHs = Σ(BbF, BkF, BeP, BaP); 6-ring PAHs = Σ(Ind, BghiP, DBA); terrAlk = Σ(n-C27, n-C29, n-C31) and marAlk = Σ(n-C15, n-C17, n-C19)
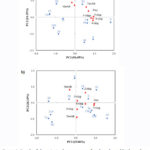 |
Figure 9: Result of the principal components for the selected hydrocarbon markers in core a) STC104 and b) STC100. The numbering represents the depth of the core (e.g 0–2 cm, 4–6 cm, 8––10 cm etc) |
In core STC104, the first two component of the principal component (PC1 and PC2) explained 54.65% and 24.19% of the total variance, respectively. PC1 was heavily loaded (>0.8) with 3-ring to 6-ring PAHs including BkF, Phe, BeP and Py. These compounds are found predominated in the surface (0–6 cm) and at depth 58– 62 cm. Bkf originated from diesel combustion, while Phe, BeP and Py were tracer for petroleum, coal or biomass combustion26. Pery and terrestrial derived n-alkanes are also found clustering together with HMW PAHs, could be due to the land-based transport influenced. PC2 of the STC104 had positive loadings of 2-ring PAH and marine alkanes that dominating in the middle section of the core (20–28 cm), possibly inputs from petroleum pollution and marine productivity. Overall, PCA results again revealed the hydrocarbons in core STC104 are majorly from land based, which predominated in combustion of petroleum, diesel, coal or biomass, followed by petroleum pollution and biogenic marine input.
Compared to core STC104, STC100 has a low principal loading. PC1 (29.06% of the total variance) in core STC100 had high loadings of Pery and 5-ring PAHs. Marine in-situ production could be contributing to ubiquitous present of perylene in the core. PC2 (26.10% of the total variance) was dominated with marine alkanes and 2-ring PAHs, suggesting petrogenic contamination and marine productivity are abundant, especially at uppermost sediment (0–18cm). Flo, Py, Chr and BghiP are the major compounds that generated during the combustion of coal. Py and BghiP were also from petroleum combustion, while Flo and Chr enriched in oil burning emission. These compounds are found highly loaded at the upper part (8–14cm) and bottom part (46–50 cm, 134–140 cm) of the core. The variation between PC1 and PC2 are small, indicating a mixed input of combustion and petrogenic inputs, which is consistent with PAHs cross-plot results. Biogenic input also contributes into the core.
Conclusion
Vertical distribution of aliphatic hydrocarbons and PAHs in marine core sediments from southern part of SCS off Johor, Malaysia were evaluated to provide baseline data in the region.The coastal area accumulated higher TiRAHs and PAHs compared to the off shore, due to oceandilution effect. Overall, the hydrocarbons in coastalstation are predominating in petroleum combustion products, marine sources of petrogenic light fuel mixed with marine productivity with minor input of terrestrial higher plants. On the other hands, PAHs corroborate with n-alkanes finding shave revealed the off shore station containing hydrocarbons from mixed inputs of petroleum residues and pyrogenic inputs, together with marine derived productivity and higher plant waxes. Vertical distribution of aliphatic hydrocarbons and PAHs in marine core sediments from southern part of SCS off Johor, Malaysia were evaluated to provide baseline data in the region. The coastal area accumulated higher TiRAHs and PAHs compared to the offshore, due to ocean dilution effect. Overall, the hydrocarbons in coastal station are predominating in petroleum combustion products, marine sources of petrogenic light fuel mixed with marine productivity with minor input of terrestrial higher plants. On the other hands, PAHs corroborate with n-alkanes findings have revealed the offshore station containing hydrocarbons from mixed inputs of petroleum residues and pyrogenic inputs, together with marine derived productivity and higher plant waxes.
Acknowledgement
The authors wish to thank the Ministry of Higher Education for financial support of this project through the Higher Institution Centre of Excellence Research Grant (vote no. 66928) awarded to Institute of Oceanography and Environment, Universiti Malaysia Terengganu.
Conflict of Interest
The authors declare that there are no conflicts of interest with any person and organization related tothis article.
References
- Wu, Y.; Zhang, J.; Mi, T. Z.; Li, B.; Occurrence of n-alkanes and polycyclic aromatic hydrocarbons in the core sediments of the Yellow Sea. Marine Chemistry, 2001, 76, 1–15.
CrossRef - Vaezzadeh, V.; Pauzi, M. A. T.; Shau-hwai; Zaiton, Z.; Forensic investigation of aliphatic hydrocarbons in the sediments from selected mangrove ecosystems in the west coast of Peninsular Malaysia. Marine Pollution Bulletin, 2015, 100, 311–320.
CrossRef - Jeng, W. L.; Lin, S.; Kao, S. J.; Distribution of terrigenous lipids in marine sediments off northeastern Taiwan. Deep-Sea Research Part II: TopicalStudies in Oceanography, 2003, 50, 1179.
CrossRef - Tahir, N. M.; Pang, S. Y.; Abdullah, N. A.; Suratman, S.; Composition and sources of aliphatic lipids and sterols in sediments of a tropical island, southern South China Sea: Preliminary assessment. Journal of Environmental Monitoring and Assessment, 2013, 185, 10209–10216.
CrossRef - Sutilli, M.; Ferreira, P. A. L.; Figueira, R. C. L.; Martins, C. C.; Depositional input of hydrocarbons recorded in sedimentary cores from Deception and Penguin Islands (South Shetland Archipelago, Antarctica). Environmental Pollution, 2019, 253, 981–991.
CrossRef - Cozzarelli, I. M.; Baehr, A. L.; Volatile Fuel Hydrocarbons & MTBE in the environment. Treatise on Geochemistry, 2003, 9, 438.
CrossRef - Brewster, C. S.; Sharma, V. K.; Cizmas, L.; McDonald,T. J.; Occurrence, distribution and composition of aliphatic and polycyclic aromatic hydrocarbons in sediment cores from the Lower Fox River, Wisconsin, US. Environmental Science and Pollution Research, 2018, 25, 4974–4988.
CrossRef - Assunção, M. A.; Frena, M.; Santos, A. P. S.; dos Santos Madureira, L. A.; Aliphatic and polycyclic aromatic hydrocarbons in surface sediments collected from mangroves with different levels of urbanization in southern Brazil. Marine Pollution Bulletin, 2017, 119, 439–445.
CrossRef - He, J.; Zhang, S.; Zhang, X.; Qian, Y.; He, H.; Wu, H.; Composition and Distribution Characteristics and Geochemical Significance of n-Alkanes in Core Sediments in the Northern Part of the South Yellow Sea. Journal of Chemistry, 2016, 2016, 21–23.
CrossRef - Zhao, M.; Mercer, J. L.; Eglinton, G.; Higginson, M. J.; and Huang, C. Y.; Comparative molecular biomarker assessment of phytoplankton paleoproductivity for the last 160 kyr off Cap Blanc, NW Africa. Organic Geochemistry, 2006, 37, 74.
CrossRef - Walkley, A.; Black, I. A.; An Examination of the Degtjareff Method for Determining Soil Organic Matter, and a Proposed Modification of the Chromic Acid Titration Method. Soil Science, 1934, 37, 29–38.
CrossRef - Jha, P.; Biswas, A. K.; Lakaria, B. L.; Saha, R.; Singh, M.; Rao, A. S.; Predicting Total Organic Carbon Content of Soils from Walkley and Black Analysis. Communications in Soil Science and Plant Analysis, 2014, 45, 713– 725.
CrossRef - Sanip, M. M. M.; Fadzil, M. F.; Suratman, S.; Rozmi, N. S.; Tahir, N. M.; Distribution and sources of polycyclic aromatic hydrocarbons in coastal surface sediments off Terengganu. Malaysian Journal of Analytical Sciences, 2019, 23, 1120–1132.
- Tolosa, I.; De Mora, S.; Isolation of neutral and acidic lipid biomarker classes for compound-specific-carbon isotope analysis by means of solvent extraction and normal-phase high-performance liquid chromatography. Journal of Chromatography A, 2004, 1045, 71–84.
CrossRef - Commendatore, M. G.; Esteves, J. L.; Natural and anthropogenic hydrocarbons in sediments from the Chubut River (Patagonia, Argentina). Marine Pollution Bulletin, 2004, 48, 910–918.
CrossRef - Lazar, L.; Gomoiu, M. T.; Boicenco, L.; Vasiliu, D.; Total Organic Carbon (TOC) of the surface layer sediments covering the seafloor of the Romanian Black Sea coast. Geo-Eco-Marina, 2012, 18, 121–132.
- Tahir, N. M.; Pang, S. Y.; Simoneit, B. R. T.; Distribution and sources of lipid compound series in sediment cores of the southern SCS. Environmental Science and Pollution Research, 2015, 22, 7557–7568.
CrossRef - Commendatore, M. G.; Esteves, J. L.; and Colombo, J. C.; Hydrocarbons in coastal sediments of Patagonia, Argentina: Levels and probable sources. Marine Pollution Bulletin, 2000, 40, 989–998.
CrossRef - Yusoff, A. H.; Mohamad, S.; Assim, Z.; Aliphatic hydrocarbons in surface sediments from South China Sea off Kuching division , Sarawak. Malaysian Journal of Analytical Sciences, 2012, 16, 1.
- Guan, H.; Chen, L.; Luo, M.; Liu, L.; Mao, S.; Ge, H.; Zhang, M.; Fang, J.; Chen, D.; Composition and origin of lipid biomarkers in the surface sediments from the southern Challenger Deep, Mariana Trench. Geoscience Frontiers, 2019, 10, 351–360.
CrossRef - Huang, X.; Chen, S.; Zeng, Z.; Pu, X.; Hou, Q.; Characteristics of hydrocarbons in sediment core samples from the northern Okinawa Trough. Marine Pollution Bulletin, 2017, 115, 507–514.
CrossRef - Gearing, P.; Gearing, J. N.; Lytle, T. F.; Lytle, J. S.; Hydrocarbons in 60 northeast Gulf of Mexico shelf sediments: a preliminary survey. Geochimica et Cosmochimica Acta, 1976, 40, 1005–1017.
CrossRef - Baumard, P.; Budzinki, H.; Garrigues, P.; Origin and Bioavailability of PAHs in the Mediterranean Sea from Mussel and Sediment Records. Estuarine, Coastal and Shelf Science, 1998, 17, 77–90.
CrossRef - Keshavarzifard, M.; Zakaria, M. P.; Keshavarzifard, S.; Evaluation of Polycyclic Aromatic Hydrocarbons Contamination in the Sediments of the Johor Strait, Peninsular Malaysia. Polycyclic Aromatic Compounds, 1998, 6638, 1.
- Ruan, X.; Ye, H.; Lu, Q.; Yang, Z.; Historical record, source, and toxicity assessment of sedimentary organic matter using molecular composition of hydrocarbons in an urban lake, Wuhan, China. Journal of Soils and Sediments, 2018, 18, 2081–2092.
CrossRef - Hu, L.; Shi, X.; Lin, T.; Guo, Z.; Ma, D.; Yang, Z.; Perylene in surface sediments from the estuarine-inner shelf of the East China Sea: A potential indicator to assess the sediment footprint of large river influence. Continental Shelf Research, 2014, 90, 142–150.
CrossRef - Riyahi, A.; Pauzi, M.; Ismail, M.; Applied Geochemistry Vertical distribution and source identification of polycyclic aromatic hydrocarbons in anoxic sediment cores of Chini Lake , Malaysia : Perylene as indicator of land plant- derived hydrocarbons. Applied Geochemistry, 2009, 24, 1777–1787.
CrossRef - Liu, L. Y.; Wang, J. Z.; Wei, G. L.; Guan, Y. F.; Wong, C. S.; Zeng, E. Y.;Sediment records of Polycyclic Aromatic Hydrocarbons (PAHs) in the continental shelf of China: Implications for evolving anthropogenic impacts. Environmental Science and Technology, 2012, 46, 6497–6504.
CrossRef - Charriau, A.; Bodineau, L.; Ouddane, B.; Fischer, J.-C.; Polycyclic aromatic hydrocarbons and n-alkanes in sediments of the Upper Scheldt River Basin: contamination levels and source apportionment. Journal of Environmental Monitoring, 2009, 11, 1086–1093.
CrossRef - Ma, Y.; Halsall, C. J.; Xie, Z.; Koetke, D.; Mi, W.; Ebinghaus, R.; Gao, G.; Polycyclic aromatic hydrocarbons in ocean sediments from the North Pacific to the Arctic Ocean. Environmental Pollution, 2017, 227, 498–504.
CrossRef

This work is licensed under a Creative Commons Attribution 4.0 International License.
About The Author
![]()
A New Edition of Web of Science
Journal Impact Factor
2022: 0.5
Five Year: 0.8
Journal is Indexed in

Cabells Whitelist
![]()


