Time Domain Reflectometric Studies on Methylcellosolve – Acetylacetone Binary Solutions
Dineshkumar Pandi1*, Naganandhini paramasivam2, Sangeetha Tiruchithan1 and Arivazhagan Ganesan1*
1Department of Physics, Thiagarajar College, Madurai - 625009, Tamilnadu, India
2Department of Physics, Madurai Kamaraj University College, Madurai - 625002, Tamilnadu, India
Corresponding Author E-mail: arivuganesh@gmail.com
DOI : http://dx.doi.org/10.13005/ojc/370329
Article Received on : 19-Apr-2021
Article Accepted on :
Article Published : 03 Jun 2021
Time Domain Reflectometric studies has been applied on the binary solutions of methylcellosolve (MCS) with acetylacetone (ACACT) in the entire concentration range at 298 K in the frequency range of 10 MHz – 32 GHz. The values of relaxation time (τ), effective Kirkwood correlation factor (geff ), corrective Kirkwood correlation factor (gf ) and excess permittivity (εE ) have been calculated. The relaxation time of MCS slowly decreases with increase in ACACT concentration suggesting that the size of the heteroassociated rotating unit decreases. The rate at which τ value decreases is more in MCS rich solutions which means that the formation of heteromolecular H – bonds dominantly occur in MCS rich solutions. Parallel orientation among the dipoles occur as suggested by the g^eff values which are greater than unity in all the solutions. The excess permittivity ε^E values calculated using mole and volume fractions qualitatively exhibit the same deviation from ideal behaviour.
KEYWORDS:Dielectric Relaxation; Excess Permittivity; H-Bond, Molecular Interaction; Methylcellosolve
Download this article as:| Copy the following to cite this article: Pandi D, paramasivam N, Tiruchithan S, Ganesan A. Time Domain Reflectometric Studies on Methylcellosolve – Acetylacetone Binary Solutions. Orient J Chem 2021;37(3). |
| Copy the following to cite this URL: Pandi D, paramasivam N, Tiruchithan S, Ganesan A. Time Domain Reflectometric Studies on Methylcellosolve – Acetylacetone Binary Solutions. Orient J Chem 2021;37(3). Available from: https://bit.ly/3yWO7Rd |
Introduction
2-Methoxyethanol, also known as Methylcellosolve (MCS), is an organic compound which has H – bond donor as well as acceptor groups 1, the O -H, CH3 and CH2 are the donor groups and the C – O – C is the hydrogen bond acceptor group. It can be used as a solvent for electrolytes and has many industrial applications 2 – 4 . It is essential to know the interacting properties of MCS through intermolecular H – bonds, which are very important type of non-covalent interaction forces that operate among homo as well as hetero molecules and play an important role in determining the shape, structure and properties of molecules 5 – 7, with other molecules in fundamental research as well as industrial applications point of view. The interacting behaviour of MCS in the presence of various polar molecules has been studied by many researchers 8 – 11 using the techniques such as ab initio calculations, Raman spectroscopy, ultrasonic studies, FTIR studies etc. Each technique is capable of providing its own characteristic information regarding the molecular interactions. Dielectric spectroscopy is an effective tool that can be applied to obtain unique information regarding the fluid structure and has been employed to study the associating behaviour of MCS with chlorobenzene 12, a substituted benzene, and ethyl acetate 13 by our research group. In the present work MCS is dissolved in acetylacetone (ACACT), which belongs to the diketone class of compounds that exist as a mixture of keto and enol tautomers and is used as a chelating reagent for its ability of involving in coordinate complexation with metals 14, at various mole fractions and the associating behaviour of MCS in the solutions have been investigated with the help of the parameters obtained using dielectric spectroscopy.
Materials and methods
Acetylacetone and methylcellosolve (anhydrous 99.8%) were purchased from Sigma Aldrich Pvt. Ltd, USA and are used as received.The time-domain reflectometric studies on pure ACACT, MCS, and their binary solutions in the concentration range 0 ≤ X ≤ 1 of was carried out with the help of a Tektronix Digital Serial Analyzer DSA 8200 sampling mainframes with the sampling module 80E08 in the frequency range: 10 MHz – 32 GHz at 25oC 15, 16. The complex permittivity spectra ε* (ω) have been obtained using the method of non-linear least square fit 17, 18. Mass measurements have been made using a digital analytical balance supplied by Eagle Scale Manufacturing Works, Gujarat was used.
Theory
The complex dielectric permittivity spectra can be fitted using the Havriliak-Negami (HN) function 19
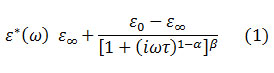
where α (0 ≤ α ≤ 1) and β (0 ≤ β ≤ 1) are the shape parameters, ω is the angular frequency, τ is the relaxation time, ε0 is the static dielectric constant and ε00 is the dielectric constant at high frequency. The Debye, Cole-Cole and Cole-Davidson relaxation models are described by (α = 0, β = 1), (0 < α ≤ 1, β = 1) and (α = 0, 0 < β ≤ 1), respectively.
The alignment of dipoles in a pure polar liquid can be obtained from the Kirkwood correlation factor g 20
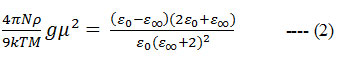
where μ, ρ, M and k are the gas phase dipole moment, density, molecular weight and the Boltzmann constant, respectively.
The dipolar alignment in a polar – polar binary liquid mixture is given by the effective Kirkwood correlation factor ( geff) 21
Here N and X are the Avogadro number and the mole fraction, respectively. a, b and m represent the liquid a, liquid b and the mixture, respectively. The corrective Kirk wood correlation factor g f 22 is calculated using the relation

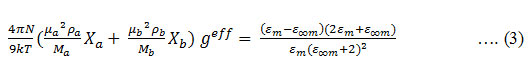
The excess permittivity is a parameter which can be used to investigate the heteromolecular interactions a solution has been calculated using the following four in formulae 22 – 25
where ϕ is the volume fraction. The excess permittivity values have been fitted using the Redlich-Kister equation 26, 27
with Bi as the Redlich-Kister coefficients.
Result and discussions
The variation of dielectric permittivity (ε’ ) and dielectric loss (ε” ) with the logarithmic frequency has been presented in Fig. 1.The Cole- Davison model has been used for all the solutions (0 ≤ X2 ≤ 0.9) except pure ACACT which was fitted using the Debye model. The static permittivity εm and relaxation time τ values for pure MCS and ACACT in the present work are found to be close to the literature values[28, 29]. The relaxation time (τ) of neat ACACT is 14.02 ps and that of neatMCS is 29.72 ps (Table 1)which is greater than τ value of ACACT. This higher relaxation time of MCS is due to the formation of multimers. Yaseen et al. [30] reported that the co-operative process of multimers O – H ⋯O linkage give rise to high relaxation time. So, the relaxation time can be used to investigate the size of the rotating molecular unit and not for identifying the specific H – bond interaction sites of the solution constituents. The value of τ slowly decreases towards the value of pure ACACT (Table 1) when its mole fraction is increased from 0 to 1. The rate at which the τ value decreases is more in MCS rich solutions when compared with that in ACACT rich solutions. This type of changes in τ value signifies that the size of the MCS multimer units got affected much in MCS rich solutions and this in turn means that the formation of heteromolecular H – bonds is more favoured in MCS rich solutions.
 |
Figure 1: The graph of a) dielectric permittivity (ε’) and b) dielectric loss (ε”) against LOG F for MCSAcac solutions at 298 K. |
Table 1: Density (ρ), Static permittivity (εom), permittivity at high-frequency limit (εo∞)and relaxationz time (τ), effective Kirk wood correlation factor (geff)and corrective Kirkwood correlation factor(g f ) for the binary mixture of MCS with Acac. Here, X2 / ϕ2 is the mole/volume fractions of Acac at 298 K
| X2 | ϕ2 | ρ (g/cm3) | εom | εo∞ | τ (ps) | geff | g f |
|
0.00 |
0.00 |
0.934 |
17.11 |
1.97 |
29.7 |
1.45 |
1.00 |
|
0.10 |
0.13 |
0.936 |
17.40 |
1.98 |
23.4 |
1.47 |
0.97 |
|
0.18 |
0.22 |
0.874 |
17.89 |
2.08 |
20.5 |
1.42 |
0.92 |
|
0.28 |
0.34 |
0.871 |
18.78 |
2.14 |
19.2 |
1.44 |
0.91 |
|
0.40 |
0.46 |
0.878 |
19.87 |
2.14 |
19.2 |
1.52 |
0.93 |
|
0.51 |
0.57 |
0.872 |
21.34 |
2.23 |
16.6 |
1.56 |
0.95 |
|
0.63 |
0.69 |
0.888 |
23.09 |
2.28 |
15.4 |
1.65 |
1.04 |
|
0.71 |
0.76 |
0.883 |
24.97 |
2.29 |
15.3 |
1.76 |
1.04 |
|
0.83 |
0.86 |
0.866 |
25.56 |
2.30 |
15.3 |
1.79 |
1.02 |
|
0.87 |
0.90 |
0.915 |
25.71 |
2.31 |
14.2 |
1.79 |
1.00 |
|
1.00 |
1.00 |
0.926 |
26.49 |
2.33 |
14.0 |
1.82 |
1.00 |
 |
Figure 2: The dependency of the dielectric constant (εom) of the binary solutions on the mole fraction of Acac at 298 K. |
Non-linear variation of εom with the mole fraction of Acac can be noticed (Fig. 2) in the 0 ≤ X2 ≤ 0.71 concentration range and linear change occurs in the remaining range of the concentration. The non-linearity of the εom vs X2 has been reported in terms of homo as well as heterointeractions in various articles [31-33]. In the present work, the non-linear change has been attributed to the presence of H – bond interactions of MCS with Acacwhile the linear variation is due to the relatively weaker hetero interactions. The 𝑔𝑒𝑓𝑓and g f values calculated using mole and volume fractions remain the same (Table 1). The 𝑔𝑒𝑓𝑓values of neat MCS and neat Acac are 1.45 and 1.82, respectively, which are the indicators that the dipoles of both MCS and Acac have parallel angular correlation. This parallel alignment of the dipoles continues to exist over the entire concentration range where the 𝑔𝑒𝑓𝑓values are greater than one. But the parallel angular correlation has been reported 12, 13 only in MCS rich solutions when it is mixed with chlorobenzene (dipole moment = 1.69 D)/ethyl acetate (dipole moment = 1.78 D) which are relatively less polar when compared with the Acac (dipole moment = 2.78 D). The value of g f , the measure of the degree of hetero interaction, is found to slightly deviates from unity indicating the presence of weak heteromolecular H – bond interaction forces in the binary solutions. The g f shows a bit more deviation in MCS + chlorobenzene/ethyl acetate 12, 13 binary solutions.
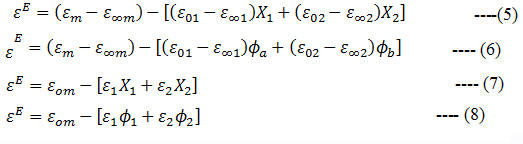
The excess dielectric permittivity εE values (Figs. 2 and 3) of the binary solutions computed using eqs. (5) – (8) qualitatively give the same information on the heteromolecular interactions with the exception of the point at which the transition from negative to positive regime takes place. Therefore, usage of mole fraction instead of volume fraction qualitatively causes no difference in the information regarding the heteromolecular interactions that are present in the binary solutions at different concentrations. According to most of the literature reports 23, 25, 34 – 37, the positive deviation of εE from ideal values is due to the formation of H – bonded structures with increased number of parallel aligned dipoles and the negative deviation is the result of the presence of heteromolecular interactions with a decrease in the number of parallel oriented dipoles. But our earlier research work 38 has confirmed that the interpretation of positive/negative εE values as the sign of increase/decrease of the number of dipoles is incorrect if the binary solutions consist of associative molecules. Therefore, the negative εE values for MCS rich solutions can be taken as the sign of i) formation of heteroassociated molecular networks with smaller dipole moments and ii) the decrease in the degree of alignment of dipoles 39, 40, that can be inferred from the relatively smaller 𝑔𝑒𝑓𝑓values in MCS rich solutions, while the positive deviation of εE values is the indication that heteromolecular complex has been formed with higher dipole moment 41.
 |
Figure 3: Plot of a) Excess permittivity εE=(εom-ε∞m) -[(ε1 – ε∞1) X1+((ε2-ε∞2) X2]against the mole fraction of Acac and b) excess permittivity εE=(εom-ε∞m) -[(ε1 – ε∞1) ϕ1+((ε2-ε∞2) ϕ2] against the volume fraction of Acac of MCSAcac binary solutions at 298 K. |
 |
Figure 4: Plot of a) Excess permittivity εE = εom-[ε1 X1 + ε2 X2] against the mole fraction of Acac b) excess permittivity εE = εom-[ε1 ϕ1 + ε2 ϕ2] against the volume fraction (ϕ2) of Acac in MCSAcac binary solutions at 298 K. |
Conclusions
Dielectric studies has been applied on the binary solutions of MCS with ACACT at different mole fractions of MCS/ACACT. The relaxation time of MCS slowly decreases towards the value of pure ACACT with the increase in its concentration. The rate of decrease in the τ value is found to be more in MCS rich solutions than in ACACT rich solutions and so the formation of heteromolecular H – bonds is more favoured in MCS rich solutions. The 𝑔𝑒𝑓𝑓 values suggest that the dipoles of the heteroassociated molecular networks have parallel angular correlation. The excess dielectric permittivity εE values have been calculated using the four formulae available in literature. All the four have qualitatively yield the same trend of deviation of εE values from the ideal values.
Acknowledgement
The authors thank Dr. A.C. Kumbharkhane, School of Physical Sciences, S.R.T.M. University, Nanded – 431606 , Maharashtra, India for providing instrumentation facility.
Conflict of interest
The authors declare that we have no conflict of interest.
References
- Sengwa,R. J.; Madhvi, Sankhla, S.; Sharma, S.; Bull. Korean Chem. Soc.2006, 27, 718.
- Srinivasa Krishna,T.; Narendra,K.; Gowrisankar,M.; Nain,A. K.; Munibhadrayya,B.; J. Mol. Liq.2017, 227, 333.
- Piekarski,H.; Tkaczyk,M.; Thermochim. Acta1987, 122, 377.
CrossRef - Piekarski,H.; Tkaczyk,M.; J. Chem. Soc. Faraday Trans.1995, 91, 2299.
CrossRef - Hobza,P.; Havlas,Z.; Chem. Rev.2000, 100, 4253.
CrossRef - Scheiner,S.; Hydrogen Bonding; Oxford University Press: New York, 1997.
- Hobza,P.; Sponer,J.; J. Chem. Rev.1999, 99, 3247.
CrossRef - Amorim da Costa,A.M.; Duarte,A.S.R.; Amado,A.M.; Vib. Spectrosc.2006, 42, 302.
CrossRef - Satyanarayana,G.R.; Bala Karuna Kumar,D.; Sujatha,K.; Lakshmanarao,G.; Rambabu,C.; J. Mol. Liq. 2016, 216, 526.
CrossRef - Balaji,R.; Gowri Sankar,M.; Chandra Sekhar,M.; Chandra Shekar,M.; J. Mol. Liq.2016, 216, 330.
CrossRef - Mohan Krishnan,K.; Ramababu,K.; Ramachandran, D.; Venkateswarlu,P.; Raman,G.K.; Fluid Phase Equilib.1995, 105, 109.
- Mahendraprabu,A.; Karthick,N.K.; Kannan,P.P.; Sangeetha,T.; Kumbharkhane,A.C.; Arivazhagan,G.; J. Mol. Struct.2020, 1205, 127565.
CrossRef - Mahendraprabu, A.; Sangeetha, T.; Kannan, P.P.; Karthick, N.K.; Kumbharkhane, A.C.; Arivazhagan, G.; J. Mol. Liq.2020, 301, 112490.
CrossRef - El-Hendawy,A.M.; J. Mol. Struc.2011, 995, 97.
CrossRef - Kumbharkhane,A.C.; Joshi,Y.S.; Mehrotra,S.C.; Yagihara,S.; Sudo, S.; J. Physica B, 2013, 421, 1.
- Rander,D.N.; Joshi,Y.S.; Kanse,K.S.; Kumbharkhane,A.C.; J. Mol. Liq.2014, 199, 367.
CrossRef - Cole,R.H.; Berberian,J. G.; Mashimo,S.; Chryssikos,G.; Burns,A.; Tombari,E.; J. Appl. Phys.1989, 66, 793.
CrossRef - Kumbharkhane,A.C.; Puranik,S.M.; Mehrotra,S.C.; J. Chem. Soc. Faraday Trans.1991, 87, 1569.
- Havriliak,S.; Negami,S.; J. Poly. Sci. Part C1966, 14, 99.
CrossRef - Frolhich,H.; Theory of dielectrics, Oxford University Press, London, 1949.
- Puranik,S.M.; Kumbharkhane,A.C.; Mehrotra,S.C.; J. Mol. Liq.1991, 50, 143.
CrossRef - Hasted,J.B.; Aqueous Dielectrics, Chapman and Hall, London, 1973.
- Ghanadzadeh Gilani, A.; Ghanadzadeh Gilani,H.; Ansari,M.; Ojani,N.; J. Chem. Thermodyn. 2012, 44, 44.
- Mahendraprabu,A.; Kumbharkhane,A. C.; Joshi,Y. S.; Shaikh,S. S.; Kannan,P. P.; Karthick,N. K.; Arivazhagan,G.; J. Mol. Struct.2017, 1136, 303.
CrossRef - Alonso,V.; González,J. A.; García de la Fuente,I.; Cobos,J. C.; Thermochim. Acta2012, 543, 246.
- Al-Azzawal,S.F.; Awwad,A.M.; Al- Dulaiji,A.M.; Al-Noori,M.K.; J. Chem. Eng. Data1990, 35, 463.
- Aralaguppi,M.I.; Aminabhavi,T.M.; Balundgi,R.H.; Joshi, Y.S.; J. Phys. Chem.1991, 95, 5299.
CrossRef - Mahendraprabhu,A.; Sangeetha, T.; Kannan,P.P.; Karthick,N.K.; Kumbharkhane, A.C.; Arivazhagan,G.; J. Mol. Liq.2020, 301,
CrossRef - David R. LIDE CRC Handbook Of Chemistry And Physics 85th Edition , 2005.
- Yaseen,S.A.; Under,P.B.; Saif,F.A.; Patil,S.S.; Khirade,P.W.; Ferroelectrics2017, 519, 49.
- Gilani, A.G.; Gilani, H.G.; Ansari, M.; J. Chem. Thermodyn.2012, 55, 203.
CrossRef - Gilani, A.G.; Ghanadzadeh, H.; Bahrpaima, K.; Ranjkesh, A.; J. Chem. Thermodyn.2010, 42, 967.
CrossRef - Gilani, A.G.; Gilani, H.G.; Ansari, M.; Ojani, N.; J. Chem. Thermodyn.2012, 44, 44.
- Shinde,M.; Talware,R.; Hudge,P.; Joshi,Y. S.; Kumbharkhane,A. C.; Pramana J. Phys. 2012, 78, 297.
- Joshi,Y.S.; Hudge,P.G.; Kumbharkhane,A.C.; Mehrotra,S.C.; J. Mol. Liq.2011, 163, 70.
CrossRef - Ghanadzadeh Gilani,A.; Ghanadzadeh,H.; Bahrpaima,Kh.; Ranjkesh,A.; J. Chem. Thermodyn. 2010, 42, 967.
- Sengwa,R.J.; Choudhary,S.; Dhatarwal,P.; J. Mol. Liq.2018, 252, 339.
CrossRef - Arivazhagan, G.; Shanmugam, R.; Elangovan,A.; Spectrochim.Acta Part A 2013, 105, 102.
CrossRef - Arivazhagan,G.; Elangovan,A.; Shanmugam,R.; Vijayalakshmi,R.; Kannan,P.P.; Chem. Phys. Lett.2015, 627, 101.
- Lata,S.; Singh,K.C.; Ahlawat,S.; J. Mol. Liq.2009, 147, 191.
CrossRef - Arivazhagan,G.; Shanmugam,R.; Thenappan,T.; J. Mol. Struct. 2011, 990, 276.
CrossRef

This work is licensed under a Creative Commons Attribution 4.0 International License.
About The Author
![]()
A New Edition of Web of Science
Journal Impact Factor
2022: 0.5
Five Year: 0.8
Journal is Indexed in

Cabells Whitelist
![]()


