Synthesis,Characterization, biocidal, Anti-diabetic, Anti-inflammatory and Anti-Cancer(MCF-7) Studies of Schiff base ligand and its metal (II) complexes
Karthik Somasundaram, Gomathi Thulasimani and Vedanayaki Subramaniam
Department of Chemistry, Kandaswami Kandar’s College, Velur, Namakkal-638182, Tamilnadu, India.
Corresponding Author E-mail: varshuvishal@gmail.com
DOI : http://dx.doi.org/10.13005/ojc/370107
Article Received on : 02-Dec-2020
Article Accepted on :
Article Published : 20 Feb 2021
A new Schiff base ligand (L1) was prepared from 3-aminoquinoline with 2, 5 dimethoxybenzaldehyde in 1:1 molar ratio. Two different co-ordination of mononuclear metal(II) complexes [(ML1) &(ML1L2)] [ M= Co(II), Ni(II), Cu(II) and Zn(II)] were synthesized & characterized. ML1wereprepared from L1 and metal acetate salts molar proportion One:Two. ML1L2 synthesized from L1, metal salts and 8-hydroxy quinoline (L2) molar ratiois 1:1:1. Elemental analyses, IR, NMR, Electronic spectra, Mass spectra, EPR, SEM and Powder XRD &molar conductivity are need to clarify the structure of synthesized metal(II) complexes. The squareplanar geometry is proposed for CuL1, NiL1, ZnL1, NiL1L2 and ZnL1L2, tetrahedral geometry for CoL1&CoL1L2 and distorted square planar geometry for CuL1L2complex. Powder XRD reveals that L1, ML1& ML1L2 have crystalline nature. Antibacterial activity of Ligand,ML1& ML1L2 were screened against bacterium Gram(+), Gram(-) &antifungal activity was determined against fungus. Theanti-inflammatory and anti-diabetic actions of the L1, CuL1 &CuL1L2complexes were studied. Theanticancer activity of L1, CuL1 and CuL1L2 were studied opposed toMCF-7 using MTT assay method.
KEYWORDS:Anti-cancer; Anti-diabetic; Co-ligand complexes; Schiffbase; Schiffbase complexes
Download this article as:| Copy the following to cite this article: Nagaraj A, Wilson S. A, Vaidyanathan L. Synthesis, Characterization, biocidal, Anti-diabetic, Anti-inflammatory and Anti-Cancer(MCF-7) Studies of Schiff base ligand and its metal (II) complexes. Orient J Chem 2021;37(1). |
| Copy the following to cite this URL: Nagaraj A, Wilson S. A, Vaidyanathan L. Synthesis, Characterization, biocidal, Anti-diabetic, Anti-inflammatory and Anti-Cancer(MCF-7) Studies of Schiff base ligand and its metal (II) complexes. Orient J Chem 2021;37(1). Available from: https://bit.ly/2NyCdu4 |
Introduction
Schiff bases obtain by the condensation of amino and carbonyl compounds are intrinsic class of ligand that coordinate to metal ions via azomethine nitrogen and have been extensively for its wide range of medicinal applications.[1]
In the past years, many new antibiotics failed to meet the challenges posed by multi drug-resistant bugs, such drugs are needed which are enough to work against & control antibiotic resistance[2]. Over the years, Schiff base and their metal complexes have amazing properties like catalysts in different biological systems, polymers, dyes, antimicrobial activities, anti tumor, cytotoxic and drug fields [3], [4], [5].
Quinolines are a class of nitrogen heterocycles, present in a large number of natural and synthetic compounds that exhibit antimicrobial, antibiotic, anti malarial, antitumor, immuno suppressive, analgesic, anti convulsant and anti hypertensive activities[6].
Schiffbase complexes are play an important role in biological, pharamecutical, agrochemical and organic industries and to design of new mixed ligand complexes greater potential application in this field.[7]
In the this work, mononuclear metal(II) complexes withL1 and with a co-ligand (8-hydroxy quinoline) were prepared. The prepared ML1& ML1L2 have been characterized by physicochemical properties and in-vitro antimicrobial activity, anti-inflammatory, anti-diabetic and anti-cancer activities of metal complexes were also studied.
Materials and Methods
The 3-aminoquinoline and 2,5-dimethoxy benzaldehyde utilized for the preparation of ligand were purchased from TCI chemicals. The Metal acetate salts were purchased from Sigma Aldrich. All the solvents were purchased from Loba and used without further purification. 8-Hydroxyquinoline used in the present work was acquired from S.D Fine chem. Limited.
The percentage of C, N, O, and metal was determined by a FEI Quanta-250 FEG elemental analysis apparatus. The absor bention spectra of the L1, ML1& ML1L2 dissolved in dimethylformamide were recorded on the JASCO V 650 in the range of 200 – 800 nm. Vibrational spectra of the compounds was recorded in Bruker Tensor 27 in the range of 4000- 400 cm-1. 1H &13C NMR spectra were recorded on the Bruker 300 Hz spectrometer using DMSO-d6 as a solvent. Mass spectrum was recorded for the L1, ML1& ML1L2using 410 Prostar Binary LC with 500MS IT PDA Detectors. TG/DTA analysis was carried out under nitrogen atmosphere using Shimadzu TG-50 thermobalance. The surface nature of the compounds were determined by CAREL ZEISS EVO 18 Scanning electron microscope.
Synthesis of L1
The ligand (E)-1-(2,5-dimethoxyphenyl)-N-(quinolin-3-yl) methanimine was prepared using 2,5-dimethoxybenaldehyde and 3-aminoquinoline. 1mmol of 2,5-dimethoxybenaldehyde (0.166 g) dissolved in 20 ml of methanol was mixed drop wise into 1mmolCH3OH solution of 3-aminoquinoline (0.144 g). The mixture was stirred continuous by and refluxed for 3 h at 50 – 70 °C, product obtained was filtered and dried.
Synthesis of ML1
Methanolic solution of ligand (E)-1-(2,5-dimethoxyphenyl)-N-(quinolin-3-yl)methanimine (2mmol, 0.584g) was added to the methanolic solution of Metal(II) acetate salts (1 mmol) of Cu(II), Ni(II),Co(II) and Zn(II) in the molar ratio 2: 1. All complexes were stirred and refluxed at 70 °C for about 4 hours. The hot solution was cooled and dried at room temperature.
Synthesis of mixed ML1L2
The methanolic solution of (1mmol) (E)-1-(2,5-dimethoxyphenyl)-N-(quinolin-3-yl) methanimine (L1) was added to the methanolic solution of Metal(II) acetate salts (1mmol) of (Cu(II), Ni(II), Co(II), and Zn(II)) in the RB Flask. 8-Hydroxy quinoline (L2) (1mmol) dissolved in methanol was mixed dropwise into the above mixture. The ligand, metal salt and 8-hydroxyquinoline were taken in the ratio 1 : 1 : 1. The mixture was stirred and refluxed for 3 h then dried at room temperature.
 |
Figure 1: Synthesis of Schiff base ligand[L1], [ML1] &[ML1L2]complexes. |
Results and Discussion
The analytical data of the L1, ML1& ML1L2 are given in Supplementary Table 1. ML1& ML1L2 are coloured and sparingly soluble in ethanol, methanol, acetone, chloroform and soluble in DMSO and DMF but insoluble in water.
Molar Conductance
Molar conductance was measured at 1×10⁻³ M for ML1& ML1L2 in DMSO at room temperature.The mononuclearmetalcomplexes exhibit low value inthe range of 11-23 ohm-1 cm2 mol-1[8] indicates that ML1& ML1L2are non-electrolytic as given in Supplementary Table 1.
FT – IR spectral studies
The IR spectra of complexes are studied with L1 to determine the co-ordination sites that may be involved in chelation. The FT-IR data with the assignments of band frequencies of L1, ML1& ML1L2 complexes are presented Supplementary Table 2 and the spectrum, are shown in Supplementary Figure 1.
The sharp peak observed at 1581cm-1 in the IR spectra of L1 assigned to υ(CH=N) is shifted to lower frequency for ML1& ML1L2, indicating the involvement of azomethine nitrogen in chelation with the metal ion [9]. However, stretching frequency of methoxy (-OCH3) group appeared in the range of 2828-2833cm-1 as observed in L1, [ML1] and [ML1L2] complexes, indicates the non-participation of methoxy oxygen in co-ordination [9]. The new bands in IR spectra of ML1& ML1L2 in regions 493-533 cm -1 and 472- 497 cm -1 are ascribed to υ(M-O) and υ(M-N) respectively, which indicates the co-ordination of L1, co-ligand with the metal ion[10].
Electronic spectral studies and magnetic moment
The Absorption spectrum of the L1, ML1 and ML1L2 were recorded in DMSO solution over the range of 200-800 nm and the spectral data are listed in Supplementary Table 3 and shown in Figure 2.The UV spectra of L1 reveals high intense absorption peaks at 270 nm (37037 cm-1) and 369 nm (27100 cm-1) which are due to π-π* and n-π* transitions respectively. But in metal complexes, azomethine peak was shifted to shorter wavelength, this shift is attributed to the coordination of the nitrogen atom of the imine group with the metal ion.
The Absorption spectra of Cu(II) complexes [CuL1] and [CuL1L2] exhibit two bands, the charge transfer region at 439 nm for CuL1 complex and another band in the region 594 nm assigned to 2T2g→ 2Eg transition indicating the square planar geometry and the magnetic value is 1.95 B.M. Another Cu(II) complex CuL1L2exhibits intense broadband at 440 nm which maybe reasonably assigned to2B1g → 2A1g transition, corresponds to a distorted squareplanar geometry for Cu(II) ion and the observed magnetic moment value is 1.81 B.M.[11].
The visible spectra of Ni(II) complexes, [NiL1] and [NiL1L2] show three bands. One intense peak show 381-392 nm due to charge transfer transition and the d-d transition exhibits in the range of 470-550 nm are assigned to 3 A2g (F) →3T1g(P) and3A2g(F) → 3T1g(F) transitions respectively, consistent with a square planar geometry around Ni(II) ion, which are further supported by the magnetic value range between 3.81-3.05 B.M.[12]
The UV spectrum of cobalt(II) complex [CoL1] shows three intense peaks and [CoL1L2] complex shows two intense peaks. One peak at 382-393 nm for complexes CoL1 and CoL1L2 is due to charge transfer transition and another two peaks exhibited transition in the visible region at 450-457 nm and 510-511 nm corresponding to tetrahedral geometry for Co(II) ion.The magnetic moment value of Co(II) complexes are in the range of 4.41 – 4.83 B.M.[13]
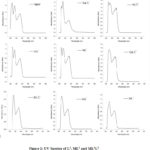 |
Figure 2: UV Spectra of L1, ML1 and ML1L2 |
The UVspectrum of Zn(II) complexes [ZnL1] and [ZnL1L2] shows bands in the range 392-482 nm may be due to L→ M charge transfer which indicates square planar geometry and it is diamagnetic nature[14].
1 H NMR
The structure of the Schiffbase ligand is fairly supported by 1H NMR spectra recorded in CDCl3 as a solvent. On examining the 1H NMR spectrum of the ligand it exhibited a multiplet signal at δ (8.51 – 6.93) ppm for aromatic protons. The presence of azomethine(CH=N) group is indicated by a singlet at δ (8.92) ppm. Which confirms the formation of imine ligand. A signal at δ (3.81) ppm indicates the presence of methoxy ( O-CH3) protonsas shown in Supplementary Figure 2.
13C NMR
In 13C NMR, the number of signals represents the number of carbons of the synthesized compound which are non-equivalent. The signal that appeared at δ (158.34) ppm is attributed to azomethine carbon. Signals observed at δ = 110 – 129 ppm are assigned for aromatic carbons. Phenyl ring of ligand showed the following signals 146.61(CH=N), 147.15,145.73 (C-N). The methoxy carbons show peaks at 56.25 and 55.94 ppm as shown in Supplementary Figure 3.
Mass Spectra
Mass spectral data gives valuable information on molecular weights, the synthesized ligands and its metal(II) complexes were characterized by ESI–MS spectrometry in positive ion mode [15]. The ESI mass spectra of the L1, ML1& ML1L2 were recorded and the obtained molecular peaks confirmed the proposed structures. The ESI mass spectrum of the Schiffbase ligand shows an intense peak at 294.05. The mass spectrum of the CuL1, NiL1, CoL1, ZnL1, CuL1L2, NiL1L2, CoL1L2 and ZnL1L2 complexes gives a molecular ion peak at 781.99, 833.28, 835.03, 802.84, 636.14, 678.48, 683.43 and 647.24 m/z respectively which indicate the stoichiometry composition of complexesas shown in Supplementary Table 4 and Supplementary Figure 4.
EPR Spectra
EPR spectrum of Cu(II) complexes were recorded in the solid-state at room temperature as shown inSupplementary Figure 5.The CuL1 & Cu L1L2 complexes gives gǁ = 2.0610, 2.06145 and g﬩ = 2.00975, 2.02272 respectively.The gǁvalues of these complexes lie below 2.3 (gǁ< 2.3)which indicates the covalent environment around the Cu(II) ion [16]. The calculated G (G = g‖ -2.0023/g┴-2.0023) value is 7.88 for CuL1 complex and 2.86 for CuL1L2 complex which indicates squareplanar geometry for CuL1 complex and distorted square planar geometry for CuL1L2 complex.
SEM
The surface morphology of the synthesized L1, ML1& ML1L2 was done by scanning electron microscopy. The synthesized L1, ML1& ML1L2 were carried out and the obtained images are shown in Figure 3. The SEM images indicates that the L1, ML1& ML1L2 have different distinctive surface morphology[15].
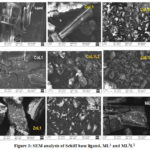 |
Figure 3: SEM analysis of Schiff base ligand, ML1 and ML1L2 |
The powder XRD for the L1, ML1 and ML1L2 were performed. The synthesized compounds show well explicatescrystalline peaks indicating that the samples are crystalline.The ligand and all synthesized complexes have specific‘d’ values which can be used for its characterization. The crystalline size of the ligand and their complexes dXRD could be estimated from XRD patterns by the Scherrer’s formula[17]. The value of crystalline size of the ligand and all complexes are (Ligand=100.74, CuL1=49.87, NiL1=74.45, CoL1=78.02, ZnL1=64.44, CuL1L2= 64.92, NiL1L2= 47.72, CoL1L2= 29.65, ZnL1L2= 41.03) respectively as shown in Supplementary Table 5 and Supplementary Figure 6.
Antimicrobial activity
The ligand,ML1& ML1L2 were screened for antimicrobial activity by disc diffusion method and are compared with standards tetracycline and fluconazoleas shown in Figure 4.The results are presented inSupplementary Table 6.
The antibacterial and antifungal actions of the Schiff base ligand, ML1& ML1L2 were tested against Gram(+) bacteria (Staphylococcus-aureus), Gram(-) bacteria (Escherichia-coli) and one fungus (Candida-albicans). All metal(II) complexes show maximum inhibition zone than the free ligand. ML1L2 complexes show good activity compared to the ML1 complexes because L2(8-Hydroxyquinoline) acted as a co-ligand in ML1L2complexes. From the above results, it is concluded that CuL1L2complex exhibits the highest antimicrobial activity.
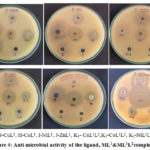 |
Figure 4: Anti-microbial activity of the ligand, ML1&ML1L2complexes. |
Anti-inflammatory activity
The synthesized Schiff base-ligand and its Copper(II) complexes [CuL1& CuL1L2] were examined for anti-inflammatory activity by HRBC stabilization method at various concentrations (20, 40, 60, 80, 100 μg / ml). Diclofenac sodium was used as a standard. The percentage inhibition of hemolysis by the ligand, ML1&ML1L2are presented in Supplementary Table 7. In all the concentration of CuL1 and CuL1L2 complexes show a maximum % inhibition of hemolysis compared to the free ligand. The CuL1L2 complex shows a minimum IC50 value of 28.50μg/ml and the complexes stabilized human blood cell membrane in a dose-dependent manner[18]. Thus CuL1L2 complex shows the best anti-inflammatory activity.
Anti diabetic Studies
The antidiabetic activity was examined by the standard amylase inhibition assay. The inhibition activity of the synthesized compounds against α-amylase is given in Supplementary Table 8. Both copper(II) complexes exhibit more inhibition activity than the free Schiff base ligand. CuL1L2 complex shows excellent amylase inhibition activity. CuL1 complex shows fine activity as compared to the schiffbase ligand. The IC50 value of the free Schiffbase, CuL1 and CuL1L2 complexes are 54.80, 11.91 and 3.86μg/ml respectively.
Anticancer activity
Anti-cancer activity of the (E)-1-(2,5-dimethoxyphenyl)-N-(quinolin-3-yl)methanimine, CuL1 and CuL1L2 metal complexes were tested against MCF-7 (breast cancer) at different concentrations (3.125, 6.25, 12.5, 25, 50μg/ml)as shown in Figure 5. The viability of the cancer cells by ligand and its metal complexes are 100% at zero concentration. (97.85, 90.40, 71.81, 46.72, 33.49 %) for ligand, (97.09, 87.39, 70.84, 48.98, 26.93 %) for CuL and (89.91, 74.46, 59.78, 37.58, 24.34%) for CuL1L2 when the concentration increases the cell viability of cancer cells decreases, that mean the cytotoxicity of the cells decreases and the complex is potential which is due to less number of live cells[19]. The in-vitro anticancer studies reveal that the CuL1 and CuL1L2 have moderate activity than the ligand. Particularly CuL1L2 complex are highly active with IC50 value 24.92 μg/ml compared to the free ligand and CuL1 complex.
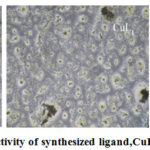 |
Figure 5: Anti-Cancer activity of synthesized ligand,CuL1and CuL1L2complexes. |
Conclusions
Schiff base complexes of (b-e) obtained from (E)-1-(2,5-dimethoxyphenyl)-N-(quinolin-3-yl)methanimine in a ratio (1:2) and co-ligand complex with 8-hydroxy quinoline at ratio (1:1:1) have been synthesized and characterized. The stoichiometry of all complexes are confirmed by elemental analysis. All the metal complexes are non-electrolyte nature dependent upon molar conductance value. The physicochemical data reveals that CuL1, NiL1, ZnL1, NiL1L2, ZnL1L2, complexes have square planar geometry, CoL1& CoL1L2 complexes have tetrahedral geometry, CuL1L2 complex have distorted square planar geometry. The powder XRD pattern showed the crystalline nature of the L, ML1&ML1L2. By using the SEM analysis, morphology of all complexes is have been studied. The synthesized ligand and their ML1 and ML1L2 metal complexes were tested against gram(+), gram(-) and one fungus strain. The data showed that CuL1 and CuL1L2 exhibits better activity than other compounds. CuL1L2 shows high zone of inhibition compared to the CuL1 complex. The anti-inflammatory, anti-diabetic and anticancer studies of ligand, CuL1and CuL1L2 were done. From the studies, it is suggested that CuL1L2shows better activity than the free ligand and CuL1. Finally, it is concluded that CuL1L2 may be used as effective biological agents with reduced toxicity and higher efficiency.
Supplementary Information
Additional files : Table S1- S9. Additional Figure S1 and S6.pdf
Acknowledgement
None
Conflict of Interests
None
References
- Sushil K.Ghumbre, S.R.Ujgare, Int. Res. J. Pharm, 2018, 9, 202.
CrossRef - Mohammad Azam and Saud I. Al-Resayes, Molecules,2018,23, 813.
CrossRef - Biot C, Castro W, Botté C Y, and Navarro M, Dalt. Trans.,2012, 41, 6335.
CrossRef - H. B. Albada, P. Prochnow, S. Bobersky, J. E. Bandow, and N. Metzler-Nolte, Chem. Sci., 2014, 5, 4453.
CrossRef - Saeed-ur-Rehman, Alia Faiz, Robila Nawaz, and Nauman Ali Institute, Syn and React Inorg, Metal-Organic, and Nano-Metal Chem., 2013, 2015,37.
- Yernale N G, Bennikallu M, and Mathada H, Bioinorg Chem and Appl., 2014, 2014,1.
CrossRef - A. A. Maihub, U. K. Mahanta, G. Badhei, Rasayan j. chem 2018, 11,166.
- Seethalakshmi M and Amaladhas T P, Orient. J. Chem.,2018, 34, 1411.
CrossRef - Battin SN, Manikshete AH, Asabe M R, and Sathe D J,Inter J Engi Sci Invent.,2018, 7, 10.
CrossRef - Chaudhari D, Murke A G and Shankarrao O, Pelagia Research Library.,2013, 4,79.
- Rai S, Bajpai A, and Lokhandwala S, J. Polymers., 2013, 2013.
CrossRef - Mahalaksmi N, Kuppusamy M R, Sureshkumar R, Vanitha C, Inter Res J Engi Tech., 2017,4, 1519.
- Vedanayaki S and Jayaseelan P, Eur. J. Chem., 2016, 7,368.
CrossRef - Demir I, and Pekacar A I, Syn and React Inorg, Metal-Organic, and Nano-Metal Chem2005, 35,825.
CrossRef - Abdel Aziz and Seda S, J. Fluoresc., 2017, 27, 1051.
CrossRef - Vamsikrishna N, Kumar MP, Ramesh G, Ganji N, Daravath S and Shivaraj, J. Chem. Sci., 2017,129, 609.
CrossRef - Blessy C, Isac Sobana Raj and Allen Gnana Raj, Der Pharma Chem., 2016, 8, 364.
- Gangrade D and Lad S, J. Chem. Pharm. Res., 2016, 8,1132.
- Prakash BS, Inter J Inno Res Sci, Engi and Tech., 2019, 8, 6870.

This work is licensed under a Creative Commons Attribution 4.0 International License.
About The Author
![]()
A New Edition of Web of Science
Journal Impact Factor
2022: 0.5
Five Year: 0.8
Journal is Indexed in

Cabells Whitelist
![]()


