Stability Indicating Method Development, Validation and Forced Degradation Study for Vilazodone Hydrochloride API
Yogesh Jagdish Chaudhari1* , Rama Sadashiv Lokhande1 and Ravi Ramrathi Yadav2
1Department of Chemistry, Jaipur National University, Jaipur, 302017, India.
2Associate Director, Cipla Ltd, Mumbai, 400083, India.
Corresponding Author E-mail: yogeshjc@gmail.com
DOI : http://dx.doi.org/10.13005/ojc/370128
Download this article as:
![]()
The current study describes the short, stability indicative HPLC method development and successive validation of Assay and Related Substances methods for Vilazodone Hydrochloride API. This study also covers Vilazodone process impurities viz. Impurity A and Impurity B.
The chromatographic conditions for Related Substances and Assay are similar except sample concentration. The proposed method utilizes C18 column (15 cm X 4.6 mm, 5 µ, make ZORBAX SB) and mobile phase having Methanol and 0.05 M KH2PO4 (55: 45 v/v). The separation between all three analytes was achieved in less than five minutes.
The analytical validation of these method was carried out successfully as per ICH and other international guidelines. The API was subject to various stress conditions like temperature, humidity, acidic and basic hydrolysis, oxidative degradation. The exposed samples analysed for impurities and assay. The mass balance for each condition was found more than 98%.
Forced Degradation; Impurity A; Impurity B; Mass Balance; Mass; Stability Indicating; Vilazodone Hydrochloride
Introduction
Vilazodone is classified as anti-depression drug. Vilazodone is 5HT1A receptor partial agonist and selective serotonin reuptake inhibitors (SSRIs).Vilazodone maintains mental balance by increasing amount of natural substance Serotonin. [1] It was developed by Allegran and marked under trade name VIIBRRD.
Vilazodone Hydrochloride is chemically 2-benzofurancarboxamide, 5-[4-[4-(5-cyano-1H-indol-3-yl) butyl]-1-piperazinyl]-hydrochloride. Molecular weight of Vilazodone hydrochloride is 477.99 [2]
 |
Figure 1: Structure of Vilazodone HCl. |
Depend on synthetic route, various process related impurities may form during synthesis of Vilazodone API.[3] Vilazodone Acid is an intermediate step during synthesis of API; hence it is most likely to be present as an impurity in Vilazodone HCl. This process impurity (henceforth referred as ‘Impurity A’) has chemical name 5-(4-(4-(5-cyano-1H-indol-3-yl) butyl) piperazin-1-yl) benzofuran-2-carboxylic acid. Vilazodone impurity A is having molecular weight as 442.51.
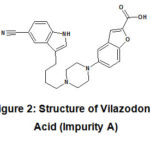 |
Figure 2: Structure of Vilazodone Acid (Impurity A) |
Vilazodone ester (Impurity B) is also a process impurity. It is chemically Ethyl 5-(4-(4-(5-cyano-1H-indol-3-yl)butyl)piperazin-1-yl)benzofuran-2-carboxylate. The molecular weight of Impurity Bis 470.56.
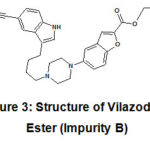 |
Figure 3: Structure of Vilazodone Ester (Impurity B) |
Literature Review
Assessment of available literatures revel that most of the method available for Vilazodone on spectroscopic determination. [4-6] Although the spectroscopic methods are simple, these are only used for determination of content, that too methods are not specific. These methods are not suitable to determine process impurities or degradation products. Hence these methods are not considered as stability indicative methods.A method capable of quantitatively detecting any physiochemical change in drug is called as stability indicating method. Due to method’s specificity the content of drug and impurities are precisely quantified.[7]Another critical attribute is mass balance, which indicates closeness for summation of drug content value and total impurities value, to 100.
Few HPLC methods are available for analysis of Vilazodone Tablets. [8-10] The stability indicative nature of some methods was demonstrated by forced degradation. [11-12] However, none of the literature, adequately address mass balance of these analytical methods. Nevertheless, none of the available literature, demonstrate its suitability with respect to process impurities viz. Impurity A & Impurity B.
The present research was devised to develop and validate simple yet robust, precise, cost-efficient, stability indicating analytical techniques for Related Substancesand Assay of Vilazodone Hydrochloride API. This study is the first-time report on specificity of analytical method in presence of Vilazodone process impurities (Impurity A and Impurity B) as well as degradation impurities.
The stability indicating nature of the methods was demonstrated by exposing Vilazodone API to various stress conditions like Heat, light, high temperature and humidity, acidic hydrolysis, base hydrolysis, and oxidative degradation. The stressed samples were analysed for both Related Substances and Assay to calculate mass balance. All generated degradation impurities were well resolved from Vilazodone. The results of analytical validation for both methods accords the requirement of various international Guidelines. [13-15]
Materials and Methods
Vilazodone hydrochloride API was received from KPS Chemicals& Pharmaceuticals, Gujrat and Vilazodone HCl, Impurity A and Impurity B standards was providedby SynZeal Research Private Limited, Gujrat. Methanol, Potassium Dihydrogen Phosphate, orthophosphoric acid were procured from Merck. Millipore grade water was used for analysis. For development and validation, Waters alliance HPLC (model 2695) equipped ultra-violate photodiode array detector and Empower software was used.
Since in various literatures, pKa value of Vilazodone is reported as 7.1, the acidic pH (3.0) was selected. .The absorption spectra of individual analyte (Vilazodone, Impurity A and Impurity B) was checked in ultraviolet region. Based on isosbestic point, the wavelength of HPLC detection was finalised as 235 nm.
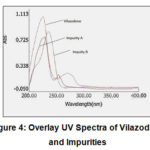 |
Figure 4: Overlay UV Spectra of Vilazodone and Impurities. |
During methoddevelopment,various columnslike Inertsil ODS, ZodiacSil C8, Zorbax SB C18 were screened. Mobile phase having different concentrations of water or monopotassium hydrogen phosphate bufferand Acetonitrile or Methanol were tried to for separation. The trail which yields best chromatography in terms of peak shape, resolution, shorter retention time was concluded and listed below.
The isocratic mixture of 0.05 M monopotassium phosphate having pH 3.0 + 0.05 (adjusted with orthophosphoric acid) and Methanol in ratio of 45:55 v/v respectively was used as mobile phase.Agilent Zorbax SB C18 column (15 cm X 4.6 mm, 5 µ) was maintained at ambient temperature. The flow rate was kept at 1.0 ml/min, and UV detector was set at 235 nm. Mobile phase was used as diluent. Retention time of Vilazodone, Impurity A and Impurity B was found to be about 2.5 min, 3.2 min and 4.4 min, respectively.
Preparation of Standard solutionfor Assay
About 10 mg of Vilazodone Standard was weighed accurately and transferred into 10 ml volumetric flask. About 2 ml of diluent was added to it. The content was dissolved with sonication and further diluted to the volume. 1.0 ml of this solution was pipetted out and further diluted to 10 ml.
Preparation of Standard solutionfor Related Substances
About 10 mg of Vilazodone Standard, Impurity A standard and Impurity B Standard were accurately weighed and transferred into three separate 10 ml volumetric flasks. To dissolve the content in each flask, about 2 ml of diluent was added and sonicated.The volume was made up with diluent. Further 1.0 ml of each solution was pipetted out and diluted separately in 100 ml volumetric flask. 1.0 ml from each flask was transferred using pipet in a 10 ml volumetric flask and diluted up to the mark with diluent.
Preparation of Sample solution
About 10 mg of Vilazodone HClsample was weighed accurately and transferred into 10 ml volumetric flask. About 2 ml of diluent was added to it. The content was dissolved with sonication and further diluted to the volume. This sample solution was used for Related Substances analysis For Assay, 1.0 ml of above solution was further diluted to 10 ml.
Method Validation
Both methods were validated for Specificity, Linearity and Range, LOD & LOQ (for Related substances only), Precision (Repeatability -Intermediated Precision), accuracy, Solution stability and Robustness (at least two changes on both positive and negative side). The methodology and acceptance criteria of all parameters were as per ICH Q2(R1), USFDA and WHO guidelines. [14-16]
Forced Degradation Study
Forced degradation was done in Solid state and liquid state. [11-12] After exposure samples were analysed for % degradation by Related Substances method and content by Assay Method.
Solid State Conditions
Elevated Temperature: Vilazodone was taken in Petri dish exposed to 80o C for 48 hours.
UV- Visible light:
Photo exposure was done as per ICH Q1B (option 1). Sample was kept in photostability chamber and was exposed to complete one cycle i.e., illumination of not less than 1.2 million lux hours and an ultraviolet energy of not less than 200-watt hours/square meter.
High Temperature and humidity:
Sample was kept in controlled humidity chamber set at 40o C and 80 % RH (Relative humidity) for 5 days.
Liquid degradation
Acid Hydrolysis
Sample was dissolved in minimum amount of diluting solution. Then HCl was added in Sample solution. Sample was refluxed on water bath. After refluxing was completed, it was allowed to cool and neutralised NaOH, using litmus paper.
Base hydrolysis
Sample was dissolved in minimum amount of diluting solution. Then NaOH was added in sample solution. Sample was refluxed on water bath. After refluxing was completed, it was allowed to cool and neutralised HCl, using litmus paper.
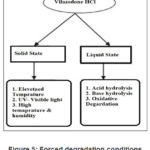 |
Figure 5: Forced degradation conditions for Vilazodone |
Oxidative Degradation
Sample was dissolved in minimum amount of diluting solution. Then H2O2 was added in sample Solution. Sample was refluxed on water bath. It was then allowed to cool. The concentration of reagents and refluxing time was optimised to get desired degradation.
Results and Discussion
Method validation for Assay of Vilazodone
Specificity:
There was no interference of Blank (Diluent), Impurity A and Impurity B at RT of Vilazodone.
Linearity
Linearity was performed from 50% to 250 % of Assay concentration i.e., 100 ppm
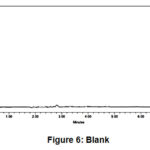 |
Figure 6: Blank. |
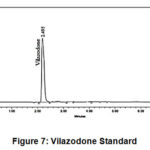 |
Figure 7: Vilazodone Standard. |
 |
Figure 8: Impurity A Standard. |
 |
Figure 9: Impurity B Standard. Click here to View figure |
Table 1: Peak area response of Vilazodone in Linearity Standards.
|
Sr. No |
Linearity Level |
Concentration(ppm) |
Area |
|
1 |
I |
50.35 |
11543 |
|
2 |
II |
100.7 |
21533 |
|
3 |
III |
151.05 |
31999 |
|
4 |
IV |
201.4 |
42124 |
|
5 |
V |
251.75 |
52139 |
|
Correlation Coefficient |
0.9999 |
||
 |
Figure 10: Linearity of Vilazodone Standards (Assay). Click here to View figure |
Precision
Repeatability: Five replicate preparation of Standard solution was injected. Sample was analysed by making Six sample preparations.
Intermediate Precision: Above study was repeated on different day using different lot of same column. All preparations were newly made. Five replicate preparation of Standard solution was injected. Sample was analysed by making Six sample preparations.
Table 2: % RSD for area of Vilazodone of Five replicates of Standard preparations.
|
|
Repeatability |
Intermediate Precision |
|
|
Area of Vilazodone |
Area of Vilazodone |
|
1 |
21478 |
21519 |
|
2 |
21513 |
21632 |
|
3 |
21397 |
21599 |
|
4 |
21610 |
21712 |
|
5 |
21555 |
21622 |
|
Mean |
21510.6 |
21616.8 |
|
SD |
80.351 |
69.287 |
|
% RSD |
0.37 (NMT 0.73) |
0.32 (NMT 0.73) |
|
|
Theoretical plates from injection 1: 8140 (NLT 2000) |
Theoretical plates from injection 1: 8165 (NLT 2000) |
|
|
USP tailing factor from injection 1: 1.3 (NMT 2.0) |
USP tailing factor from injection 1: 1.3 (NMT 2.0) |
Table 3: % RSD for Assay value from Six Sample Preparation.
|
|
Repeatability |
Intermediate Precision |
|
|
% Assay |
% Assay |
|
1 |
99.80 |
99.50 |
|
2 |
99.58 |
99.07 |
|
3 |
99.87 |
99.89 |
|
4 |
98.85 |
99.60 |
|
5 |
99.25 |
99.09 |
|
|
99.73 |
99.64 |
|
Mean |
99.51 |
99.47 |
|
SD |
0.39 |
0.32 |
|
% RSD |
0.40 (NMT 2.0) |
0.32 (NMT 2.0) |
|
|
% Variation between Assay Value of Repeatability and Intermediate Precision= 0.04 |
|
Accuracy
Accuracy was performed by weighing 50%, 100 % and 150 % of desired sample weight, i.e., 5mg, 10 mg and 15 mg of sample.
Table 4: Accuracy of Assay method.
|
% Assay (Experimental) |
% Assay (Theoretical) |
% Recovery |
|
|
Acc1-Rep1 |
49.75 |
50 |
99.51 |
|
Acc1-Rep2 |
50.01 |
50 |
100.01 |
|
Acc1-Rep3 |
49.44 |
50 |
98.88 |
|
Acc2-Rep1 |
99.55 |
100 |
99.55 |
|
Acc2-Rep2 |
99.15 |
100 |
99.15 |
|
Acc2-Rep3 |
99.04 |
100 |
99.04 |
|
Acc3-Rep1 |
149.37 |
150 |
99.58 |
|
Acc3-Rep2 |
148.81 |
150 |
99.20 |
|
Acc3-Rep3 |
152.26 |
150 |
101.50 |
Solution Stability
Assay of Sample was monitored up to 28 hours. % Variation in Assay value at each time interval was checked with initial value.
Table 5: Solution Stability of Assay
|
Area |
% Assay |
% Variation |
|
Zero hour |
99.64 |
NA |
|
2 hours |
98.88 |
0.76 |
|
4 hours |
99.34 |
0.30 |
|
6 hours |
98.75 |
0.89 |
|
8 hours |
99.20 |
0.44 |
|
12 hours |
99.51 |
0.13 |
|
16 hours |
98.66 |
0.99 |
|
20 hours |
99.09 |
0.55 |
|
24 hours |
98.77 |
0.88 |
|
28 hours |
99.11 |
0.53 |
|
Mean |
99.10 |
|
|
SD |
0.33 |
|
|
% RSD |
0.34 |
Robustness
Following Changes were made in mobile phase. The standard was injected in six replicated for individual robustness condition. The sample was prepared in triplicated and % Assay was calculated against respective standard. % RSD of assay value was calculated for triplicate preparation and % Variation of each robustness condition is compared with precision study.
Table 6: Robustness Conditions.
|
|
Change in Flow rate |
|
|
Robustness 1 |
0.9 ml/ min |
10% Negative change |
|
Robustness 2 |
1.1 ml/ min |
10% Positive change |
|
|
Change in Mobile Phase Composition |
|
|
Robustness 3 |
Buffer: Methanol (385: 650) |
10% Positive change |
|
Robustness 4 |
Buffer: Methanol (315: 650) |
10% Negative change |
Table 7: % Assay in Robustness Condition
|
Robustness-1 |
Robustness-2 |
Robustness-3 |
Robustness-4 |
|
|
Sample 1 |
99.02 |
99.67 |
99.36 |
99.66 |
|
Sample 2 |
99.37 |
99.96 |
98.70 |
99.57 |
|
Sample 3 |
99.07 |
99.15 |
98.94 |
99.29 |
|
% RSD |
99.15 |
99.59 |
99.00 |
99.51 |
|
% Variation |
0.36 |
0.08 |
0.51 |
0.0 |
Method Validation for Related Substances
Limit of Detection
Signal to noise ratio should be more than 3
Table 8: Limit of Detection for Each Analyte.
|
Peak Name |
Concentration |
Peak Height(H) |
Noise Height (h) |
S/N= 2H/h |
|
Vilazodone |
0.206 ppm |
0.45 |
0.1 |
9 |
|
Impurity A |
0.202 ppm |
0.35 |
0.1 |
7 |
|
Impurity B |
0.202 ppm |
0.3 |
0.1 |
6 |
Limit of Quantitation
Signal to noise ratio should be more than 9
Table 9: Limit of Quantitation for Each Analyte
|
Peak Name |
Concentration |
Peak Height (H) |
Noise Height (h) |
S/N= 2H/h |
|
Vilazodone |
0.515 |
1.6 |
0.1 |
32 |
|
Impurity A |
0.505 |
1.1 |
0.1 |
22 |
|
Impurity B |
0.505 |
1.0 |
0.1 |
20 |
Linearity and Range
The linearity was established in a range of 0.5 ppm (i.e., LOQ) to 1.5 ppm by appropriately diluting stock solution. The area response individual level measured for statistical assessment.
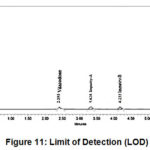 |
Figure 11: Limit of Detection (LOD). |
 |
Figure 12: LOQ (Level I). |
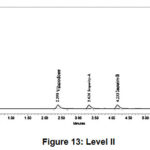 |
Figure 13: Level II. |
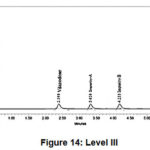 |
Figure 14: Level III. |
 |
Figure 15: Level IV. |
 |
Figure 16: Level V. |
Linearity Plots
Linearity Plots of area verses concentration was plotted for Vilazodone, Impurity A and Impurity B. The statistical assessment was processed. % Y intercept was calculated.
Table 10: R2 and % Y intercept.
|
|
Vilazodone |
Impurity A |
Impurity B |
|
R2 (NLT0.999) |
0.9995 |
0.9996 |
0.9997 |
|
% Y intercept (NMT 5) |
1.2 |
-2.2 |
1.3 |
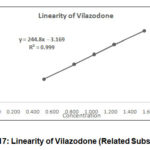 |
Figure 17: Linearity of Vilazodone (Related Substances) |
 |
Figure 18: Linearity of Impurity A. |
 |
Figure 19: Linearity of Impurity B. |
Accuracy
Accuracy was performed by spiking 50%, 100 % and 150% of individual impurities’ working concentration in a Sample solution. Each level was prepared in triplicate. % Recovery should be between 85.0 and 115.0%
% Accuracy = Amount Found X 100 divided by Amount Added
Table 11: % Accuracy for Impurities.
|
% Accuracy of Impurity A |
% Accuracy of Impurity B |
|
|
Level 1-Sample 1 |
92.59 |
97.93 |
|
Level 1-Sample 2 |
98.56 |
101.28 |
|
Level1 -Sample 3 |
96.12 |
103.95 |
|
Level 2- Sample 1 |
107.00 |
106.36 |
|
Level 2 -Sample 2 |
104.77 |
101.54 |
|
Level 2- Sample 3 |
101.70 |
103.10 |
|
Level 3- Sample 1 |
104.58 |
104.97 |
|
Level 3 -Sample 2 |
107.77 |
100.89 |
|
Level 3 -Sample 3 |
103.86 |
106.00 |
Solution Stability
Sample and Standard Solution was found to be stable for 24 hours. % RSD for content of individual known impurities was found to be less than 5.0.
Robustness
Robustness conditions mentioned in Assay test were also checked for Related Substances. % Variation for impurity content with respect to Precision Study should be less than 15.
Table 12: % Impurity content in Robustness 1 and 2
|
|
Impurity A |
Impurity B |
% Variation for Impurity A |
% Variation for Impurity B |
|
Precision |
0.11 |
0.10 |
NA |
NA |
|
Rob1 |
0.11 |
0.11 |
0.10 |
10.38 |
|
Rob1 |
0.10 |
0.10 |
9.51 |
6.76 |
|
Rob1 |
0.10 |
0.10 |
4.98 |
3.87 |
|
Rob 2 |
0.10 |
0.10 |
9.06 |
3.68 |
|
Rob 2 |
0.10 |
0.09 |
2.65 |
3.99 |
|
Rob 2 |
0.10 |
0.10 |
5.85 |
1.32 |
|
Rob 3 |
0.09 |
0.10 |
10.51 |
6.79 |
|
Rob 3 |
0.10 |
0.10 |
4.71 |
2.43 |
|
Rob 3 |
0.09 |
0.10 |
15.76 |
4.15 |
|
Rob 4 |
0.09 |
0.10 |
11.51 |
1.55 |
|
Rob 4 |
0.10 |
0.11 |
5.74 |
7.58 |
|
Rob 4 |
0.10 |
0.10 |
7.78 |
2.80 |
Forced Degradation and Mass Balance
Acid hydrolysis was initially done with 1M HCl.The sample was refluxed for about 2 hours. After cooling, sample was neutralised with 1 M NaOH and analysed. Observed degradation was very less (less than 2. %), hence process is repeated with 2 M HCl and 4 hours refluxing.
Base hydrolysis was done with 1 M NaOH and refluxed for two hours. Oxidative degradation was done with 10% H2O2 and refluxed for two hours. All degradation impurities were separated from Vilazodone and both process impurities. Mass Balance was found to be close to 100.
Table 13: % Degradation and Mass balance.
|
|
% Total Impurities (A) |
% Assay (B) |
% Mass Balance (A+B) |
|
Elevated Temperature: (80o C for 48 hours) |
ND |
99.37 |
99.37 |
|
UV-Visible Exposure: (ICH Q1B Option 1) |
ND |
99. 71 |
99.71 |
|
High Temperature and humidity: 40o C and 80 % RH for 5 days |
ND |
99. 48 |
99.48 |
|
Acid Hydrolysis: (Refluxed for 4 Hours in 1 M HCl) |
4.6 |
94.1 |
98.7 |
|
Base Hydrolysis: (Refluxed for 2 hours in 1 M NaOH) |
6.2 |
93.0 |
99.2 |
|
Oxidative Degradation: (Refluxed for 2 hours in 10% H2O2) |
7.8 |
90.6 |
98.4 |
Conclusion
The Related Substance and Assay methods developed for Vilazodone is stability indicating. In less than 10 minutes, process and degradation impurities were well separated and quantified. These make methods very simple, cost effective and rapid. Both methods were validated as per ICH and other internationally recognised regulatory guidelines. The statistical evaluation of these methods yields good linearity and regression coefficient. The accuracy for Vilazodone in Assay test and Impurity A and Impurity B is closer to 100 which make both methods reliable. The methods stand robust to minor changes that can be observed in routine lab environment.
The Forced degradation study reveals the method’s capability to separate potential impurities, which may be possible to form on storage. The mass balance of all degradation conditions was near 100.The sample and standards preparations are stable for more than 24 hours. Thus, proposed methods for Related substances and Assay are accurate, precise, robust and can be employed for routine quality control testing.
Acknowledgments
The author would like to acknowledge KPS Chemicals and Pharmaceuticals, Surat and SynZeal Research Private Limited, Ahmedabad for arranging API and Standards, respectively.
Conflict of Interest
The authors declare no conflict of interest.
References
- U.S. National Library of Medicine, available fromhttps://medlineplus. gov/druginfo/meds/a611020.html.2020
- RX List, available form https://www.rxlist.com/viibryd-drug.htm.2020
- ICH Guidelines; Q3A (R2), Impurities in new drug substances, International Conference on Harmonization, Geneva, 2006, available fromhttps://database.ich.org/sites/default/files/Q1A%28R2%29%20Guideline.pdf
- Yadav, N.; Goyal, A. International Journal of Current Pharmaceutical Research., Dec. 2016, 9(1), 132-135.
CrossRef - Panda, S.; Bera, R.; Beg, S.; Behera, S. Malaysian Journal of Analytical Sciences., 2015,19(5),920 – 929.
- Redasani, V.; Chhajed, C. F.; Patil; P. D; Surana S. Journal of Pharmaceutical Research.,2014,13(1), 20-22
CrossRef - Bakshi, M.; Singh S. Journal of pharmaceutical and biomedical analysis., 2002, 28(6),1011-40.
CrossRef - Ghosh, S; Venkatesh, S.; Ravikumar, B. V. V.Int.J. PharmTech Res., 2014-2015, 7(1), 204-211.
CrossRef - Athavia, B. A.; Dedania, Z.R.; Dedania, R.R.; Vijayendra, S.M.; Prajapati C. B. Int J Curr Pharm Res., 2017, 9(4),123-129.
CrossRef - Redasani, V.K.; Surana, S.J.Int J Analytical Techn.; 2017, 3(1),1-7.
CrossRef - available fromhttps://database.ich.org/ sites/default/files/ Q1B%20 Guideline.pdf
- Blessy, M.; Patel R.D.; Prajapati, P.N.; Agrawal, Y.K. Journal of Pharmaceutical Analysis., 2014, 4(3),159-165.
CrossRef - ICH Guideline, Q2 (R1), Validation of Analytical Procedures: Text and Methodology, 2005.available fromhttps://database.ich. org/sites/ default/files/Q2%28R1%29%20Guideline.pdf
- World Health Organization; Guidelines on validation – appendix 4 Analytical method validation, 2018.available fromhttps:// www.who. int/medicines/areas/quality_safety/quality_assurance/28092018Guideline_Validation_AnalyticalMethodValidation-Appendix4_QAS16-671.pdf
- U.S. Department of Health and Human Services; Food and Drug Administration; Analytical Procedures and Methods Validation for Drugs and Biologics, 2015.available fromhttps://www.fda.gov /files/drugs/published/Analytical-Procedures-and-Methods-Validation-for-Drugs-and-Biologics.pdf


ISSN Online: 2231-5039

![]()


