Method Development and Validation for Quantitative Analysis of Anti-Histamine Promethazine Hydrochloride by RP-UPLC.
Nilesh Takale1,2 , Neelakandan Kaliyaperumal2, Gopalakrishnan Mannathusamy1 and Rajarajan Govindasamy1*
1Department of Chemistry, Annamalai University,Annamalai Nagar, Chidambaram, Tamilnadu, India.
2Emcure Pharmaceuticals Ltd, Analytical Research Centre, Hinjawadi, Pune-411057, Maharashtra, India.
Corresponding Author E-mail: rajarajang70@gmail.com
DOI : http://dx.doi.org/10.13005/ojc/370103
Download this article as:
![]()
The quantitative analysis method for the quantitative analysis of the anti-histaminic drug Promethazine Hydrochloride (PMZ•HCl) is stated by a straightforward, smooth, reliable and reverse step of the ultra-performing liquid chromatographic method (RP-UPLC). Following ICH quidelinesQ2(R1), the RP-UPLC method has been developed and checked. The uniform solution of 3.4% KH2PO4 solution in water, 7.0 pH with dilute KOH, ACN, andMeOH in ratio of 40:40:20, used as a mobile phase. The flow of 0.6 mL/minusing photo diode array detector / UV detector by with wavelength of 254 nm and runtime 3 min. This gives linearty from 80-120 % with correlation coefficient of 0.99988. Repeatability and intermediate precision shows relative standard deviation (percent RSD) of 0.52, 0.24 and a overall RSD of 0.43. Robustness studies show no indicative changes in SST requirements, like asymmetry factor, theoretical plate & percentage relative standard deviation. These criteria's values are well within their acceptability limit. The degradation of promethazine under different stress conditions has been studied and shows that all known impurities and degradants are well separated from promethazine peak.This RP-UPLC is descriptive and accurate.
KEYWORDS:Assay; Promethazine hydrochloride; RP-UPLC; Validation
Introduction
The common antihistamine prescription drug used in hydrochloride salt (PMZ•HCl)1. Promethazine(PMZ), (±)-10-[2-(Dimethylamino)propyl] phenothiazine monohydro chloride was a first-generated anti-histaminic agent used for treatment of sleep, nausea &allergies2. In 1951 it was permitted for medical use in the US. PMZ is a phenothiazine derivative thatvaries from structure to phenothiazine with the same yet distinct effects3. PMZ is a crystal-clear, odourless&colourless to yellowish powder. Promethazine hydrochloride salt can be completelysoluble in H2O & slightly soluble in EtOH. It is like wise a enantiomer combination. It is a chiral compound. C17H20N2S.HCl is a molecular PMZ formula with 320.88 g / mol. weight. Stored in light-resistant containers under nitrogen at 25°C.
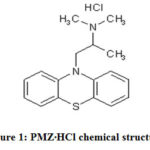 |
Figure 1: PMZ∙HCl chemical structure. |
Methods and Materials
API of promethazine hydrochloride is taken from Emcure Pharmaceutical Limited, Hinjawadi, Pune and its impurities also. KH2PO4, KOH (Merck) and milli-Q filter H2O are used, all chemicals are analytical grades. HPLC grade MeOH, ACN (Merck) and TEA (Merck)were used in sample & mobile phase preparation. The UPLC with UV/Photo diode array detector used for the data acquisition.
Mobile phase
3.4% of KH2PO4uniform solution in H2O with 7.0 pH adjusted by dilute KOH solution, ACN and MeOH in the ratio of 40:40:20.
Diluent
Triethylamine (TEA) in MeOH with concentration of 0.1%.
Preparation of standard and test sample solution
The 100,000 µg of standard / test sample of Promethazine hydrochloride in a 100 mL volumetric flask containing 60 mL of diluent and make the solution with diluent. Take out 5.0 mL of above (~1000 ppm stock) solution in a 100 mL volumetric flask & make up to the mark with a diluent.
Method development
The principle of UPLC remains the same as HPLC, but with higher speed, sensitivity and resolution. The UPLC technology is then employed to test PMZ•HCl. Promethazine is polar with its related impurities, so RPLC technique is applied for quantitative analysis. In RPLC, stationary phase is non-polar & the mobile phase is polar, such as, ACN H2O, MeOH and buffer. There is an also important role in the UPLC system development, as well as in stationary and mobile phases, with other parameters, like column compartment temperature, diluent, wavelength &pH. BEH column for UPLC have an internal diameter 2.1 mm and a particle size of 1.7 μm, screened with a particular accuracy of the CSH phenyl hexyl and symmetry shield. The columns are 50 mm long and 100 mm long. When using the symmetry shield, BEH, C18 (2.1 x 50 mm), 1.7μm, demonstrates greater resolution of impurity. Theoretical plates and symmetric peak shapes and appropriate criteria of SST, like the tailing factor are met. The pKa value of the target molecule is mainly used to select a buffer for the mobile phase. Here, the potassium dihydrogen phosphate buffer for mobile phase preparation is picked. Thus the uniform solution of 3.4% KH2PO4 solution in H2O, 7.0 pH with dilute KOH, ACN, and MeOH in ratio of 40:40:20. According to the standard preparation procedures, the flow rate of the column oven temp is selected. For quantitative PMZ analysis, Table 1 provides a methodology of chromatographic conditions.
Table 1: RP-UPLC instrument chromatographic conditions for Assay of PMZ∙HCl.
|
Component |
Specification |
|
Instrument/Apparatus
|
UPLC equipped with pump, UV/PDA detector, recorder and injector |
|
Detector |
UV/PDA |
|
Column/Statinary Phase |
(50 mm x 2.1 mm), 1.7 μSymmetry shieldBEH C18 |
|
Wavelength/λ Max |
254 λ Max(nm) |
|
Flow rate |
0.6 mL/min |
|
Injection volume size |
1.0 µL |
|
Column compartment temp. |
25°C |
|
Sampler temperature |
4ºC |
|
Run time |
3 min |
Results and Descusion
The Validation activity of analytical method was performed according to ICH directive Q2(R1)4-7. Validation parameters of analytical developed method mentioned below.
Selectivity
In presence of related impurities, the specificity of the method is measures analyte response. The method of the test should discriminate against the analyte and the impurities present. Table 2 displays selectivity data and related chromato grams are shown in Figure 2. This is done with the proof that due to the presence of spiked impurities at 1 percent conc. (1.0ppm) of the pure material (100ppm), the results of the test are not affected. During the PMZ peak retention time, the blank run reveals no interfering peak. The promethazine peak and recognised impurities are well separated (Figure 2). For related impurities, unspiked and spiked samples, PMZ peak purity angle and current impurity peaks are below threshold in individual solutions. This shows that (Table 2) the peaks are pure. For five PMZ replications, the RSD percentage is 0.05. Tailing factor and theoretical plates are respectively 1.03 and 3267 in the prepared standard.
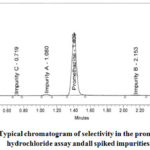 |
Figure 2: Typical chromatogram of selectivity in the promethazine hydrochloride assay andall spiked impurities. |
Table 2: Specificity data (spiked sample) for PMZ∙HCl.
|
Eluent* |
RT ( min) |
Area |
Asymmetry factor |
Purity angle |
Purity threshold |
Remark
|
|
D |
0.315 |
2263 |
1.33 |
7.114 |
58.048 |
Pass |
|
C |
0.719 |
8009 |
1.10 |
4.416 |
90.000 |
Pass |
|
A |
1.080 |
16765 |
0.90 |
2.325 |
90.000 |
Pass |
|
PMZ |
1.409 |
882092 |
1.02 |
0.084 |
1.881 |
Pass |
|
B |
2.153 |
9602 |
1.01 |
9.910 |
90.000 |
Pass |
*A to D alphabets are detonated as a impurities.
Linearity and Range
The different linearity levels of current UPLC developed method is then determined by using the test solution 80 to 120 percentanalyte concentrations in accordance with ICH guidelines. For 80, 90, 100, 110 and 120 percent average preparation concentrations of standard are shown in Table 3. Table 3 provides linearity results. The peak area verses of the concentration data with the least quadratic linear regression is analysed. 0.99988 was the resulting correlation coefficient. The calibration curve’s Y-intercept is 3.65, far lower than the allowable value of 5.00. This means that there are fewer variations between different linearity levels. Observed value and graph plotted for visual inspection (Figure 3) indicate that, the developed method is linear for given range.
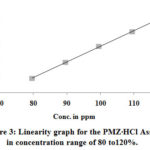 |
Figure 3: Linearity graph for the PMZ∙HCl Assay in concentration range of 80 to120%. |
Table 3: Linearity data for the PMZ∙HCl Assay from 80 to 120% concentration range.
|
Levels |
Concentration (ppm) |
Peak area |
Average |
|
|
Injection-1 |
Injection-2 |
|||
|
1 |
79.701 |
685747 |
680706 |
683227 |
|
2 |
89.664 |
774561 |
773942 |
774252 |
|
3 |
99.626 |
869035 |
864975 |
867005 |
|
4 |
109.589 |
947013 |
954438 |
950726 |
|
5 |
119.552 |
1042809 |
1042443 |
1042626 |
|
Correlation coefficient |
0.99988 |
|||
|
Intercept |
-31699 |
|||
|
% Y Intercept |
3.65 |
|||
Precision
The measurement of precision is categorised into repeatability, intermediate precision and reproducibility. This study is carried out when the entire operation of the analysis method is done.The precision of system is examined by injecting five replicates of PMZ standard. During repeatability and effective intermediate precision, six separate sample solutions are injected and the percentage value of test is measured. The comparative percentage test values of repeatability and intermediate precision are shown in Table 4. The RSD percentage observed for five replicates of PMZ is 0.5. The percentage obtained from the sample solution of Assayvalues and %RSD was calculated. Using various instruments and columns, intermediate precision is also tested by different chemist on different days in a single laboratory. The percentage of RSD is 0.52 and 0.24 for repeatability and intermediate precision monitoring. The cumulative RSD percentage (6 for method precision and 6 for intermediate precision) for 12 test preparations is 0.43.
Table 4: Comparative % Assay data of repeatability and intermediate precision for the PMZ∙HCl.
|
ID |
% Assay |
|
|
Repeatability |
Intermediate precision |
|
|
Sample solution-1 |
99.91 |
100.42 |
|
Sample solution -2 |
99.20 |
100.30 |
|
Sample solution -3 |
100.49 |
99.96 |
|
Sample solution -4 |
100.68 |
100.61 |
|
Sample solution -5 |
100.10 |
100.53 |
|
Sample solution -6 |
99.89 |
100.59 |
|
Average (n=6) |
100.05 |
100.40 |
|
SD (n=6) |
0.5216 |
0.2454 |
|
% RSD (n=6) |
0.52 |
0.24 |
|
Average (n=12) |
100.22 |
|
|
SD (n=12) |
0.4310 |
|
|
% RSD (n=12) |
0.43 |
|
Solution Stability
Sample and standard solution stability were processed for up to 3 days at 4ºC. The PMZ percentage test was calculated with regard to duration of test sample solution. The cumulative RSD percentage outcomes of the assay are 0.01, 0.22 and 0.29 at 4ºC, for days 1, 2 and 3 respectively. It is well with in limit criteria up to 3 days (percent RSD is less than 2.00). This means the solution of the sample is stable when kept at 4ºC for up to 3 days.
Robustness
The robustness of the developed method is proved byintentionaly changing the instrumental conditions such as the carrier flow rate &mobile phase pH. The flow rate has been changed by ±10%. The actual flow rate of method 0.6 mL/min is deliberately change between 0.54 mL/min and 0.66 mL/minrespectively. The mobile phasepH was changed to ±0.2. In the 7.0 pH mobile phase, the current pH is modified to 6.8 and 7.2. The area observed, the standard deviation, and itspercent RSD are shown in Table 5. The retention time intervals in both cases vary by ±0.15 minutes relative to the real retention times. The SST (suitability) parameter as a tailing factor for a system is 1.15 to 1.19. In studies of robustness, the RSD percentage is between 0.04 and 0.16. In SST parameters, like asymmetry factor &RSD percentage, major change was not observed in entirely deliberate and distinct instrumental chromatographic conditions (pH of mobile phase and flow rate). The principles of these parameters are well within the boundaries of their acceptability.
Table 5: Area, standard deviation and its %RSD of Robustness studies for the PMZ∙HCI.
|
Replicate of injections |
Area of PMZ∙HCI |
|||
|
Flow rate of mobile phase |
pH of mobile phase |
|||
|
0.54 mL min-1 |
0.66 mL min-1 |
pH-7.2 |
pH-6.8 |
|
|
Standard Inj.-1 |
961219 |
790171 |
870848 |
848135 |
|
Standard Inj.-2 |
961937 |
790548 |
871321 |
847380 |
|
Standard Inj.-3 |
963151 |
788396 |
871009 |
847666 |
|
Standard Inj.-4 |
962864 |
788723 |
869862 |
847187 |
|
Standard Inj.-5 |
965261 |
788141 |
868227 |
847597 |
|
Mean |
962886 |
789196 |
870253 |
847593 |
|
SD |
1532.2225 |
1090.3305 |
1257.3525 |
356.8312 |
|
%RSD |
0.16 |
0.14 |
0.14 |
0.04 |
|
Tailing factor |
1.19 |
1.17 |
1.15 |
1.15 |
Forced degradation Study
Forced degradation8-10 offers a specificity calculation and helps to pick stability that demonstrates analytical processes. The percentage of degradation was measured by comparing chromatograms with untreated samples collected under stress conditions. Studies of degradation contain photolytic, thermal, oxidative, aqueous, basic, acidic& humidity stress parameters. Under these conditions, the degradation data are shown in Table 6. Heated at a tharmal degradation sample to 105 ° C for 24 hours. In huminity degradation at a comparative humidity of 75 percent took place at a temperature of 40° C for 24 hours. The promethazine API test samples were subjected to approximately 200 W•h•m−2 intensity up to 1.2 x 10⁶lux.hrs. under UV light. The physical appearance of test solutions in heat, humidity, and stress conditions remained unchanged. All of these experiments were carried out using the latest method of analysis parameters for 100 ppm of PMZ concentration. The area of the PMZ remained constant with no degrading peak hence it is proved that the promethazine molecule is a stable for temperature, humidity& photolytic stress. An aqueous degradation occurs by exposing the 5 mL water test sample held at ambient temperature for 24 hours. The net degradation of 6.82 percent is observed. The basic degradation is achieved by exposing the test sample to 5 mL 5N NaOH, which solution holds at ambient temperaturefor 30 min. The base degradation test sample is neutralized with hydrochloric acid and injected on UPLC. During in acid degradation the test sample subjected in to 5 mL, 5N HCI. Kept this solution at ambient temperature for 30 minutes and the acid degradation test sample solutionis neutralized with NaOH. For base and acid stress conditions, no degradation is observed. The solution was stored at room temperature for 15 min by adding 2.0 mL of 30% H2O2. The PMZ is 12.46% degraded. The aqueous and oxidation degradation chromatograms are shown in Figures 4 and 5. Both degradant and recognized impurities are well resolved as of the PMZ. PMZ and its degradant and recognised (known) impurities are therefore satisfied with the peak purity criteria.
 |
Figure 4: Aqueous/waterstress study chromatogram of Promethazine hydrochloride. |
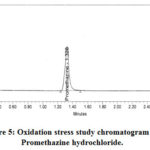 |
Figure 5: Oxidation stress study chromatogram of Promethazine hydrochloride. |
Table 6: %Assay and %degradation of PMZ∙HCl with different stress study conditions.
|
Stress study conditions |
Exposure period |
% Assay |
% degradation |
Purity criteria |
|
Untreated test sample solution |
– |
99.68 |
— |
Pass |
|
Humidity study |
24 hrs. at 40°C/75% RH |
99.70 |
Nil |
Pass |
|
Thermal study |
24 hrs. at 105°C |
99.93 |
Nil |
Pass |
|
Photolytic study |
Near UV 200 watt hrs./m2& 1.2 million lux hrs. |
99.52 |
Nil |
Pass |
|
Aqueous/water study |
5 mLH2O 24 hrs. at ambient temperature |
92.86 |
6.82 |
Pass |
|
Acid study |
5 mL 5N HCI at ambient temperature for 30 min. |
99.62 |
Nil |
Pass |
|
Alkali study |
5 mL 5N NaOH at ambient temperature for 30 min. |
99.81 |
Nil |
Pass |
|
Oxidation study |
2 mL 30%H2O2 at ambient temperature for 15 min. |
87.22 |
12.46 |
Pass |
Conclusion
For quantitative analysis of PMZ∙HCl in active pharmaceutical ingredients, the RP-UPLC approach has been developed and successfully validated under the requirements of the Pharmacopeia and ICH Guidelines. With this process, the promethazine peak and recognised impurities are well-resolved. The good chromatographic resolution between promethazine peak and recognized impurities were achieved with isocratic elution (50 mm x 2.1 mm) on the BEH C18 symmetry shield, 1.7 μ column. The uniform solution of 3.4% KH2PO4 solution in H2O, 7.0 pH with dilute KOH, ACN, and MeOH in ratio of 40:40:20, used as a mobile phase. The mobile phase flow rates supplied by the UV / PDA detector are 0.6 mL/min. The column compartment temp.is 25°C and the quantity of injections is 1.0 μL. This method is in line with the correlation coefficient and Y-intercept of 0.99988 and 3.65 percent. For these measurements, repeatability capacity and intermediate precision were measured and observed RSD percent is 0.52 and 0.24 respectively, with a total percentage RSD of 0.43. No major changes in SST (system suitability) parameters for example the tailing, RSD percent and theoretical plates are suggested by robustness tests. The principles of these parameters are well within the boundaries of their acceptability. The physical presence of a test sample and the peak area of the promethazine has not changed, implying its stability due to heat, humidity, photolytic, acid and alkali in these stress conditions. All known impurities and degradants are well separated from the PMZ peak for aquaous and oxidation degradations, and the peak pureness criteria are also met. This RP-UPLC procedure is speedy, selective, fast, precise and cost effective; it also defines all parameters of linearity, stability and robustness and can be used for routine research in other laboratories.
Acknowledgement
The authors like to thank Dr. MukundGurjar of the Analytical Research Center in Hinjawadi, Pune, Emcure Pharmaceuticals Limited for their help and allowed the publication of this paper.
Conflict of Interest
There is no conflict of interest.
References
- Promethazine Hydrochloride Monograph for Professionals, Drugs.com, American Society of Health-System Pharmacists, Retrieved 24 October 2018.
- Rx list, Promethazine description, 2007.
- Strenkoski-Nix, L.C.;Ermer, J.;DeCleene,S.;Cevallos, W.;Mayer, P.R. Pharmacokinetics of promethazine hydrochloride after administration of rectal suppositories and oral syrup to healthy subjects, Am. J. Health-Syst. Pharm., 2000, 57 (16): 1499–1505.
CrossRef - ICH guidelines; Q8 (R2), Harmonised Tripartite Guideline, on Pharmaceutical development.Proceedings of the International Conference on Harmonization, 2009.
- ICH guidelines; Q3A (R2), Impurities in new drug substances, in: International Conference on Harmonization, Geneva, 2006.
- ICH guidelines, Q1A(R2); Stability Testing of New Drug Substances and Products, International Council for Harmonization Geneva.(http://wwwichorg/products/guidelines/quality/article/quality-guidelines/html), 2003.
- ICH guidelines, Q2 (R1): Validation of Analytical Procedures: Text and Methodology, International Conference on Harmonization Geneva. (http://wwwichorg/products/guidelines/quality/article/quality-guidelines/html), 2005.
- Reynolds, D. W. Forced degradation of pharmaceuticals.American Pharmaceutical Review, 2004, 7 (3), 56-61.
- Gorge, N. Forced degradation as an integral part of HPLC stability-indicating method development.Drug Deliv. Technol,2010, 10(5), 56-59.
- Blessy, M., Ruchi, P., Prajesh, P., Yadvendra, A. Development of forced degradation and stability indicating studies of drugs-a review.J. Pharm. Anal,2010, 4, 159-165.
CrossRef


![]()


