Influence of Meteorological Variables on Ambient Air Pollutants of a Coastal District in Eastern India
SS Kalikinkar Mahanta1* , Sharada Shrinivas Pati1, Bhagirathi Mahanta1, Kushalindu Biswas1, Rojalin Sahu1, Bhabani Shankar Panda2 and Malaya Ranjan Mallik3
1Department of Environmental sciences, Sambalpur University, Odisha, India.
2Department of Chemistry, Ravenshaw University, Odisha, India
3Dayavihar Degree College, Puri, Odisha, India.
Corresponding Author E-mail: mymummy5083@gmail.com
DOI : http://dx.doi.org/10.13005/ojc/370127
Article Received on : 08-Feb-2021
Article Accepted on : 09-Feb-2021
Article Published : 23 Feb 2021
The study of various air pollutants and meteorological parameters are very important for all the researchers. Baleswar was known to be a seaside Districts of Odisha which is the economic and cultural heart of Northern Odisha. The aim of this study is to measure the air pollutants, meteorological parameters and to enumerate the air pollution index at three specific sites (Sahadevkhunta, Mallikashpur, Rasalpur) according to CPCB procedures. The air pollutants analysed by supplying through specific absorbing reagents and the pollutants were analysed up to 3 year (2017, 2018 and 2019) with a regularity of thrice per week. Analyses of our data sets showing that SO2 and NO2 concentration during summer, rainy and winter season are within the prescribe standard of NAAQS by CPCB but PM10 and PM2.5 are above the prescribed standard except PM2.5 concentration of rainy season in year 2019. Air pollution index is remaining in the condition between clean air (CA) to moderate air pollution (MAP) and it shows that the pollution index in all the sites are reducing from the year 2017 to 2019 may be due to enhancing technologies to reduce the pollutant concentration in air.
KEYWORDS:Air Pollution; Air Pollution Index; Baleswar; Meteorological Parameters; Multidimensional Scaling
Download this article as:| Copy the following to cite this article: Mahanta S. S. K, Patil S. S, Mahanta B, Biswas K, Sahu R, Panda B. S, Mallik M. R. Influence of Meteorological Variables on Ambient Air Pollutants of a Coastal District in Eastern India. Orient J Chem 2021;37(1). |
| Copy the following to cite this URL: Mahanta S. S. K, Patil S. S, Mahanta B, Biswas K, Sahu R, Panda B. S, Mallik M. R. Influence of Meteorological Variables on Ambient Air Pollutants of a Coastal District in Eastern India. Orient J Chem 2021;37(1). Available from: https://bit.ly/3uosbvP |
Introduction
Our earth was created before 4.5 billion years ago (Wikispeedia). All the systems of our mother earth were remains in the balanced state. From the day human beings came to this earth the natural balances of the earth have started disturbance. Air is most essential element for survival of the entire organism present on this earth (Abas et al., 2019). But due to fulfilment of own demand human beings are enhancing industrialization and urbanization which leads to interference of various pollutants in to the air (Manisalidis et al., 2019). Air pollution is the process through which the original air constituents’ detoriates with interaction of various pollutants (Graueetal. 2013).
Air pollution is directly influencing the climate of an area. Air pollutants includes Various greenhouse gases (GHGs) and different air pollutants (PM, SO2, NO2, CO, O3, etc). With respect to world health organization, the number of deaths registered for outdoor air pollution was highest in china followed by India. India is developing country, various industrial developments, infrastructural activities and vehicular emissions were releasing to the atmosphere as primary and secondary pollutants (De sario et al., 2013). Air contamination was known as great enemies of our age by causing significant danger to health of all age group peoples (Venkatesan 2016, Landrigan 2017). The World Health Organization (WHO) in 2004 assessed that about 91% population were living in the area having higher air pollutants and in year 2012 announces that there were 3 million deaths in whole world due to outdoor air pollution and 6.5 million death associated with both indoor and outdoor air pollution (World Health Organization). In Asia approximately 4.3 million people die due to household air pollution and 3.7 million from ambient air pollution (Apte and Salvi., 2017).
Air contamination was connected to malignancy, respiratory sicknesses, negative pregnancy outcomes, cardiovascular illnesses, infertility, stroke, intellectual decrease, and other unfavorable medical conditions (Khreis et al., 2017, Jacobs et al., 2017). From all the death cause by air pollution occurred in Low developed and developing countries, about 66% are occurring in the Western Pacific region and South East Asia. In Asia, due to rapid urbanization the air pollutants in the atmosphere increase which induces various health problems (Sweileh 2018, Katoto 2019). By the last century, Air pollution has ameliorated in developed countries but become worse in the developing and low developed countries like South Asia (Brauer et al., 2016). Due to the rise in breathing of Nitrogen dioxide level, the problems related to respiratory are increasing. Nitrogen dioxide inflames the lining of the lungs, and it can reduce immunity to lung infections (Kim et al., 2013) which leads to cause health problems like coughing, wheezing, common colds, bronchitis and flu. Nitrogen dioxide can also cause intense attacks which leads to asthma (Jarvis et al., 2010). Major risk is there for the Children having asthma and older age people with heart problems. Exposure to different particle pollution can cause various health problems like cardiovascular disease and respiratory problems (Kurt et al., 2016). Human health is in greater risk if the Sulfur dioxide is breathed in. Sulfur dioxide affects the health of human quickly and within ten to fifteen minutes the peoples get worst symptoms (Ghorani et al. 2016).
Meteorology was significant for the reason of the impact of dependency of air quality on life. The meteorology was related to air quality, which indicates that the alteration of air pollutants expected to change the climatic condition of that region (Zhang et al. 2015). Due to the climatic activity like (precipitation, vertical mixing and wind) the pollutant scattering and development in the air gets disturbed. Meteorological factors presume important role in air pollution which is influencing transport, emissions, air pollutants dispositions and arrangement (Khedairia et al. 2012). These meteorological factors were found to be substantial for various problems like agriculture, forestry, water quality, avalanche warning system, renewable energy sectors and regional development planning (Wolski et al. 2011).
The assessment of various air pollution in an area can be done by calculation of API (air pollution index) (Michele and Spyros 1997; Louise and Gareth 1993). API estimation is done by comparing real time pollutant concentration with the standard prescribed and the final API is the collective value of different pollutants which were studied (Kjellstrom et al., 2006).
API can also explain and specify different the pollutants which affects the air quality of an area and also helps us to estimate different management strategies and air pollution quality. API is help us to know environmental status and trends by comparing with specific standard (Kookana et al., 2014). With respect to above basics, this study was conducted to estimate the meteorological parameters, ambient air quality and compute the air pollution index (API) of Baleswar town, located in the East-Coast region of Odisha, India.
Material and Methods
Study area:
Among six coastal districts of Odisha Baleswar is one of them, which is located at the northern east region of the state. This district is the northern end part of Odisha situated near Medinipur districts of West Bengal. The Baleswar region is situated at 21.98 to 20.69 of North Latitude with 87.29 to 88.30 of East Longitude. Baleswar is the economic and cultural heart of Northern Odisha. Its climate is generally hot with high humidity. The production of rice is maximum in baleswar district among all districts of Odisha.
Site selection
With respect to the guidelines given by CPCB 2011 and SPCB, Odisha four different sampling sites were designated to analyse the ambient air quality, by taking into attention of the area providing illustrative representation of human settlement, communication of that area, forest cover, etc. These stations are Rasalpur, Sahadevkhunta and Mallikashpur, located in south-east, west, and east regions of Odisha respectively (As shown in Figure1 and Figure 2). All the three selected stations come under the commercial and residential area category (the primary sectors of air pollution in an urban area), and hence are appropriate to represent the actual picture of the ambient air quality of the urban area. The measurement of ambient air quality was carried out from August 2017 to July 2019 at the above four sampling stations with a frequency of twice per week, totalling to an annual sample of 104.
 |
Figure 1: Baleswar district in Odisha, India. |
 |
Figure 2: Sampling stations in Baleswar District. |
Table 1: The coordinates of sampling stations.
|
SL No. |
Sampling Stations |
Coordinates |
|
|
Latitude |
Longitude |
||
|
1 |
Sahadevkhunta |
21050’25.79”N |
86092’36.87”E |
|
2 |
Mallikashpur |
21049’76.55”N |
86073’76.89”E |
|
3 |
Rasalpur |
21019’34.54”N |
86046’75.83”E |
Sample collection and analysis.
This study carried out by following the procedures which was given by CPCB, India (2011) for the estimation of gaseous pollutants as well as particulate matter. The analysis of respirable particulate matter (PM2.5) were analysed by a sampler; which is known asfine particulate sampler (FPS) whereas the suspended particulate matter (PM10) and the gaseous pollutants (SO2 and NO2) were analysed by a sampler; which is known as respirable dust sampler (RDS). Both FPS and RDS instruments were kept a distance of 6 to 8 meters from the ground level. According to the instrumental methods, the collection of samples were continuously carried out for 24 h at a particular flow rate of 1.11–1.44 m3/min for PM10 and the gaseous pollutants and 1.0 m3/hour for the PM2.5 pollutants. The particulate matter analysis was carried out gravimetrically, taking the initial and final weights of the filter papers (Whatman for PM10 and polytetrafluoroethylene for PM2.5. The concentration of particulate matter (PM10 and PM2.5) and gaseous pollutants (SO2 and NO2) in ambient air was expressed in μg/m3, and the values presented as the average of each month obtained from the daily mean.
The air pollution index (API) was calculated according to the following formula:
API = 1∕4 × ((IPM10 ∕ SPM10) + (IPM2.5 ∕ SPM2.5) + (ISO2 ∕ SSO2) + (INO2 ∕ SNO2)) × 100
Where IPM10, PM2.5, ISO2 and INO2 are the individual ambient concentrations of PM10, PM2.5, SO2 and NO2 respectively. Similarly, SPM10, SPM2.5, SSO2 and SNO2 represent their respective 24-hourly standard values prescribed in National Ambient Air Quality Standards by Central pollution control board, India.
Result and Discussion
The current study investigates the air quality throughout four main criteria pollutants (NO2, SO2, PM10 and PM2.5) and three meteorological parameters (Temperature, Rainfall and Humidity) at the selected study areas of Baleswar in year 2017, 2018 and 2019. The result of both air pollutants and meteorological parameters of summer season for all the years (2017 to 2019) were given in table 2. SO2 concentration was reported highest at site Mallikashpur in year 2019 and lowest concentration at site Rasalpur and Mallikashpur. It was seen that the SO2 concentration increasing from 2017 to 2019. NO2 concentration was found near site Sahadevkhunta in year 2019 and highest point near site Mallikashpur in year 2017. It seems that the NO2 concentration was continuously decreasing with increase in year. PM10 concentration was found slightly increasing with increasing year from 2017 to 2019; highest concentration was reported at site Mallikashpur in year 2019 and lowest concentration at Mallikashpur in 2017. Maximum concentration of PM2.5 was reported at site Mallikashpur in 2018 and lowest concentration at Rasalpur in 2019. The concentration of PM2.5 in 2018 was seems to be greater than 2017 but during year 2019 the concentration was reduced which was a very good sign for reduction of pollution at baleswar. Temperature was seeming to be increasing slowly with years from 2017 to 2019. Humidity was showing higher in year 2017, slightly decrease during 2018 and again increase in year 2019. Rainfall was decreasing highly with rising years.
Table 2: Results of air quality and meteorological parameters during summer season.
|
Year |
Sampling Stations |
Air Quality Parameters |
Meteorological Parameters |
|||||
|
SO2 (µg/m³) |
NO2 (µg/m³) |
PM10 (µg/m³) |
PM2.5 (µg/m³) |
Temperature (°C) |
Humidity (%) |
Rainfall (mm) |
||
|
2017 |
Sahadevkhunta |
5.75 |
13.75 |
86 |
73 |
30.25 |
66.75 |
144.75 |
|
Mallikashpur |
4.25 |
14.75 |
84.5 |
74 |
30.25 |
66.25 |
116.25 |
|
|
Rasalpur |
4.25 |
13 |
87 |
71.75 |
30.5 |
65.5 |
124.25 |
|
|
2018 |
Sahadevkhunta |
6 |
13.5 |
87.75 |
46.75 |
31 |
60 |
158.5 |
|
Mallikashpur |
5.25 |
13.25 |
88.75 |
89.25 |
31 |
59.25 |
141 |
|
|
Rasalpur |
5.25 |
14.25 |
87.25 |
89 |
31 |
59.75 |
129.25 |
|
|
2019 |
Sahadevkhunta |
7.225 |
10.725 |
88.15 |
48.5 |
32.75 |
62 |
105 |
|
Mallikashpur |
7.6 |
10.9 |
89.25 |
49.075 |
32.5 |
62.25 |
78.175 |
|
|
Rasalpur |
7 |
10.875 |
88.225 |
49.079 |
32.5 |
62.25 |
84 |
|
The values of both air pollutants and meteorological parameters were given in table 3. The result was analysed during rainy season in year 2017, 2018 and 2019. SO2 concentration was shows increasing trend from 2017 to 2019, highest concentration was reported during 2019 at Sahadevkhunta and lowest concentration at site Sahadevkhunta in year 2018. NO2 concentration was reported higher at Rasalpur in year 2018 and lower concentration was at Sahadevkhunta in 2019. Concentration of NO2 was increasing in 2018 from 2017 but reducing at 2019. Highest concentration of PM10 was reported at Mallikashpur in 2019 and lowest concentration at Mallikashpur in 2017. PM10 concentrations in these sites were almost same and Mallikashpur showed increase concentration from 2017 to 2019. PM2.5 concentration was reported highest at site Mallikashpur in 2017 and lowest at site Rasalpur. Concentration of PM2.5 was decreasing highly from 2017 to 2019 which was very good for pollution level at Baleswar. Temperature was showing same in all the sites in year 2017, 2018 and 2019. Humidity was same in year 2017 and 2018 but slightly increasing in 2019. Rainfall was increase from year 2017 to 2018 but decrease in year 2019. The highest rainfall was reported at Sahadevkhunta in 2017 but Average rainfall in 2018 was showing higher than 2017 and 2019.
Table 3: Results of air quality and meteorological parameters during rainy season.
|
Year |
Sampling Stations |
Air Quality Parameters |
Meteorological Parameters |
|||||
|
SO2 (µg/m³) |
NO2 (µg/m³) |
PM10 (µg/m³) |
PM2.5 (µg/m³) |
Temperature (°C) |
Humidity (%) |
Rainfall (mm) |
||
|
2017 |
Sahadevkhunta |
4.5 |
13 |
77.25 |
65.75 |
29.5 |
74.25 |
370.75 |
|
Mallikashpur |
5.75 |
13.5 |
77 |
67.25 |
29 |
73 |
218.25 |
|
|
Rasalpur |
4.75 |
14.25 |
78.25 |
66 |
29.5 |
73.75 |
263.5 |
|
|
2018 |
Sahadevkhunta |
3.25 |
14 |
78.25 |
29.75 |
29.75 |
73.25 |
337.5 |
|
Mallikashpur |
4 |
14 |
77.75 |
56.5 |
30.25 |
72.75 |
313.5 |
|
|
Rasalpur |
4 |
13.25 |
77.5 |
56.75 |
29.75 |
73.25 |
304.25 |
|
|
2019 |
Sahadevkhunta |
7.55 |
10.45 |
77.925 |
38.1 |
29.5 |
77 |
235.75 |
|
Mallikashpur |
7.375 |
10.75 |
81.85 |
38.15 |
29.5 |
77 |
262.25 |
|
|
Rasalpur |
7.425 |
10.675 |
78.525 |
38.05 |
29.5 |
78.5 |
233 |
|
The concentration of Air quality and Meteorological parameters of winter season was presented in table 4. The table was showing result of three years (2017, 2018 and 2019). The SO2 concentration was decrease from year 2017 to 2018 but during 2019 the concentration was increasing. The highest concentration was reported during 2019 at site Mallikashpur and lowest concentration near site Sahadevkhunta in year 2018. NO2 concentration was showing slightly increasing from 2017 to 2018 followed by 2019. Highest concentration of NO2 was reported near site Mallikashpur in 2019 and lower concentration near site Rasalpur in 2017. PM10 concentration was slightly increasing from 2017 to 2018 and decrease from 2018 to 2019. The lowest concentration was reported during 2019 in site Sahadevkhunta and highest concentration reported Sahadevkhunta in 2018. PM2.5 concentration was decreased highly from 207 to 2019. Highest PM2.5 concentration was found at site Sahadevkhunta in 2017 and the lowest concentration at Mallikashpur in 2019. Temperature and Humidity were showing slightly increasing from 2017 to 2019. Rainfall was very less in 2018 but during 2017 and 2019 concentration of rainfall was recorded higher. Maximum rainfall concentration was reported near site Sahadevkhunta in 2019 and lowest concentration at site Rasalpur in 2018.
Table 4: Results of air quality and meteorological parameters during winter season.
|
Year |
Sampling Stations |
Air Quality Parameters |
Meteorological Parameters |
|||||
|
SO2 (µg/m³) |
NO2 (µg/m³) |
PM10 (µg/m³) |
PM2.5 (µg/m³) |
Temperature (°C) |
Humidity (%) |
Rainfall (mm) |
||
|
2017 |
Sahadevkhunta |
5.25 |
15.5 |
90.5 |
90.25 |
23.25 |
55 |
16.5 |
|
Mallikashpur |
5.5 |
15.25 |
89.25 |
89 |
22.25 |
53.5 |
12.5 |
|
|
Rasalpur |
4.25 |
14.5 |
91.25 |
88.75 |
22 |
52.75 |
14.5 |
|
|
2018 |
Sahadevkhunta |
3.9 |
14.53 |
92.25 |
59.75 |
23.5 |
49.75 |
2.25 |
|
Mallikashpur |
4 |
14.25 |
91.25 |
85.75 |
23.5 |
50 |
2.5 |
|
|
Rasalpur |
4.5 |
15.25 |
90.5 |
85.5 |
24.25 |
49.75 |
0.75 |
|
|
2019 |
Sahadevkhunta |
7.125 |
15.925 |
87.428 |
47.225 |
24.375 |
56.25 |
31.5 |
|
Mallikashpur |
7.625 |
17.25 |
88.05 |
47.15 |
24.6 |
56.5 |
25 |
|
|
Rasalpur |
7.525 |
16.35 |
87.425 |
47.475 |
24.5 |
57.5 |
22.5 |
|
Air Pollution Index of different sampling Stations.
Air pollution index provides the pollution level of an area. From Table 5 we observed that, during winter season the pollution level is remains high. By observing the pollution levels in three year it was found that the pollution level of all the sites were reducing by proceeding the year from 2017 to 2019 may be due to enhancing technologies to reduce the pollutant concentration in air. During rainy season the pollution level was low with respect to other seasons. During winter season of year 2017, all the sites were remains in orange zone which indicates that the pollution level is unhealthy for sensitive groups. Rainy season during all the year were showing lower index value which is moderate levels of health concern. During summer season the pollution index value was increased at Mallikashpur and Rasalpur in year 2018 with compared to 2017. Overall, we found that during winter season the pollution value was remains higher followed by summer followed by rainy season. The highest pollution index value within these years (2017, 2018 and 2019) was reported at Sahadevkhunta during winter season of year 2017 and the lower value was reported at Sahadevkhunta during Rainy season of year 2019. The air pollution is directly proportional to the health status of particular environment. The classification of several ranges of Air pollution index and the related health concerns as described by (Zlauddin and Siddiqui. 2006) are presented in Table 6.
Table 5: Air pollution index (API) of all sampling stations.
|
AIR POLLUTION INDEX |
||||
|
Year |
Sampling Station |
Summer |
Rainy |
Winter |
|
2017 |
Sahadevkhunta |
92.80 |
83.6 |
106.4 |
|
Mallikashpur |
92.50 |
85.4 |
105.5 |
|
|
Rasalpur |
91.30 |
85.1 |
104.25 |
|
|
2018 |
Sahadevkhunta |
76.70 |
48.83 |
86.5 |
|
Mallikashpur |
103.40 |
78.2 |
102.25 |
|
|
Rasalpur |
103.63 |
77.9 |
102.6 |
|
|
2019 |
Sahadevkhunta |
77.05 |
49.65 |
79.4 |
|
Mallikashpur |
78.13 |
68.3 |
80.7 |
|
|
Rasalpur |
77.50 |
49.91 |
80 |
|
Table 6: The range of Air pollution index (API), air quality and its health in environment.
|
API value |
Category of Air quality |
Health issues |
|
0 to 25 |
Clean air (CA) |
The effects on health very negligible |
|
26 to 50 |
Light air pollution (LAP) |
For sensitive group cardiac and respiratory issues arises |
|
51 to 75 |
Moderate air pollution (MAP) |
generally, the symptoms of cardiovascular and respiratory disease are seen |
|
76 to100 |
Heavy air pollution (HAP) |
Mostly the heart and lungs are affected |
|
>100 |
Severe air pollution (SAP) |
The heart and lung diseases are damaged severely. In case of children possibility of death increases |
Correlation
Summer Correlation
Table 7: Correlation of parameters (Summer season).
|
PARAMETERS |
SO2 |
NO2 |
PM10 |
PM2.5 |
TEMP |
HUMIDITY |
RAINFALL |
|
SO2 |
1 |
||||||
|
NO2 |
-.850** |
1 |
|||||
|
PM10 |
.691* |
-.722* |
1 |
||||
|
PM2.5 |
-.731* |
.712* |
-.352 |
1 |
|||
|
TEMP |
.893** |
-.930** |
.735* |
-.669* |
1 |
||
|
HUMIDITY |
-.204 |
.129 |
.304 |
.519 |
-.141 |
1 |
|
|
RAINFALL |
-.562 |
.733* |
-.324 |
.447 |
-.736* |
.289 |
1 |
|
**. Correlation is significant at the 0.01 level (2-tailed). |
|||||||
|
*. Correlation is significant at the 0.05 level (2-tailed). |
|||||||
Correlation analysis for both air quality and meteorological parameters were examined during summer season for the year 2017, 2018 and 2019 (Table 7). The results revels some of the relations like SO2 showed significant positively correlated with the Temperature (r = + 0.893, p <0.05), showed significant negatively correlated with NO2 (r = – 0.850, p < 0.05) but not show any significant negatively correlated with PM2.5 (r = -0.731, p >0.01) and PM10 (r =0.691, p > 0.01). NO2 was showing significant negatively correlated with Temperature (r = -0.930, p < 0.05), but not show any significant positive correlate with PM2.5 (r = 0.712, p > 0.01), Rainfall (r = 0.733, p> 0.01) and negative correlate with PM10 (r = – 0.722, p > 0.01). Temperature was showing not significant positive correlation with air pollutants like PM10 (r = 0.731, p >0.01) and negative correlate with PM2.5 (r = -0.669, r > 0.01). Rainfall showed not significant negative correlate with Temperature (r = -0.736, p > 0.01).
Rainy Correlation
Table 8: Correlation of parameters (Rainy season).
|
PARAMETERS |
SO2 |
NO2 |
PM10 |
PM2.5 |
TEMP |
HUMIDITY |
RAINFALL |
|
SO2 |
1 |
||||||
|
NO2 |
-.909** |
1 |
|||||
|
PM10 |
.476 |
-.510 |
1 |
||||
|
PM2.5 |
-.339 |
.562 |
-.521 |
1 |
|||
|
TEMP |
-.476 |
.258 |
.015 |
-.197 |
1 |
||
|
HUMIDITY |
.883** |
-.944** |
.534 |
-.575 |
-.242 |
1 |
|
|
RAINFALL |
-.746* |
.479 |
-.185 |
.098 |
.542 |
-.475 |
1 |
|
**At 0.01 level the 2-tailed correlation is significant |
|||||||
|
* At 0.05 level the 2-tailed correlation is significant |
|||||||
The correlation study during rainy season for year 2017, 2018 and 2019 was examined (Table 8). The outcomes of results were like SO2 shows significant positive correlation with Humidity (r = 0.883, p <0.05), significant negative correlated with NO2 (r = -0.909, p <0.05) and not significant negative correlated with Rainfall (r = -0.746, p >0.01). NO2 shows significant negatively correlate with Humidity (r = -0.944, p<0.05).
Winter Correlation
Table 9: Correlation of parameters (winter season)
|
PARAMETERS |
SO2 |
NO2 |
PM10 |
PM2.5 |
TEMP |
HUMIDITY |
RAINFALL |
|
SO2 |
1 |
||||||
|
NO2 |
.934** |
1 |
|||||
|
PM10 |
-.960** |
-.847** |
1 |
||||
|
PM2.5 |
-.752* |
-.667* |
.647 |
1 |
|||
|
TEMP |
.598 |
.646 |
-.544 |
-.736* |
1 |
||
|
HUMIDITY |
.915** |
.817** |
-.864** |
-.563 |
.326 |
1 |
|
|
RAINFALL |
.875** |
.745* |
-.843** |
-.612 |
.314 |
.940** |
1 |
|
**At 0.01 level the 2-tailed correlation is significant |
|||||||
|
* At 0.05 level the 2-tailed correlation is significant |
|||||||
Correlation analysis for both air quality and meteorological parameters were examined during winter season for the year 2017, 2018 and 2019 (Table 9). The results revels some of the relations like SO2 shows significant positive correlate with NO2 (r =0.934, p <0.05), Humidity (r =0.915, p < 0.05) and Rainfall (r = 0.875, p < 0.05) but significant negative correlate with PM10 (r =-0.960, p < 0.05) and shows not significant negative correlate with PM2.5 (r =-0.725, p > 0.01). NO2 shows significant negative correlate with PM10 (r =-0.847, p < 0.05), significant positive correlate with Humidity (r =0.817, p < 0.05), showed not significant positive correlate with Rainfall (r = 0.745, p > 0.01) and not significant negative correlate with PM2.5 (r =-0.725, p > 0.01). PM10 shows significant negative correlate with Humidity (r =-0.864, p < 0.05) and Rainfall (r =-0.843, p < 0.05). PM2.5 shows not significant correlate with Temperature (r =-0.736, p >0.01). Humidity shows positive significant correlate with Rainfall (r =0.940, p <0.01).
Overall Correlation
Table 10: Overall correlation between parameters.
|
PARAMETERS |
SO2 |
NO2 |
PM10 |
PM2.5 |
TEMP |
HUMIDITY |
RAINFALL |
|
SO2 |
1 |
||||||
|
NO2 |
-.320 |
1 |
|||||
|
PM10 |
.064 |
.325 |
1 |
||||
|
PM2.5 |
-.496** |
.404* |
.452* |
1 |
|||
|
TEMP |
.160 |
-.691** |
-.447* |
-.371 |
1 |
||
|
HUMIDITY |
-.015 |
-.216 |
-.159 |
.109 |
.361 |
1 |
|
|
RAINFALL |
-.177 |
-.440* |
-.920** |
-.418* |
.605** |
.290 |
1 |
|
**At 0.01 level the 2-tailed correlation is significant |
|||||||
|
* At 0.05 level the 2-tailed correlation is significant |
|||||||
The correlation study during overall season for year 2017, 2018 and 2019 was examined (Table10). The outcomes of results were like SO2 shows significant negative correlate with PM2.5 (r =-0.496, p < 0.05). NO2 shows significant positive correlation with PM2.5 (r =-0.496, p < 0.01), significant negative correlate with Rainfall (r =-0.440, p < 0.01) and Temperature (r =-0.691, p <0.05). PM10 shows not significant positive correlate with PM2.5 (r =0.452, p > 0.01), negative correlate with Temperature (r =-0.447, p >0.01) and significant positive correlate with Rainfall (r =-0.920, p <0.05). PM2.5 shows not significant negative correlate with Rainfall (r =-0.418, p >0.01). Temperature shows significant positive correlate with Rainfall (r =0.605, p <0.05).
Multi-Dimensional Scaling (MDS)
Multidimensional scaling (MDS) is a technique helps to produce a map visualizing the level of similarity of individual cases of a dataset. By the help of MDS different air pollutants (SO2, NO2, PM10 and PM2.5) and Meteorological Parameters (Temperature, Humidity and Rainfall) were grouped on the basis of similarities or distances between themselves. The MDS was done using SPSS Software. The summer season MDS was draw out three groups by integrating 7 variables as shown in Figure 3. The groups were consisting of SO2, PM10 and Temperature in one group, Humidity and PM2.5 in second group, Rainfall and NO2 in third group.
 |
Figure 3: MDS graph of summer season. Click here to View figure |
From Figure 4 we observed that, the rainy season MDS was extracted three groups by combining seven parameters. Group one consists of NO2, PM10 and Humidity. Second group is having Temperature and Rainfall. Third group consists of PM2.5 and NO2.
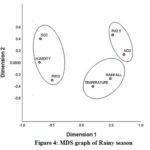 |
Figure 4: MDS graph of Rainy season. Click here to View figure |
From Figure 5 we found that, the winter season MDS was takeout one single group excluding Temperature, PM10 and PM2.5 from all the seven parameters. Parameters like, SO2, NO2, Humidity and Rainfall were present in a single group, but Parameters like Temperature, PM10 and PM2.5 were present far apart they could not be grouped.
 |
Figure 5: Winter season MDS graph. Click here to View figure |
From Figure 6 we observed that, the Overall MDS extracted two groups by combining 7 variables excepting SO2. Parameters like PM2.5, NO2 and PM10 were grouped in first one; Rainfall, Humidity and Temperature were present in second group. The SO2 parameter was present at much distance from two groups.
 |
Figure 6: Overall season MDS graph. Click here to View figure |
Analysis of Variances (ANOVA) Two Factor Without Replication:
ANOVA technique is used to analyse the differences along with group means in a sample. The ANOVA result of different parameters are given in Table 10. During summer season it was found that in between rows the F value was remains less then F critical value and the p-value was more than alpha (0.05), so the null hypothesis was accepted which indicate there was no relationship between different sites. But in between parameters the p-value was remains above the alpha value (0.05) and the F value was remains greater than F critical value which indicates that there are some statistically significant to the relationship between parameters and this leading you to reject the null hypothesis for the greater F value. During seasons the results of rainy, winter and overall season were showed similar to summer season.
Table 10: Analysis of Variance of different seasons.
|
SUMMER SEASON |
||||||
|
Source of Variation |
SS |
df |
MS |
F-value |
P-value |
F crit |
|
Sites |
7345.43 |
7 |
1049.34 |
1.91 |
0.09 |
2.29 |
|
Parameters |
58696 |
5 |
11739.20 |
21.39 |
0.04 |
2.49 |
|
RAINY SEASON |
||||||
|
Source of Variation |
SS |
df |
MS |
F-value |
P-value |
F crit |
|
Sites |
2058.70 |
7 |
294.10 |
0.83 |
0.57 |
2.29 |
|
Parameters |
354867.20 |
5 |
70973.44 |
200.08 |
0.03 |
2.49 |
|
WINTER SEASON |
||||||
|
Source of Variation |
SS |
df |
MS |
F-value |
P-value |
F crit |
|
Sites |
216.50 |
7 |
30.92 |
0.29 |
0.95 |
2.28 |
|
Parameters |
39395.27 |
5 |
7879.05 |
74.78 |
0.04 |
2.49 |
|
OVERALL SEASON |
||||||
|
Source of Variation |
SS |
df |
MS |
F-value |
P-value |
F crit |
|
Sites |
60644.51 |
25 |
2425.78 |
0.97 |
0.51 |
1.59 |
|
Parameters |
274737.63 |
5 |
54947.52 |
22.00 |
0.002 |
2.28 |
Conclusion
The present study was attempted to record the seasonal variations of meteorological and air quality parameters along the city coastal state of Odisha, Baleswar. Analyses of our data sets showing that SO2 and NO2 concentration during summer, rainy and winter season are within the prescribe standard of NAAQS by CPCB but PM10 and PM2.5 are above the prescribed standard except PM2.5 concentration of rainy season in year 2019. Air pollution index is remaining in the condition between clean air (CA) to moderate air pollution (MAP) and it shows that the pollution index in all the sites are reducing from the year 2017 to 2019 may be due to enhancing technologies to reduce the pollutant concentration in air. The meteorological factors like temperature, rainfall and humidity are playing a vital role in determine air quality of a city and impacts up on health of human life. Temperature, rainfall and humidity are becoming worse day to day due to enormous industrial development around the city with increasing the numbers of population. Hence, there should be periodic and continuous monitoring of criteria air pollutants and meteorological parameters which will grant and imminent in to various issues over a long period of time. Since, arranged urban improvement gives off an impression of being troublesome in the nearby conditions and dealing with the contamination issue with basic info doesn’t turn out to be simple as in numerous other urban zones over the globe, the plausible state of contamination might be disturbed in future. By the use of pollution control devices and various advance apparatus the air pollution can be controlled, as well as embracing relief measures by expanding vegetation spread or green belt.
Acknowledgement
All the authors are like to express gratitude to Department of Environmental sciences, Sambalpur University, Meteorological Department and Forest & Environment Department, Odisha, India for their whole hearted support to accomplish this research work.
References
- Origin of Earth: https://www.cs.mcgill.ca/~ rwest/wikispeedia/ wpcd/wp/h/History_of_Earth.htm.
CrossRef - Abas N; Saleem M. S.; Kalair E.; Cooperative control of regional transboundary air pollutants. Environ Syst Res; 2019; 8, 10. https://doi.org/10.1186/s40068-019-0138-0.
CrossRef - Manisalidis I.; Stavropoulou E.; Stavropoulos A.; Bezirtzoglou E.; Environmental and Health Impacts of Air Pollution: A review. Front. Public Health 2019; 8:14. doi:10.3389/fpubh.2020.00014.
CrossRef - Graue B.; Siegesmund S.; Oyhantcabal P.; The effect of air pollution on stone decay: the decay of the Drachenfels trachyte in industrial, urban, and rural environments—a case study of the Cologne, Altenberg and Xanten cathedrals. Environ Earth Sci; 2013; 69, 1095–1124.
CrossRef - De Sario M., Katsouyanni K., Michelozzi P.; Climate change, extreme weather events, air pollution and respiratory health in Europe. European Respiratory Society; 2013; 42(3): 82-843.
CrossRef - Venkatesan P.; WHO report: air pollution is a major threat to health. Lancet Respir Med. 2016;4(5):351.
CrossRef - Landrigan PJ. Air pollution and health. Lancet Public Health. 2017;2(1):4–5.
CrossRef - World Health Organization (WHO) WHO releases country estimates on air pollution exposure and health impact., 2018; March 12; Available from: http://www.who.int/mediacentre/news/releases/2016/air-pollution-estimates/en.
CrossRef - Apte K.; Salvi S.; Household air pollution and its effects on health. F1000Research, 2016; 5, 2593. doi:10.12688/f1000research.7552.1.
CrossRef - Khreis H.; Kelly C.; Tate J.; Parslow R., Lucas K.; Nieuwenhuijsen M.; Exposure to traffic-related air pollution and risk of development of childhood asthma: a systematic review and meta-analysis. Environ Int.; 2017; 100:1–31.
CrossRef - Jacobs M., Zhang G., Chen S., Mullins B., Bell M., Jin L.;The association between ambient air pollution and selected adverse pregnancy outcomes in China: a systematic review. Sci Total Environ; 2017; 579:1179–92.
CrossRef - Sweileh W. M., Al-Jabi S.W., Zyoud S.H.; Outdoor air pollution and respiratory health: a bibliometric analysis of publications in peer-reviewed journals (1900 – 2017);Multidiscip Respir Med; 2018; 13, 15.https://doi.org/10.1186/s40248-018-0128-5.
CrossRef - Katoto P. D. M. C., Byamungu L., Brand A. S., Mokaya J., Strijdom H., Goswami N., Nemery B.; Ambient air pollution and health in Sub-Saharan Africa: Current evidence, perspectives and a call to action. Environmental Research. ;2019; doi:10.1016/j.envres.2019.03.029.
CrossRef - Brauer M., Freedman G., Frostad J., van Donkelaar A., Martin R.V., Dentener F., Dingenen R. van., Estep K., Amini H., Apte J. S.; Ambient air pollution exposure estimation for the Global Burden of Disease 2013. Environ. Sci. Technol.; 2016; 50, 79–88. https://doi.org/10.1021/acs.est.5b03709.
CrossRef - Kim K. H., Jahan S. A., Kabir E.; A review on human health perspective of air pollution with respect to allergies and asthma. Environment International, 2013; 59, 41–52.
CrossRef - Jarvis D. J., Adamkiewicz G., Heroux M. E.; Nitrogen dioxide. In: WHO Guidelines for Indoor Air Quality: Selected Pollutants. Geneva: World Health Organization; 2010; 5. Available from: https://www.ncbi.nlm.nih.gov/books/NBK138707.
- Kurt O. K., Zhang J., Pinkerton K E.; Pulmonary health effects of air pollution. Current Opinion in Pulmonary Medicine, 2016; 22(2), 138–143.
CrossRef - Ghorani A. A., Riahi Z. B., Balali M. M.; Effects of air pollution on human health and practical measures for prevention in Iran. Journal of research in medical sciences: the official journal of Isfahan University of Medical Sciences. 2016; 21, 65. https://doi.org/10.4103/1735-1995.189646.
CrossRef - Gareth J., Louise S.; Time series: forecasting, simulations, applications. Ellis Horwood Limited, Chichester. ; 1993.
- Spyros M., Michele H.; ARMA models and the Box–Jenkins methodology. J Forecast. 1997; 16:147–163.
CrossRef - Zhang H., Wang Y., Hu J., Ying Q., Hu X. M.; Relationships between meteorological parameters and criteria air pollutants in three megacities in China. Environmental Research., 2015; 140, 242–254.
CrossRef - Grinn-Gofroń A., Strzelczak A., Wolski T.; The relationships between air pollutants, meteorological parameters and concentration of airborne fungal spores. Environmental Pollution.; 2011; 159(2), 602–608.
CrossRef - Khedairia S., Khadir M. T.; Impact of clustered meteorological parameters on air pollutants concentrations in the region of Annaba, Algeria. Atmospheric Research., 2012; 113, 89–101. doi:10.1016/ j.atmosres.2012.05.002.
CrossRef - Zlauddin A., Siddiqui N. A.; Air quality index (AQI)—a tool to determine ambient air quality. Pollut Res., 2006; 25:885–887.

This work is licensed under a Creative Commons Attribution 4.0 International License.
About The Author
![]()
A New Edition of Web of Science
Journal Impact Factor
2022: 0.5
Five Year: 0.8
Journal is Indexed in

Cabells Whitelist
![]()


