Comparative Study on Quantification of Total Catechins Using UV-Vis Spectrophotometric Method and High Performance Liquid Chromatography Techniques
Sitharanjan Kalidass1* , Karuppannau Daiyarvijaya2 and Rajagopal Raj Kumar3
1Development and Research Centre, Bharathiar University, Coimbatore 641 046, Tamil Nadu, India.
2Department of Chemstry, PSNA College of Engineering and Technology, Dindigul 624 001, Tamil Nadu, India
3UPASI Tea Research Foundation, Tea Research Institute, Valparai 642 127, Coimbatore District, Tamil Nadu, India
Corresponding Author E-mail: skalidassupasi@rediffmail.com
DOI : http://dx.doi.org/10.13005/ojc/370118
Article Received on : 26-Dec-2020
Article Accepted on :
Article Published : 13 Feb 2021
Bioavailability of catechinsin wider range of plants was established earlier and it’s utility as medicine against cardiovascular disease, cancer, etc. were also demonstrated. Recent techniques in relation to quantitative analysis of total catechins seem to be laborious and time consuming process to handle huge number of samples. Established spectrophotometry and HPLC methods developed earlier for quantitative determination of total catechins in tea extracts were compared in the present study.UV-Vis spectrophotometric method was adopted to monitor the absorbance at 500 nm of the reaction mixture (catechins and vanillin-H2SO4reagents). Hewlett Packard automated HPLC was used and equipped with Phenomenex Luna 5 phenyl-hexyl column fitted with a Phenomenex guard column. Binary elution was carried out using Mobile phase A (acetic acid and acetonitrile) and Mobile phase B (acetonitrile). Method adopted showed a good resolution of catechin fractions and was found to be accurate for the quantification of total catechins (sum of individual catechins). Results of the both the methods are comparable and variation amongst the two methods ranged between -3.59 and 2.79% among the clones and varied with seasons.As expected UPASI released tea clones exhibited variations in their bioavailability. Lean season edge over the cropping period sampling in terms of total catechins. Results obtained from both the methods are comparable. Two methods can be used for the routine quantitative analysis of total catechins; however, spectrophotometric method found to be simple, rapid and cost effective than that of HPLC method unless individual catechins composition is warranted.
KEYWORDS:Catechin Quantification; HPLC; Tea; UV-Vis
Download this article as:| Copy the following to cite this article: Kalidass S, Daiyarvijaya K, Kumar R. R. Comparative Study on Quantification of Total Catechins Using UV-Vis Spectrophotometric Method and High Performance Liquid Chromatography Techniques. Orient J Chem 2021;37(1). |
| Copy the following to cite this URL: Kalidass S, Daiyarvijaya K, Kumar R. R. Comparative Study on Quantification of Total Catechins Using UV-Vis Spectrophotometric Method and High Performance Liquid Chromatography Techniques. Orient J Chem 2021;37(1). Available from: https://bit.ly/3rVkcEI |
Introduction
In tea breeding, selection for high quality genetic material is warranted where the varietal selection programme requires precise information on the diversity existing germplasm and also careful study on the biochemical which contributes towards the quality precursors. Among the biochemical constituents, flavanols (catechins) considered as an important criterion which could be used as a tool to identify the potential tea accession1,2; also it determines the quality of commercial made tea besides its medicinal value.Individual proportion of tea catechins could be important in the determination of quality and genetic diversity3.
Earlier, methods have been developed to quantify the catechins/catachin fraction(s) using spectrophotometer, high performance liquid chromatography (HPLC), reverse phase (RP) HPLC and ultra-performance liquid chromatography, etc.4-11. However, employing sophisticated instrumentation techniques in the initial screening process seem to be laborious and time consuming process. Similarly, applying above techniques in quantifying the total catechins with huge number of commercial green/black tea samples and other herbal formulations, necessitated to relook into conventional, simple spectrophotometry in order to quantitative analysis of total catechins. Present investigation designed to evaluate and validate the spectrophotometry against modern HPLC technique.
Materials and methods
Sample Collecting Site/Farm
The experimental site was located at the UPASI Tea Research Foundation, Tea Research Institute’s Experimental Farm situated in the Anamallai hill range (Western Ghats), Coimbatore District, Tamil Nadu, India. It lies between 10o 30’ N latitude and 77o 0’ E longitude at an altitude of 1050 meters above MSL12. Soils of the Anamallai can be distinguished as clay, clayey loam and loam with laterite sub-soil. Soils are highly acidic with a pH ~4.6. Experimental site experienced the decennial mean maximum temperature ranged from 24 to 27oC and the minimum between 14 and 17oC. The Anamallais which enjoys an annual precipitation of approximately 400 cm, distributed throughout the year; it receives the Lion’s share during south west monsoon followed by north east monsoon. Relative humidity recorded during 08.30 hours was ~85% while it was <70% during 14.30 hours13.
Collecting Source and Status of the Plants
Plants grown at Tea Research Experimental Farm formed as sample collecting source. Tea clones/accessions were planted between 1964 and 1965. Tea plants were pruned at 24″ to ease harvesting the crop at periodic interval. All agronomic practices like fertilizer application, plant protection measures and foliar application of nutrients were done uniformly as per the UPASI recommendations14.
In order to study the clonal variation, nine UPASI released clones (UPASI-1, UPASI-3, UPASI-5. UPASI-9, UPASI-10, UPASI-12, UPASI-13, UPASI-15, UPASI-17 and UPASI- 22) were subjected to flavanolanalysis and to validate modern HPLC method against conventional UV-visible spectrometer technique.Irrespective of the clone/accession, harvested crop shoots comprisedof two to three leaves and a bud were utilized as experimental samplesfor total catechins quantification using UV-Vis technique and estimation of flavanol composition.Regular sampling was done both during crop and lean seasons of an agricultural year.
Preparation of Alcoholic Extract for Total Catechin Quantification
Tea shoots comprising two to three leaves and a bud (about 1.0 g) were weighed and ground well with absolute ethyl alcohol. The contents were filtered and the filtrate was made upto 50 mL with ethyl alcohol. Alcoholic extract was used for estimation of total catechins using UV-Vis method.One mL of the alcoholic extract was diluted to 50 mL with distilled water. To the 2.0 mL of the diluted extract, 6.5 mL of ice cold vanillin (1% vanillin in 70% sulphuric acid) was added slowly to avoid immediate colour development. The contents were made upto 10 mL with distilled water, shaken well and allowed to stand still for 15 minutes for completion of reaction. Absorbance of the orange colour developed was read at 500 nm against the reagent blank in PerkinElmer Lambda–35 UV-Visible spectrophotometer. Amount of catechins present in tea leaves were calculated using the standard calibration curve computed with the values obtained against known concentrations (5 to 25 ppm) of (+) catechin (Sigma Chemicals Private Limited, Bangalore) and the results were expressed as per cent catechin equivalents15.
Sample Preparation for Catechin Fractions Using HPLC
Field collected tea samples were oven dried at about 70 + 5oC for 24 hours. Completely dried samples were macerated using pestle and mortar, sieved and the fine powder was used for extraction. Powdered sample (0.1 g) was extracted using 5.0 ml of 70% methanol on a water bath maintained at 70oC for 30 minutes. Extraction was repeated with equal volume of methanol, centrifuged and the supernatant was made up to 10 ml. One ml of the extract was diluted to 5.0 ml with stabilising solution (0.25% each of EDTA and ascorbic acid in 10.0% acetonitrile). Sample was filtered through 0.20 m nylon membrane filter and used for high performance liquid chromatograph analysis.
Hewlett Packard 1100 Series automated HPLC was used for the study and the system was equipped with Phenomenex Luna 5 m phenyl-hexyl column (250 mm length x 4.6 mm internal diameter) fitted with a Phenomenex guard column (4 x 3 mm phenyl hexyl bonded catriage). Column temperature was maintained at 35 + 0.5oC. Absorbance of compounds was measured at the wave length of 278 nm. Binary elution was carried out using Mobile phase A (2.0% acetic acid and 9.0% acetonitrile) and Mobile phase B (80% acetonitrile). Gradient programme was used where 100% Mobile phase A for 10 minutes then over 15 minutes a linear gradient of 68% mobile phase A followed by 32% Mobile phase B and hold at conditions for 10 minutes. Then rest to 100% Mobile phase A and allowed to equilibrate for 10 minutes before next injection16.
Standards (gallic acid, epigallocatechin, (+) catechin, epicatechin, epigallocatechingallate, caffeine and epicatechingallate) procured from Sigma Aldrich, USA were used for preparation of calibration curve. Data integration was performed using HPLC Chemstation Software. Individual catechin fractions were computed and presented as per cent corresponding individual catechin fractions/g dry weight17.
Data analysis
Statistical analysis of the generated data were analysed statistically for analysis of variance (ANOVA) and the differences that existed among the results were compared with standard error mean (S.E. mean) and critical difference (C.D.) at five per cent probability18. In order to understand the relationship that existed among the catechins and its wave length absorption were regressed using the special purpose statistical software.
Results and Discussion
Time requirement for preparative analysis of both UV-Vis spectrometry and HPLC methods for quantitative analysis of total catechinsis illustrated as Fig.1. Leaving the time required for collection of crop shoots and preparation of reagents/mobile phase and reference standards required almost identical duration in both the cases. There was a vast variation existed with respect to time requirement, right from preparation of the samples till the analysis. Almost an hour is enough to quantify the total catechins adopting the UV-Vis spectrophotometer method while it was about to 28 hours in case of HPLC method. Leaving the drying of crop shoots for 24 hours or overnight, sample preparation and its analysis through HPLC requires almost 4 hours which is time consuming process with respect to total catechin quantification. Over and above solvents used once cannot be reused. HPLC method can be adopted wherever it required with particular reference to composition of individual catechins/relative distribution of catechin fractions.
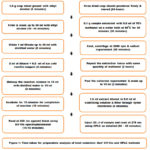 |
Figure 1: Time taken for preparative analysis of total catechins thro’ UV-Vis and HPLC methods |
Bee-Lan Lee and Choon-Nam Ong6 reported the comparative analysis of tea catechins and theaflavins by high performance liquid chromatography and capillary electrophoresis with green and black teas. They reported the tea polyphenols (inclusive of catechinfractionss) eluted 27 minutes by HPLC system and it was less than 10 minutes by capillary electrophoresis. The results explicitly corroborates with our findings with respect to HPLC analysis. However application of capillary electrophoresis to determine the total catechins seems to be laborious.
Catechins and vanillin reagent complex developed orange colour which absorbed the wavelength of 500 nm under UV-Visspectrophtometer. Calibration curve obtained for the various concentrations of standard, (+) catechin showed linearity (Fig.2).As the catechin standard concentration increased from 5 to 25 ppm, the absorbance (optical density) value increased concurrently. Results indicated that the concentration of (+) catechin had good linear relationship fitting the regression equation, Y = a + bx where a = 0.673, b = 45.54 and x is the absorbance value and with a linear correlation coefficient (r2)of0.9964.To validate the linear regression equation, randomly collected crop shoots of tea plants subjected to total catechin content using UV-Vis spectrophotometer method. Tea extracts of unknown origin (seedlings) recorded as high as 17.50% of total catechins (Table 1).
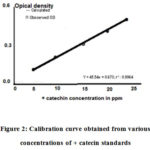 |
Figure 2: Calibration curve obtained from various concentrations of + catecin standards. |
Table 1: Total catechin content of seedling teass quantified using UV-Vis pectrophtometer.
|
Sample number |
Catecin content (%) |
Sample number |
Catecin content (%) |
|
1 |
14.19 |
9 |
15.56 |
|
2 |
15.73 |
10 |
16.43 |
|
3 |
16.01 |
11 |
16.09 |
|
4 |
15.18 |
12 |
16.53 |
|
5 |
17.50 |
13 |
16.90 |
|
6 |
14.86 |
14 |
15.34 |
|
7 |
16.25 |
15 |
16.42 |
|
8 |
15.77 |
16 |
17.01 |
Contrary to the present results, Heet al.8 established that the spectrophotometric method used to monitor the change in absorbance that occurs during the reaction between catechins and vanillin-HCl reagents. The catechin-vanillin complex showed peak absorbance at 505 nm. Developed spectrometric method showed varying results with individual catechin fractions and authors suggests that proper choice of standard is required for the spectrophotometric quantification of total catechins. In the present study, (+) C was used as reference standard; but unlike the previous report8, in the present study, calibration curve of (+) C and regression formula derived from spectrophotometric method and the results obtained with HPLC method were comparable.
It may be noted thatthe methods described by Swain and Hillis15 was adopted for determination of total catechins. In the present study, vanillin reagent was prepared with 70% sulphuric acid instead of HCl as reported by Heet al.8. Vanillin reagent was added with sample with ample care to avoid sudden generation of heat and thereby immediate development of colour. In order to avoid the above circumstances, ice cold reagent was used besides the sample containing test tubes were kept in an ice bath. In the present study the reaction mixture was read at 500 nm in UV-Vis spectrophotometer, unlike 505 nm as reported by Heet al.8.
The extracted sample from dried green leaves was analysed on HPLC under the predetermined conditions. Among the catechin fractions, epigallocatechin (EGC) was eluted first (Fig. 3) followed by simple catechin (+C), epicatechin (EC), epigallocatechingallate(EGCG) and epicatechingallate (ECG). In the present study, fractions of the catechins eluted between 8.829 and 23.723 minutes (Retention time).
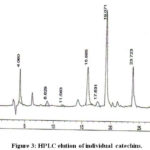 |
Figure 3: HPLC elution of individual catechins. |
Retention times of individual catechins: 4.060 – gallic acid; 8.820 – epigallocatechin; 11.563 – simple catechin; 15.885: caffeine; 17.631 – epicatechin; 19.071 – epigallocatechin gallate; 23.723; epicatechin gallate
Andreas et al.19 reported a simple, rapid and precise high performance liquid chromatography analysis of tea cateechins and they claimed that the technique they reported can be applied to all kinds of tea and tea products the method superior to detect too low concentrations of catechins.
As an integral part of the study, crop shoots collected from 10 different tea clones were subjected to total catechin analysis adopting both UV-Vis spectrometry and HPLC method. Results obtained both during lean and crop seasons were presented individually (Tables 2&3). About one per cent variationwas observed between lean and crop seasons with respect to total catechins (mean values) where crop shoots sampled during lean season edge over the cropping period. As it was expected tea clones exhibited moderate to significant variation among them.
Table 2. Relative distribution of catechin fractions (HPLC method) and total catechins quantified using UV Vis spectrophotometer with crop shoots collected during lean season
|
…………………………. Distribution in per cent ……………………………… |
|||||||||
|
Clone |
Gallic acid |
EGC |
+C |
EC |
EGCG |
ECG |
Total |
UV cat |
Variation% |
|
UP-1 |
0.55 |
0.87 |
0.53 |
0.87 |
13.20 |
1.26 |
17.28 |
17.55 |
-1.56 |
|
UP-3 |
0.31 |
0.74 |
0.75 |
1.12 |
12.23 |
1.38 |
16.53 |
16.75 |
-1.33 |
|
UP-5 |
0.25 |
0.29 |
0.31 |
0.82 |
12.38 |
1.27 |
15.32 |
15.84 |
-3.39 |
|
UP-9 |
0.18 |
0.26 |
0.56 |
1.84 |
11.82 |
1.89 |
16.55 |
16.97 |
-2.54 |
|
UP-10 |
0.34 |
0.68 |
0.68 |
1.85 |
12.18 |
1.82 |
17.55 |
17.25 |
1.71 |
|
UP-12 |
0.23 |
0.37 |
0.93 |
1.62 |
11.19 |
1.29 |
15.63 |
15.79 |
-1.02 |
|
UPI-13 |
0.34 |
0.46 |
0.93 |
1.71 |
10.67 |
1.24 |
15.35 |
15.66 |
-2.02 |
|
UP-15 |
0.47 |
0.64 |
0.86 |
1.33 |
12.31 |
1.35 |
16.96 |
17.25 |
-1.71 |
|
UP-17 |
0.52 |
0.62 |
0.69 |
1.79 |
12.59 |
1.96 |
18.17 |
17.76 |
2.26 |
|
UP-22 |
0.28 |
0.32 |
0.89 |
1.68 |
10.25 |
1.97 |
15.39 |
15.72 |
-2.14 |
|
S.E. mean |
0.04 |
0.09 |
0.12 |
0.23 |
0.82 |
0.16 |
0.49 |
0.37 |
– |
|
C.D. @ 5%: |
0.08 |
0.18 |
0.25 |
0.46 |
1.64 |
0.32 |
0.99 |
0.74 |
– |
Table 3: Relative distribution of catechin fractions (HPLC method) and total catecins quantified using UV Vis spectrophotometer with crop shoots collected during crop season.
|
…………………………. Distribution in per cent ……………………………… |
|||||||||
|
Clone |
Gallic acid |
EGC |
+C |
EC |
EGCG |
ECG |
Total |
UV cat |
Variation % |
|
UP-1 |
0.51 |
0.73 |
0.48 |
0.83 |
12.41 |
1.18 |
16.13 |
15.76 |
2.31 |
|
UP-3 |
0.34 |
0.67 |
0.64 |
1.04 |
11.86 |
1.20 |
15.75 |
15.88 |
-0.83 |
|
UP-5 |
0.30 |
0.25 |
0.30 |
0.70 |
11.88 |
1.26 |
14.69 |
14.90 |
-1.42 |
|
UP-9 |
0.25 |
0.29 |
0.53 |
1.66 |
10.99 |
1.83 |
15.55 |
15.48 |
0.46 |
|
UP-10 |
0.31 |
0.63 |
0.65 |
1.79 |
11.21 |
1.69 |
16.27 |
16.52 |
-1.53 |
|
UP-12 |
0.22 |
0.36 |
0.86 |
1.56 |
10.74 |
1.19 |
14.92 |
15.16 |
-1.59 |
|
UP-13 |
0.29 |
0.43 |
0.83 |
1.62 |
10.24 |
1.12 |
14.53 |
15.05 |
-3.59 |
|
UP-15 |
0.40 |
0.57 |
0.83 |
1.26 |
11.08 |
1.28 |
15.42 |
15.78 |
-2.31 |
|
UP-17 |
0.45 |
0.55 |
0.67 |
1.68 |
11.71 |
1.74 |
16.81 |
16.34 |
2.79 |
|
UP-22 |
0.31 |
0.31 |
0.83 |
1.50 |
9.94 |
1.87 |
14.76 |
14.98 |
-1.46 |
|
S.E. mean |
0.07 |
0.11 |
0.19 |
0.19 |
0.54 |
0.21 |
0.36 |
0.42 |
– |
|
C.D. @ 5%: |
0.13 |
0.22 |
0.37 |
0.40 |
1.08 |
0.42 |
0.71 |
0.83 |
– |
EGC: epigallocatechin; +C: simple catechin; EC: epicatechin; EGCG: epigallocatechingallate; ECG:epicatechingallate; Total: sum of catechin fractions; UV cat: total catechin quantified with UV-Vis method; Variation %: % variation observed between HPLC and UV-Vis methods; UP: UPASI; S.E. mean: standard error mean and C.D. @ 5%: critical difference (among the clones) at five percent level
Analysis of the generated data with HPLC quantification, UPASI-17 registered significantly higher total catechins (sum of individual catechins) followed by UPASI-10 and UPASI-1. There was a slight deviation with respect to UV-Vis technique, where UPASI-17 recorded significantly higher values of total catechins followed by UPASI-1 and UPASI-10 (Table 2). It may be noted that seasons influenced the biosynthesis of metabolites. When compared to that of lean season, bioavailability of total catechins exhibited divergent trend during crop periods in connection with UV-Vis data.It is pertinent to mention that UPASI-10 registered higher amount of total catechins followed by UPASI-17; however, the values are statistically not significant at five per cent probability (Table 3).
Catechins and its fractions in south Indian tea clones were described by Saravananet al.20 and Jibu Thomas21. Results obtained in the present study substantiated the earlier findings with regard to clonal variation. Factors influencing the bioavailability of catechins were reported earlier22,23. Data generated in the present study supported their findings with reference to seasonal variations.
The study aimed to validate the spectrophotometric method to quantify total catechins and confirmed with results obtained with HPLC where the results are comparable. Considering the time factor, potentials, cost effective, simple and reproducible for the quantification of total catechins using spectrophotometric method was envisaged to be highly beneficial for the tea industries. Considering the cost, time factor, tedious procedure and demands highly skilled personnel, spectrophotometric method can be employed for the determination of total catechins unless the relative distribution of catechin fractions are required, specifically.
Acknowledgement
none
Conflicts of Interest
The authors declare no conflicts of interest.
References
- Obanda, M and Owuor, P.O. Flavanols compositions and caffeine content of green leaf as quality potential indicators of Kenyan black teas.1997.Jour. Sci. Food. Agric. 74: 209-215.
CrossRef - Owuor, P.O. and McDowell, I.J. Changes in the theaflavin composition and astringency during balck tea fermentation.1994.Food Chemistry51: 251-254.
CrossRef - DiandianShen, Qingli Wu, Mingfu Wang, Yonghong Yang, Edmond J. Lavoie and James E. Simon. Determination of the predominant catechins in Acacia catechu by liquid chromatography/electrospray ionization-mass spectrometry.2006.J. Agric. Food Chem. 54 (9):3219-3224.
CrossRef - Bonoli, M., Pelillo, M., Toschi, T.G. and Lercker, G. Analysis of green tea catechins: comparative study between HPLC and HPCE. Analytical, 2003. Nutritional and Clinical Methods Section. Food Chemistry81 (4): 631-638.
CrossRef - Bee-Lan Lee and Choon-Nam Ong. Comparative analysis of tea catechins and theaflavins by high performance liquid chromatography and capillary electrophoresis.2000. Journal of Chromatography A881 (1-2): 439-447.
CrossRef - Fernando, C.D. and Soysa, P. Simple isocratic method for simultaneous determination of caffeine and catechins in tea products by HPLC.2016. Springerplus5: 970–974. pmid:27429880.
CrossRef - He, Q., Yao, K., Jia, D., Fan, H., Liao, X. and Shi, B. Determination of total catechins in tea extracts by HPLC and spectrophotometry. 2009. Nat Prod Res. 23: 93–100. pmid:19140075.
CrossRef - Lee, L.S., Kim, S.H., Kim, Y.B. and Kim, Y.C. Quantitative analysis of major constituents in green tea with different plucking periods and their antioxidant activity.2014.Molecules19: 9173–9186.
CrossRef - Qing Huo, Jing Hao and Rongjian Shi. Determination of catechin by high performance liquid chromatography and ultraviolet
spectrophotometer. 2013.AsianJournal of Chemistry25 (16): 8940-8942.
CrossRef - Zhao, Y., Chen, P., Lin, L., Harnly, J.M., Yu (Lucy), L. and Li, Z. Tentative identification, quantitation, and principal component analysis of green Pu-erh, green, and white teas using UPLC/DAD/MS.2011.Food Chem. 126: 1269–1277.
CrossRef - Raman, K., Ayyappan, P. and Raj Kumar, R. Crop productivity in south Indian teas. Effect of Paras Photosynth. pp. 51-56. In: Proc. Symp. on “Plantation opportunities in India. Srivastava, H.C. and Menon, K.K.G. (eds.). Oxford and IBM Publishing Company Private Limited, New Delhi, India. 1986.
CrossRef - Raj Kumar, R. and Mohan Kumar, P. Climatic change adaptation strategies in agriculture: Influence of ecological variables on productivity in tea. pp. 139-153. In: Proceedings of the National Seminar on Climatic Change adaptation strategies”. G.S.L.H.V. Prasada Rao, A.V.R. Kesava Rao and D. Alexander (eds.). Centre for Climatic Change Research, Kerala Agricultural University, Vellanikkara, Trissur, Kerala. 2009.
- Durairaj, J., Radhakrishnan, B., Hudson, J.B. and Muraleedharan, N. Guidelines on tea culture inn south India. Ninth Revised Edition. ISBN 81-7764-345-2. United Planters’ Association of Southern India, Glenview, Coonoor 643 001, TheNilgiris, Tamil Nadu, India.2015.
- Swain, T. and Hillis, W.E. The phenolic constituents of Prunusdomestica. I. The quantitative analysis of phenolic constituents. 1959. Journal of the Science of Food and Agriculture10: 63-68.
CrossRef - ISO Committee Draft. Tea – method for determination of substances characteristic of green and black tea. Part 2. Determination of catechins in green tea: methods using high performance liquid chromatography. 1999. ISO/TC34/Sc 8 N 488.
- Jibu Thomas, Saravanan, M., Raj Kumar, R. and Pius, P.K. Influence of age after pruning on the levels of flavanols and other bioconstituents in tea (Camellia sinensis). J. Sci. Food Agric.2005.85: 931-934.
CrossRef - Gomez, K.A. and Gomez, A.A. Statistical procedure for agricultural research. John Wiley and Sons, New York. 1984. p. 20-30.
CrossRef - Andreas, A., Dian M., Linar Z. Udin., Hendris H. Kurniawan, Oman, Z., Sri Handayani, and Euis, F.. Validated method for direct determination of cathechins by high performance liquid chromatography.2019.https://doi.org/10.1063/1.5097477.
CrossRef - Saravanan, M., Mariya John, K.M., Raj Kumar, R. Pius, P.K. and Sasikumar, R. Genetic diversity of UPASI tea clones (Camellia sinensis (L.) O. Kuntze) on the basis of total catechins and their fractions. Phytochemistry2005. 66: 561-565.
CrossRef - Jibu Thomas. Biomarkers’ to elucidate the desirable traits for quality and yield in tea (Camellia spp.) germplasm. A thesis submitted to the Bharathiar University, Coimbatore, Tamil Nadu, Indiafor the degree of Doctor of Philosophy in Botany. 2008.p. 93.
- Saravanan, M. Studies on catechin metabolism in tea (Camellia spp.). A thesis submitted to the Bharathiar University, Coimbatore, Tamil Nadu, India for the degree of Doctor of Philosophy in Botany. 2006. p. 72.
- Shalini, D. Dynamics of certain enzymes involved in tea (Camelliasps.) plant metabolism. A thesis submitted to the Bharathiar University, Coimbatore, Tamil Nadu, India for the degree of Doctor of Philosophy in Botany. 2012.p. 94.

This work is licensed under a Creative Commons Attribution 4.0 International License.
About The Author
![]()
A New Edition of Web of Science
Journal Impact Factor
2022: 0.5
Five Year: 0.8
Journal is Indexed in

Cabells Whitelist
![]()


