Anti-Urolithiatic Activity of Silver Nanoparticles of Terminalia Chebula Bark
S. Vidhya* , A. Leema Rose, F. Janeeta Priya, T. Keerthana
and R. Priyadharshini
Department of Chemistry, Holy Cross College (Autonomous), Tiruchirappalli-620002, (Tamil Nadu), India.
DOI : http://dx.doi.org/10.13005/ojc/370114
Article Received on : 01-Feb-2021
Article Accepted on :
Article Published : 23 Feb 2021
The potential inhibitory action of herbals plays an indispensable role in modern medicine. The struvite crystal is an infectious stone related to urinary tract infection, hence the present study highlighted the anti-urolithiatic potential of Terminalia chebula bark mediated silver nanoparticles. Silver nanoparticles formation was confirmed by SPR band at 437nm. FT-IR spectroscopic studies suggested that phytoconstituents are primarily responsible for the reduction and capping of silver nanoparticles. TEM and XRD analysis revealed that the uniformity in shape and crystalline nature of T. chebula mediated silver nanoparticles. The single gel diffusion method was adopted to found the inhibition action of T.chebula mediated silver nanoparticles in struvite crystals. The inhibition efficiency was found to be 87.9 %, indicated that T. chebula mediated silver nanoparticles was a good inhibitor for the struvite crystals. The shift in band values of FTIR spectra confirms that the phyto constituents present in T. chebula bark is responsible for the anti-urolithiatic activity.
KEYWORDS:Anti-Urolithiatic Activity; Kidney Stone; Struvite Crystals; Terminalia Chebula Bark
Download this article as:| Copy the following to cite this article: Vidhya S, Rose A. L, Priya F. J, Keerthana T, Priyadharshini R. Anti-Urolithiatic Activity of Silver Nanoparticles of Terminalia Chebula Bark. Orient J Chem 2021;37(1). |
| Copy the following to cite this URL: Vidhya S, Rose A. L, Priya F. J, Keerthana T, Priyadharshini R. Anti-Urolithiatic Activity of Silver Nanoparticles of Terminalia Chebula Bark. Orient J Chem 2021;37(1). Available from: https://bit.ly/3bulOyG |
Introduction
Allopathic medicines are also known as modern medicine and it can be used in emergency situations like life threatening problems, accidents, and trauma by performing radiation therapy, chemotherapy, steroids, antibiotics and surgery1. The major drawback in modern medicine is it does not concentrate on the root of problematic diseased condition instead it treats only for diseased symptoms. The struvite crystal formation is a severe issue and it occurs due to higher level of salts in urine, urinary tract infection, and a decline of natural inhibitors which inhibit the crystal formation2. Origanum vulgare, Moringa oleifera, Asparagus racemosus, Rotula aquatica, Mimosa pudica, Trigonella foenum graecum, Nigella sativa, and Punica granatum these herbsinhibit the growth of the crystals forming the kidney stones3. The main aim of the present study is to synthesize and characterize the silver nanoparticles and to study its antiurolithiatic activity of the synthesized nanoparticles using bark of T. Chebula. This research provides a combining approach in characterizing struvite crystals which helps grown in vitro to assist, which formulate the prevention or dissolution strategies in preventing magnesium oxalate urinary stone growth4. Therefore the need of this research is to carry the trust effects of bark of T. Chebula at a different dose to subside the kidney stone formation.
Experimental
Preparation of bark extract of T. chebula
The T. chebula barks were collected and made into small pieces. The collected plant parts were thoroughly washed with tap water and air dried in a shadow that is free from sunlight till it becomes dried nicely. Then it is crushed in an electrical grinder and the powder was separated, which were stored individually in air-tight containers and kept in a cool, dark and dry place for further study. The methanol extract was prepared by taking 20g of the powdered sample and it is soaked in 40ml of methanol for 24hours. Then it was extracted using hot percolation method.
Preliminary phytochemical analysis and quantitative analysis
The preliminary phytochemical qualitative analysis was done using standard procedures5 and the quantification of phytochemical constituents such as alkaloids, flavanoids, saponins, phenols, tannins and terpenoids (mg/g) present in T.chebula was found using standard procedure6.
Synthesis and characterization of silver nanoparticles
5mM silver nitrate was prepared in a 100ml standard flask. 2.5ml of the sample is added to 50ml of 5mM silver nitrate with continuous and constant stirring which react at an ambient condition and Ag get reduced in to Ag+ ion. The color change was observed for the reaction mixture from transparent white to dark brown indicates the formation of silver nitrate. The presence of reduction of Ag+ ion was confirmed overtime by the UV-Spectral analysis. Characterization of synthesized nanoparticles were carried out to learn the characteristic wavelength and functional group bound to silver nanoparticles by UV-Vis spectra and FTIR and its size, crystalline nature and elemental composition using TEM, DLS, XRD and EDAX.
Struvite crystals growth and their characterization
Single diffusion reaction technique was employed7. A mixture of sodium meta silicate with pH 9.4 and ammonium dihydrogen phosphate of 0.5M was kept aside by maintaining the pH 6 for 2–3 days. By the completion of the gelation process, the supernatant solution containing 1M magnesium acetate was poured in to gel in various test tubes. After pouring the supernatant solution, the test tubes were closed with airtight stoppers. The room temperature (370c) was carried out for whole experiments. The compounds and structures of the crystals were characterized using FTIR verifying the grown struvite crystals. FTIR was carried out by HITACHI FTIR spectrophotometer techniques to obtain the purity and proper crystals formation.
Struvite crystals growth and the classification of different additive solution
The growth of struvite crystals in the presence of T. chebula bark mediated silver nanoparticles was carried out using gel method and the supernatant solutions allowed to settled and the results were recorded. The growth of struvite crystals were measured by average weight of the crystals which was studied in five series of 1% to 5 % solution containing T. chebula mediated silver nanoparticles.
I% inhibition were calculated based on the formula
I% = [(TSI-TAI)] / TSI X100
TSI represents the Crystal numbers without inhibitors
TAI represents the crystal number after the addition of inhibitors.
Results and Discussion
Preliminary phytochemical analysis and quantitative analysis
The phytochemical screening of T. chebula bark extract using different tests standards. The results revealed that T.chebula bark extract shows the presence of tannin, phlobatannin, saponin, flavanoids, steroids, terpenoids, cardiac glycoside, leucoanthocyanin, anthraquinone, coumarin, phenol, xanthoprotein, alkaloids, emodin, carbohydrates which are known to possess physiological and medicinal activities while Anthocyanin, glycosides and protein were absents. Qualitative analysis of bark of T.chebula (Fig. 1) reveals the presence of phytochemical constituents is the primary responsible for their biological activity.
 |
Figure 1: Qualitative analysis of bark of T. chebula. |
Quantitative analysis of bark of Terminalia chebula.
From the quantitative analysis the phytoconstituents present in bark of T. chebula in different amount have been reported. The phytoconstituents with higher quantity present in phenol followed by flavanoids, saponins, terpenoids, tannin and alkaloids. The compositions of phytoconstiuents are phenols(0.096mg/g), flavanoids(0.063mg/g), saponins (0.048mg/g), terpenoids (0.042mg/g), tannins (0.027mg/g), and alkaloids(0.003mg/g) shown in the Fig. 2. Phenolic compounds in plants are bunch of natural products possessing a different structure which are well explained for their significant and beneficial effect on human health or antioxidant and antimicrobial activities8,9.
 |
Figure 2: Quantitative analysis of T. chebula. |
Visual color change and UV-Vis spectroscopy.
In this experiment, addition of methanol extract of plant sample of T. chebula in to the glass vial containing AgNO3 led to the change in color from colorless to reddish brown as shown in Fig. 3 indicates the presence of silver nanoparticles. Plasma resonance band was observed by UV spectra at the range of 437nm related to literature reported in Fig. 4.
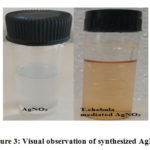 |
Figure 3: Visual observation of synthesized AgNps. |
 |
Figure 4: UV-Vis spectrum of synthesized AgNps of T.chebula. |
Functional group determination using FT-IR spectroscopy.
The FT-IR spectrum of methanol extract gives details about the functional group involved in the silver ions reduction. The FT-IR spectra of T. chebula bark extract (Fig. 5) and synthesized silver nanoparticles (Fig. 6). The following peaks are observed in bark extract are shown in table.1. Some of the peaks appeared in the FT-IR spectrum of bark extract, which were disappeared in FT-IR spectra of green synthesized silver nanoparticles. This disappearance of peaks is due to phytochemicals present in the bark extract, involves silver nanoparticles reduction.
 |
Figure 5: FTIR spectrum of T. Chebula bark extract. |
 |
Figure 6: FT-IR spectra of synthesized silver nanoparticles. |
Table 1: FTIR spectra of T. chebula bark extract.
|
Group freq. of the T.chebula bark cm-1 |
Assignment of functional group |
|
Strong band at 3396 |
OH Stretching vibration in alcohols |
|
Strong band 2886 |
Carboxylic acid OH Stretching |
|
Strong band 1732 |
C=O in aldehyde |
|
Medium band at 1378 |
O-H bending in alcohol |
|
Strong band 1294 |
NO2 in bending vibrations |
|
Strong band at 1127 |
C-O stretching in aliphatic ether |
|
Strong band at 708 |
C=C bending |
Table 2: FTIR spectra of T. chebula mediated silver nanoparticles.
|
Group freq. of the T.chebula mediated silver nanoparticles cm-1 |
Assignment of functional group |
|
Strong band at 3438 |
O-H Stretching and H-bonded |
|
Strong band 1192 |
C-N in aliphatic amine |
|
Strong band at 1106 |
C-O stretching in aliphatic ether |
|
Medium band at 1637 |
Medium C=C stretching conjugated alkenes |
|
Strong band at 620 |
C-Br stretching in Halo compound |
Transmission electron microscopy
TEM images of the synthesized silver nanoparticles at 20nm, 50nm scale are shown in Fig. 7. TEM image reveals that most of the synthesized silver nanoparticles are nearly spherical in shape and well dispersed. From the TEM image it is concluded that synthesized silver nanoparticles are almost uniform in shape and size.
 |
Figure 7: TEM image for T. Chebula bark mediated silver nanoparticles. |
Particle size analysis
The average size of the nanoparticles, particle size distribution, and polydispersity index (PDI) of the synthesized silver nanoparticles was characterized using particle size analyzer. The results are given in Fig. 8. The average particle size diameter of silver nanoparticles is 80nm and poly dispersity index is found to be 0.383. From the average particle size and PDI value it is found that produced nanoparticles are monodispersed in nature.
 |
Figure 8: Particle size distribution curve of T.chebula bark mediated AgNps. |
EDX analysis
Energy dispersive X-ray (EDX) spectrometer analysis confirmed the elemental signal of silver nanoparticles. The Y-axis (vertical) represents the number of X-ray counts while X-axis (horizontal) shows the energy in KeV. EDX spectrum recorded for the silver nanoparticles was shown in Fig. 9 with additional peak of oxygen because of biomolecules attached to the silver nanoparticles surface. From EDX spectra, it is found that silver nanoparticles are reduced by T. chebula have the silver weight percentage as 65.81% (Table 3).
 |
Figure 9: EDX spectrum of synthesized AgNps |
Table 3: Elemental composition of T. chebula mediated silver nanoparticles.
|
Element |
Wt% |
At% |
|
O |
34.19 |
77.29 |
|
Ag |
65.81 |
22.21 |
X-ray diffraction (XRD)
The crystalline nature of silver nanoparticles was confirmed using X-ray crystallography. The X-ray diffractogram pattern of synthesized silver nanoparticles was represented in Fig. 10. The intense diffraction peaks are obtained at 2Ɵ values 27.7794, 32.1627, 38.0824, 44.7077, 65.0407, 78.187 and 78.4575. The peak corresponds to 38.0824, 44.7077 following diffraction facets are (111), (200) respectively. This pattern shows the face centered cubic structure for silver according to (JCPDS, File No. 04-0783).Unassigned peaks are also present in the graph this may be due to extract contains some phytochemicals which may be capping the nanoparticles surface.
 |
Figure 10: XRD patterns of AgNps synthesized using a T. chebulabark extract. |
In vitro antiurolithiatic activity of T. chebula bark mediated silver nanoparticles.
The antiurolithiatic activity of T. chebula mediated silver nanoparticles was determined by the struvite crystals formation and it was characterized by its average weight and apparent length. Here we adopted gel method, where pure magnesium acetate acts as a control10. The crystal formation started within a day and it was monitored periodically to evaluate the harvested crystals (Fig. 11) and the datas were tabulated in table.4.
 |
Figure 11: T. Chebulav bark effect on struvite crystals in the gel method (a to h ). |
T. Chebulav bark effect on struvite crystals in the gel method (a) without any additive (b) with the distilled water (c) with the methanol (d) with the 1% synthesized Ag nanoparticles (e) with the 2% synthesized Ag nanoparticles (f) with the 3% synthesized Ag nanoparticles (g) with the 4% synthesized Ag nanoparticles (h) with the 5% synthesized Ag nanoparticles after 7 day.
From the tabulated data, it was clear that the growth of struvite crystals was inhibited in the presence of T. chebula mediated silver nanoparticles and the control medium with distilled water shows very less inhibition efficiency towards the crystal growth11. The silver ions capped with bio organic molecules present in the phyto constituents are responsible for the inhibition activity of T. chebula mediated silver nanoparticles.
Table 4: Harvested crystals percentage inhibition.
|
Crystal Name |
Class |
Analysis |
Harvested crystals(gm) |
Inhibition percentage |
|
Struvite |
A |
Control |
2.40 |
– |
|
B |
Control+ Distilled Water |
2.00 |
16.6% |
|
|
C |
Control + synthesized Ag nanoparticles |
1.42 |
40.8% |
|
|
D |
Control+ 1% synthesized Ag nanoparticles |
1.20 |
50% |
|
|
E |
Control+ 2% synthesized Ag nanoparticles |
0.79 |
67.08% |
|
|
F |
Control+ 3% synthesized Ag nanoparticles |
0.64 |
73.3% |
|
|
G |
Control+ 4% synthesized Ag nanoparticles |
0.40 |
83.3% |
|
|
H |
Control+ 5% synthesized Ag nanoparticles |
0.29 |
87.9% |
The morphology of the harvested crystal was monitored from the addition of the inhibitor periodically up to 7 days and the growned struvite crystals were displayed as in Fig. 12. By increasing the percentage of T. chebula bark mediated silver nanoparticles, the size was decrease gradually and it was shown in the Fig. 13. By analyzing the average weight of the struvite crystals, it falls gradually from 2.40 g to 0.29 g. The maximum inhibition efficiency was found to be 87.9 %.
 |
Figure 12: The harvested crystals of struvite obtained from bark of T. Chebula in the gel method.(a to h) Click here to View figure |
The harvested crystals of struvite obtained from bark of T. Chebula in the gel method (a) without any additive (b) with the distilled water (c) with the methanol (d) with the 1% synthesized Ag nanoparticles (e) with the 2% synthesized Ag nanoparticles (f) with the 3% synthesized Ag nanoparticles (g) with the 4% synthesized Ag nanoparticles (h) with the 5% synthesized Ag nanoparticles after 7 days.
 |
Figure 13: The measurement of struvite crystals obtained from bark of T. Chebulain the gel method(a to h). Click here to View figure |
The measurement of struvite crystals obtained from bark of T. Chebulain the gel method (a) without any additive (b) with the distilled water (c) with the methanol (d) with the 1% synthesized Ag nanoparticles (e) with the 2% synthesized Ag nanoparticles (f) with the 3% synthesized Ag nanoparticles (g) with the 4% synthesized Ag nanoparticles (h) with the 5% synthesized Ag nanoparticles after 7 days
FT-IR study of harvested crystals
The FTIR spectra of harvested crystal with varying percentage of T. chebula mediated silver nanoparticles were shown in the Fig. 14. The band values correspond to different phyto constituents were tabulated in table 5. From the data it was clear that on the addition of distilled water in the control, there is no shift in the bands of FTIR spectrum of sample b. The shift in the bands (sample c to h) indicates the presence of active functional groups and the rate of formation of struvite crystals decreases due to the inhibitory action of T.chebula mediated silver nanoparticles.
 |
Figure 14: The FT-IR spectra of struvite crystals obtained using silver nanoparticles obtained from methanol extract of Terminalia chebula bark by gel method. (a to h). Click here to View figure |
The FT-IR spectra of struvite crystals obtained using silver nanoparticles obtained from methanol extract of Terminalia chebula bark by gel method. (a) Without any additive (b) with the distilled water (c) with the methanol (d) with the 1% synthesized Ag nanoparticles (e) with the 2% synthesized Ag nanoparticles (f) with the 3% synthesized Ag nanoparticles (g) with the 4% synthesized Ag nanoparticles (h) with the 5% synthesized Ag nanoparticles.
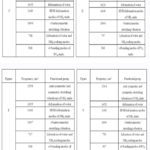 |
Table 5: (a). Ft-IR Spectral band values for figure A and B. (b) Ft-IR Spectral band values for figure C and D. (c) Ft-IR Spectral band values for figure E and F. (d) Ft-IR Spectral band values for figure G and H. |
While Phyllanthus emblica extract on struvite crystals formation was found to have 60% inhibiting effect on struvite crystals growth12. Thus T. chebula bark mediated silver nanoparticleshas found to be more efficient in controlling the struvite stone than Phyllanthus emblica.
Conclusion
The main aim of Green synthesis of silver nanoparticles provides an alternative pathway for minimizing the harmful effects caused by physical and chemical method. The silver nanoparticles synthesized were characterized using UV-Visible spectroscopy and the corresponding peak intensity obtained at 437nm.The FTIR analysis revealed that the functional groups present in T. chebula bark extract was responsible for the reducing property. The TEM and XRD analysis shows that synthesized silver nanoparticles are spherical in nature and Face centered cubic. The in vitro crystallization of struvite crystals were performed using the single gel diffusion technique. The average weight and the apparent length were measured. By increasing the percentage of T. chebula bark mediated silver nanoparticles, the size and average weight of the grown struvite crystals were decreased gradually. The maximum inhibition was found to be 87.9 %. The shift in the bands of FTIR spectra revealed that the rate of formation of struvite crystals declined on the addition of the inhibitor. Thus T. chebula bark mediated silver nanoparticles has found to be more efficient in controlling the struvite stone.
Acknowledgements
None.
Conflict of interest
None.
References
- Kumar, V.; Yadav, S. K. J. Chem. Technol. 2009, 84
CrossRef - Suguna, K.; Thenmozi, M.; Sekar, C. Bull. Mater. Sci. 2012, 35(4), 701–706
CrossRef - Butterweck, V.; Khan, S. R. Planta Med. 2009, 75, 1095–1103
CrossRef - Velu, V.; Das, M.; Raj, N. A. N.; Dua, K.; Malipeddi, H. Drug Deliv. Transl. Res. 2017, 7(3), 439–449
CrossRef - Kokate, C. K. Practical pharmacognosy. Vallabh Prakashan, Delhi, 2005, 107–111
- Khandelwal, K. R. Practical pharmacognosy techniques and experiments, 9th edn. Nirali Prakashan, Pune 2003
- Priya, L.; Beatrilevaldaris, M.; Manjula, K. Int. J. Recent Sci. Res. 2018, 9(2), 24312–24316
- Luziatelli, G.; Sorensen, M.; Theilade, K.; Molgaard, P. Peru J. Ethanobiol. Ethanomed. 2010, 6, 21–27
CrossRef - Shah, B. N.; Nayak, B. S.; Seth, A. K.; Jalalpure, S. S.; Patel, M. A.; Mishra, A. D. Pharmacognol. Mag. 2006, 2(6), 77–86
- Prashith, K. T. R.; Vinayaka, K. S.; Soumya, K. V.; Ashwini, S. K.; Kiran, R. Int. J. Toxicol. Pharmacol. Res. 2010, 2(1), 26–29
- Chauhan, C. K.; Joshi, M. J.; Vaidya, A. D. B. Am. J. Infect. Dis. 2009, 5, 177–186
CrossRef - Bimdu, B.; Swetha, A. S.; Veluraja, K. Clin. Phytosci. 2015, 1, 3

This work is licensed under a Creative Commons Attribution 4.0 International License.
About The Author
![]()
A New Edition of Web of Science
Journal Impact Factor
2022: 0.5
Five Year: 0.8
Journal is Indexed in

Cabells Whitelist
![]()


