Spectrophotometric Determination of Low Levels of the Orthophosphate Anion as Molybdenum Blue Using Sodium Thiosulphate Reducing Agent
Irene Nalumansi1* , Grace Birungi1, Brenda Moodley2 and Emmanuel Tebandeke3
1Department of Chemistry, Mbarara University of Science and Technology, Uganda.
2Department of Chemistry and Physics, University of Kwa Zulu-Natal, West ville Campus, South Africa.
3Department of Chemistry, Makerere University, Uganda.
Corresponding Author E-mail: inalumansi@must.ac.ug
DOI : http://dx.doi.org/10.13005/ojc/360608
Download this article as:
![]()
A simple spectrophotometric method for the determination of low levels of theorthophosphate (PO43-) in environmental water systems is reported. The method is based on theformation of the phosphomolybdatefrom the condensation of molybdate and orthophosphate in aqueous acid medium followed by reduction with sodium thiosulphateto form phosphomolybdenum blue. The system obeys Beer’s law at 880 nm (λmax) in the 0.005 – 0.06 mg P mL-1 phosphate concentration range. Molar absorptivity, Sandell’s sensitivity and correlation coefficient values for the determination were 57526 L mol-1 cm-1, 0.2835 µg cm-2 and 0.9948 respectively. The limit of detection was 2.213 x 10⁻³ mg P mL-1. The results of PO43- determination in water samples obtained using the spectrophotometric method developed in this study, compare favourably with those generated using the Murphy and Riley method which is commonly used for this analysis.Therefore, the study ably demonstrates the suitability of the present spectrophotometric method for analysis of the orthophosphate in environmental water samples.
KEYWORDS:Molybdenum Blue; Orthophosphateanion; Phosphomolybdate; Sodium Thiosulphate; Spectrophotometric
Introduction
Phosphorus (P) a vital nutrient to human, animal and plant growth occurs naturally in rocks and soils as phosphorite or hydroxyapatite, Ca3(PO4)2.Ca(OH)2, apatite, Ca3(PO4)2.CaF2, vivianite, Fe3(PO4)2.8H2O and aluminium phosphate1. Since P serves as a nutrient in the food chain, supplementing the native P in the soil and animals’ diet where it is lacking may be a necessity. This can result in excess P moving from agricultural areas especially where animal wastes are being used as fertilisers to other environmental systems2. These phosphates stimulate the growth of phytoplankton and aquatic plants which provide food for many organisms including zooplanktons, fish, humans and other mammals. This may result in eutrophication of waters and its related effects of anoxic conditions3,4,5; which leads to deterioration in water quality and depletion of aquatic species. Phosphorus in freshwaters ranges from 0.005 to 0.02 mg L-1PO4-P in most natural surface waters, 0.001 mg L-1 PO4-P in some pristine waters and as high as 200 mg L-1PO4-P in some enclosed saline waters. Average groundwater levels are about 0.02 mg L-1PO4-P6,7. Due to a few absorbing surfaces and constant mixing in water bodies, low P levels are responsible for increasing biological productivity making the aquatic system highly sensitive to P contamination. Some of the common sources of P into the environment include phosphate-containing geologic formations, agricultural fertilizer application, detergent usage and industrial wastes8,9,10. This calls for constant monitoring of P in water systems and other vulnerable environmental systems.
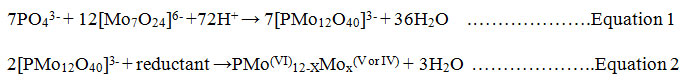
Several forms of P including orthophosphate (reactive phosphate), condensed phosphate (pyro-, meta- and polyphosphate) and organic phosphate may exist in natural waters11. These P forms can be determined either partially or fully as the orthophosphate which is the most thermodynamically stable phosphate form12. Various analytical techniques have been reported for the determination of phosphate concentrations in water systems including titrimetric, complexogravimetric, atomic absorption spectrophotometry13, high performance liquid chromatography14, colorimetry15,16, and UV-Vis spectrophotometric methods17,18.Among the popular spectrophotometric methods of orthophosphate determination is the molybdenum blue19, and the yellow vanadomolybdate complex methods; of which the most commonly used is the molybdenum blue method due to its high sensitivity20.This method involves condensation of molybdate with orthophosphate in aqueous acidic medium forming 12-molybdophosphoric acid which is selectively reduced to the phosphomolybdate anion (molybdenum blue) as shown in equations 1 and 2. The intensity of the blue colouredheteropoly compound is proportional to the amount of P present in the sample.
The molybdenum blue method since its introduction by Dickman and Bray, 194021 has undergone several modifications to improve sensitivity, precision and selectivity for orthophosphate determination. Notably, improvements have been attempted through the use of various reductants such astin(II) chloride22, ascorbic acid23, hydrazine sulphate, sodium sulphide18 and hydroquinone24. However, most of the modified methods have disadvantages such as instability of the heteropoly blue colour, interference from arsenic and copper, the lengthy time required for full colour development, low sensitivity coupled with high absorption by the blank25. The rate of colour development is specifically slow with ascorbic acid, the most commonly used reductant employed in the Murphy and Riley, 1962 method12, whereas hydrazine sulphate another preferred reductant is toxic and corrosive26. Besides, some of the modified methods are cumbersome and involve lengthy extraction procedures which require additional analyst skills18,27. Therefore, the use of sodium thiosulphate was explored as a reductant.
In this study, we demonstrate the determination of low levels of the orthophosphate anion as molybdenum blue using sodium thiosulphatethe reducing agent. The sodium thiosulphate used to reduce molybdophosphoric acid to molybdenum blueis commercially available, cheap and a common laboratory reagentused in several redox reactions. It has been used in molybdenum blue reactions to counter arsenate interference by reducing As(V) to As(III)28but it has not beenoptimized and reported for the orthophosphate determination. Moreover, the sodium thiosulphate solution is stable for several days as opposed to ascorbic acid the most commonly used reductant.
Materials and Methods
Materials
All chemicals were of analytical grade and used without further purification. They included; sodium thiosulphatepentahydrate (Merck, RSA, 99.0 – 101.0%), potassium dihydrogen phosphate (Merck, RSA 99.5%), hydrochloric acid (Merck, RSA, 32%), ammonium molybdatetetrahydrate (Sigma-Aldrich, RSA, ≥ 99%), antimony potassium tartrate (Hopkin and Williams, England), L-ascorbic acid (BDH, England 99.0 – 100.5 %), glacial acetic acid (Merck, RSA, 98 %), sulphuric acid, sodium carbonate anhydrous, starch soluble (BDH, England), potassium iodate (Merck, RSA, 99.0 – 101.0%), oxalic acid, potassium chloride, sodium sulphate (May and Baker Ltd, England), copper metal (Trust chemical laboratories, 99.5%), sodium arsenate, lead(II) nitrate and sodium nitrite.
Instrumental Analysis
The weighing was carried out using RADWAG WagiElektroniczne analytical balance (Model AS220.R2). The UV/Vis spectra were scanned using UV-VIS-NIR spectrophotometer (Shimadzu UV-3600) with 1 cm quartz cuvettes. The scanning wavelength was in the range of 500 – 1100 nm.
Preparation of Solutions
Deionized water was used to prepare all solutions.
Stock and working standard orthophosphate solutions
Stock orthophosphate solution was prepared by dissolving KH2PO4 (0.4393 g) in deionized water to make a solution of 0.1 mg P mL-1. The working orthophosphate standard solution (0.01 mg P mL-1) was prepared by appropriately diluting the stock phosphate solution.
Sulphuric acid solution
Sulphuric acid solution (0.5 M, 2.5 M and 5.5 M) was prepared by appropriately diluting concentrated H2SO4 (18.38 M).
Ethanoic Acid Solution
Ethanoic acid (0.5 M) was prepared by appropriately diluting glacial acetic acid (17.398 M).
Sodium Thiosulphate Solution
Sodium thiosulphate (Na2S2O3.5H2O, 7.50 g) and Na2CO3 (0.0301 g) were dissolved in 250 mL of recently boiled and cooled deionized water. The solution was standardized with KIO3 as follows: KI (2.00 g) was dissolved in deionized water (25 mL) and HCl (6 M, 2 mL) added followed by KIO3 (0.120 g). The liberated iodine solution was then titrated with Na2S2O3 solution until the triiodide complex was less intense. Starch indicator (5 mL) was added and the titration continued until a dark blue colour of the starch-triiodide complex turned colourless. The titration was repeated three times.
Ascorbic Acid Solution
Ascorbic acid (C6H8O6, 1.760 g) was dissolved in deionized water (100 mL) to give a concentration of 0.1 M.
Ammonium molybdate solution
Ammonium molybdate,(NH4)6Mo7O24 .4H2O (4.00 g) was dissolved in deionized water (100 mL) to make a 0.0324 M solution.
Antimony potassium tartrate solution
Antimony potassium tartrate(KSbO.C4H4O6, 0.2740 g) was dissolved in deionized water (100 mL) to make an 8.4326 x 10⁻³ M solution.
Ammonium molybdate- antimonyl tartrate (AM-PAT)solution
The ammonium molybdate-antimonylpotassium tartrate (AM-PAT) solution was prepared by dissolving (NH4)6Mo7O24 .4H2O (2.00 g) and KSbO.C4H4O6 (0.050 g) in deionized water (250 mL). The AM-PAT solution was 6.473 x 10⁻³ M in ammonium molybdate and 6.1552 x 10⁻⁴ M in antimonyl potassium tartrate.
Combined reagent
Antimonyl potassium tartrate solution (8.4326 x 10⁻³ M, 5 mL) was added to dilute H2SO4 (2.5 M, 50 mL) in a beaker followed by ammonium molybdate solution (0.0324 M, 15 mL) and ascorbic acid solution (0.1 M, 30 mL).
Orthophosphate anion analytical method development
To 50 mL volumetric flask was added the working orthophosphate solution, KH2PO4 (0.05 mg P mL-1, 1mL), AM-PAT solution (4 mL), sulphuric acid (5.5 M, 1 mL) and Na2S2O3 solution (0.1192 M, 1 mL). The solutions were made to the mark with deionized water. The solution was allowed to stand for 10 minutes and then the spectrum scanned against deionized water as a blank in the range 500 – 1100 nm. Based on the spectrum, a maximum absorption (λmax) of the reduced phosphopolyoxomolybdate complex was utilized in the subsequent analysis.
Optimisation of the sodium thiosulphate molybdenum blue method
Experimental parameters such as the concentration of various reagents and their orderof addition were studied separately and the absorbance of the coloured product observed at 880 nm. The optimization of the different parameters is presented in the proceeding sections.
Determination of concentration of ammonium molybdate – potassium antimony tartrate for use
In this setup, a varying amount of the AM-PAT solution was utilized to study the effect of concentration of ammonium molybdate on theformation of phosphomolybdenum blue (PMB) complex in the presence of potassium antimony tartrateas a catalyst.To three separate 50 mL volumetric flasks was added KH2PO4 solution (0.05 mg P mL-1,1 mL), AM-PAT solution (2 – 10 mL), followed by H2SO4 (5.5 M, 1 mL) and Na2S2O3 solution (0.1192 M, 1 mL). The solutions were made to the mark with deionized water, allowed to stand for10 minutes and the absorbance of the resultant molybdenum blue complex measured at 880 nm against a reagent blank.
Determination of concentration of the acid for use
To each of three separate 50 mL volumetric flasks was added KH2PO4 solution (0.05 mg P mL-1,1 mL), an optimized volume of AM-PAT solution, sulphuric acid (5.5M, 0.25 – 2 mL) and Na2S2O3 solution (0.1192 M, 1 mL). The solutions were diluted to the mark with deionized water, allowed to stand for 10 minutes and the absorbance of the molybdenum blue complex measured at 880 nm against a reagent blank.
Following the same procedure used for H2SO4, HCl and CH3COOH were also used to determine the acid to be used.The different solutions were allowed to stand for 10 minutes and the absorbance of the resultant molybdenum blue complexes measured at 880 nm.
Influence of concentration of sodium thiosulphatereducing agent on molybdenum blue formation
The influence of the concentration of Na2S2O3 reducing agent on the absorbance of the molybdenum blue complex was studied byutilizing varying volumes of the reductant. To three separate volumetric flasks was added KH2PO4 solution (0.05 mg P mL-1,1 mL) followed by the optimized volumes of AM-PAT and H2SO4 and the reducing agent Na2S2O3 (0.1192 M, 0.25 – 2 mL). The solutions were made to the mark with deionized water, allowed to stand for 10 minutes and the absorbance measured at 880 nm against a reagent blank.
Order of Reagent Addition
The effect of the order of addition of the reagents on the absorbance of the molybdenum blue complex was studied using optimized volumes of different reagents. The addition order of different solutions including KH2PO4, AM-PAT, H2SO4 and Na2S2O3 was varied and the absorbance of the resultant molybdenum blue complex measured at 880 nm.
Colour stability of reduced phosphopolyoxomolybdate complexes
The colour stability of the reduced phosphomolybdate complex was studied using optimized volumes and addition order of the reagents. To three different 50 mL volumetric flasks was added KH2PO4 solution (0.05 mg P mL-1,1 mL) followed by addition of the colour developing agent comprised of AM-PAT, H2SO4 and Na2S2O3. The absorbance of the resultant molybdenum blue complex was measured at 880 nm against a reagent blank immediately after mixing the solutions, and at regular intervals for 3600 seconds.
Proposed procedure of orthophosphate anion determination
The AM-PAT solution (6 mL), H2SO4 (5.5 M, 1 mL) and Na2S2O3 solution (0.1192 M, 1.5 mL) were added to standard phosphate solutions (0.05 mg P mL-1). The solution was made up to the mark with deionized water and allowed to stand for 20 minutes for maximum colour development. The absorbance was measured at 880 nm against deionized water as the reagent blank. The amount of orthophosphate (PO43-) in mg P mL-1 was determined from the absorbances of the solutions.
Method Validation
The developed sodium thiosulphate molybdenum blue method for PO43- anion determination was validated according to the International Conference for Harmonisation (ICH) guidelines29 under the optimized experimental conditions to determine detection limits, linearity, accuracy, precision, and recovery.
Determining detection and quantification limits
The LoD and LoQof this method were determined from standard deviation (SD) of intercepts of calibration curves obtained from replicate measurements of six blanks containing only the colourdeveloping reagents without phosphorus. Then LoD and LoQ were calculated using the equations below29.

Determination of linearity of the method
The linearity of the proposed method was verified by studying absorbances of six concentrations of standard KH2PO4 solutions covering the range (0.01, 0.02, 0.03, 0.04, 0.05 and 0.06 mg P mL-1). The absorption of each concentration was measured three times. The curve of absorbance against concentration was obtained by plotting and statistically by calculating the correlation coefficient of different concentrations and the blank in triplicate. The regression equation and correlation coefficient were determined.
Determination of accuracy and precision of the method
In this study, the absorption of three concentration levels (0.008, 0.02 and 0.06 mg P mL-1) of standard KH2PO4 solutions within the concentration range were measured and each of them was replicated six times to evaluate accuracy and precision of the proposed methods. Precision was determined as RSD and accuracy as mean relative error (%MRE).
Determination of recovery
The accuracy of the developed method was further ascertained by carrying out recovery experiments. Deionized water was spiked with standard KH2PO4 solutions at two different levels that is 0.01and 0.05 mg P mL-1 in a 50 mL volumetric flask.AM-PAT solution (6 mL), H2SO4 (5.5 M, 1 mL) and Na2S2O3 solution (0.1192 M, 1.5 mL) were added and made up to the mark with deionized water. The absorbance of each solution and the blank was measured six times at 880 nm. The amount of phosphorus recovered was determined from calibration equations and recovery reported as RSD.
Determination of Sandell’s sensitivity
Serial dilutions of concentration range (0.01 –0.06 mg P mL-1) were prepared from the working KH2PO4 standard solution and treated with AM-PAT solution (6 mL), H2SO4 (5.5 M, 1 mL) and Na2S2O3 solution (0.1192 M, 1.5 mL). Each dilution was scanned six times at 880 nm and the absorbance was recorded. The mean absorbance at each concentration level was determined and Sandell’s sensitivity calculated using Equation 5as described by Rajendraprasad, Basavaiah, and Vinay, (2010)30.

Determination of molar absorptivity
A series of phosphate concentrations in the range (0.01- 0.06 mg P mL-1) were prepared from the working KH2PO4 standard solution and treated with AM-PAT solution (6 mL), H2SO4 (5.5 M, 1 mL) and Na2S2O3 solution (0.1192 M, 1.5 mL). The absorbance of each solution was measured six times at 880 nm. Molar absorptivity was determined using Equation 6.

(where A = absorbance, Ꜫ = molar absorptivity, c = concentration of absorbing species per unit volume (mol L-1), d = path length (cm)).
Evaluation of selectivity
Some ions and organic acids exist in water together with the orthophosphate affecting its determination. The interference due to the presence of arsenate, chloride, oxalic acid, nitrite, sulphate and copper(II) ions was also studied. In the study, salts containing interfering ionic species were dissolved in deionized water to make a 100 mg L-1interferent solution. The solutions of interfering species (1 mL and 5 mL) were transferred to 50 mL volumetric flasks containing 1 mL of standard KH2PO4 solutions (0.04 and 0.1 mg P mL-1). To the mixtures was added AM-PAT solution (6 mL), H2SO4 (5.5 M, 1 mL) and Na2S2O3 solution (0.1192 M, 1.5 mL) and the solutions were then made up to the mark with deionized water. The absorbances of the resulting solutions were determined in triplicate in the presence and absence of an interferent at 880 nm against deionized water.
Application of the developed sodium thiosulphate molybdenum blue method in the determination of the orthophosphate in selected water systems
The optimized molybdenum blue method based on sodium thiosulphate as the reductant was applied in the determination of PO43- in selected water systems and compared with the Murphy and Rileymethod. Water samples including distilled water and tap water collected from the laboratory together with environmental water samples collected from MakerereKikoni channel (0o20’07.3″N32o33’38.0″E), Kiwunya channel (0o19’42.4″N32o33’44.9″E) and Nanfumbambiwell (0o19’54.8″N32o33’46.2″E) in Kampala City – Uganda. The environmental sampling sites are located within a busy Kampala suburb where both residential and business human activities are carried out. The water samples were filtered through Whatman membrane filters (0.45 µm pore size). The first 10 mL of the filtrate of each sample was rejected and the remainder collected in labelled sample bottles for determination of PO43-using the optimized method as previously described. The samples were appropriately diluted before analysis except for the distilled water and tap water samples.
Results and Discussion
Determination of absorption maxima for the phosphomolybdenum blue
The spectrophotometric method described herein involves the formation of 12-molybdophosphoric acid on condensation of the molybdate and phosphate in aqueous sulphuric acid medium followed by its reduction with sodium thiosulphate to form a phosphomolybdenum blue complex (PMB).
When the absorbance of the resultant phosphomolydenum blue (PMB) complex was scanned from 500 nm to 1100 nm, significant absorption was observed at 880 nm and 721 nm as shown in Figure 1. Therefore, the wavelength of 880 nm at which the PMB complex exhibited the highest absorbance was selected as the λmax for the determination and was utilized in all subsequent measurements.
 |
Figure 1: Absorption spectrum of the sodium thiosulphate reduced phosphomolybdenum blue complex formed from the solution containing 1 mL of 0.05 mg P mL-1 phosphate + AM-PAT solution (6 mL) + H2SO4 (5.5 M, 1 mL) + Na2S2O3 solution (0.119 M, 1.5 mL) diluted to 50 mL with deionized water. |
Optimisation of the formation and stability of the phosphomolybdenum blue complex
The experimental conditions for theformation of PMB were optimized, by studying their effect on the intensity andstability of the final molybdenum blue colour, for the effective determination of the PO43- anion in waters.
Effect of concentration of ammonium molybdate-potassium antimonyl tartrate on phosphomolybdenum blue formation
The effect of concentration of ammonium molybdate and antimonyl potassium tartrate catalyst on PMB formation was investigated with varying volumes of AM-PAT solution. A plot of absorbance of solutions treated with varying volumes of AM-PAT solution shown in Figure 2shows that the absorbance values increased with the increasing volume of AM-PAT, with maximum absorbance being achieved after addition of 6 mL of AM-PAT solution.The solution was 6.473 x 10⁻³ M in ammonium molybdate and 6.1552 x 10⁻⁴ M in antimonyl potassium tartrate. When the volume of AM-PAT was higher than 6 mL, the absorbance was found to decrease. Therefore, 6 mL of AM-PAT was used in subsequent procedures for phosphate determination.
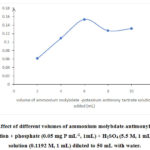 |
Figure 2: Effect of different volumes of ammonium molybdate-antimonyl potassium tartrate solution + phosphate (0.05 mg P mL-1, 1mL) + H2SO4 (5.5 M, 1 mL) + Na2S2O3 solution (0.1192 M, 1 mL) diluted to 50 mL with water. |
Effect of acid concentrationon phosphomolybdenum blue formation
The effect of the concentration of H2SO4 on the absorbance of the resultant phosphomolybdenum blue was studied by using various volumes of 5.5 M H2SO4 in combination with the optimised volume of AM-PAT. The results of this study presented in Figure 3, show that the solution containing 1 mL of 5.5 M H2SO4 produced phosphomolydenum blue with the highest absorbance at 880 nm. From the graph, it can be observed that as acidity increased beyond the optimal value, the absorbance reduced. A similar observation was made by Pradhan and Pokhrel, (2013)29. Therefore, a volume of 1 mL of 5.5 M H2SO4was used throughout the experiments for PO43- determination.
 |
Figure 3: Effect of different volumes of sulphuric acid (5.5 M, 0.25 – 2mL) + phosphate (0.05 mg P mL-1,1mL) + AM-PAT solution (6 mL) + Na2S2O3 solution (0.1192 M, 1 mL) diluted to 50 mL with water. |
Effect of type of acid on the absorbance of the phosphomolybdenum blue
The formation of the PMB takes place in acidic medium and it was relevant to determine the most suitable acid for the orthophosphate determination. Under this study, different acids including H2SO4, HCl and CH3COOH were tested using equimolar and similar volumes of the respective acids. The results presented in Table 1 show that the highest absorbance was attained for solutions acidified with HCl followed by H2SO4whereas CH3COOH exhibited the lowest absorbance. Thus, acidification of solutions for phosphate determination by the molybdenum blue method could be carried out with HCl or H2SO4but the former was rejected over the salt error caused by chloride interference, which results into a high standard deviation in the observed readingsas reported by Nagul et al., (2015)28.
Table 1: Effect of the type of acidon the determination of the orthophosphate ion.
|
Entry |
Type of acid |
Absorbance |
|
1 |
Sulphuric acid |
0.195 ± 6.70% |
|
2 |
Hydrochloric acid |
0.206 ±17.78% |
|
3 |
Acetic acid |
0.011±45.05% |
The value is an average of 6 replicates
Effect of concentration of reducing agenton phosphomolybdenum blue formation
The effect of Na2S2O3 concentration on the formation of PMB was investigated by observing the absorbance of the PMB with varying amounts of the reductant. The absorbance of PMB increased with increasing volumes of 0.1192 M Na2S2O3 with maximum absorbance obtained on adding 1.5 mL of Na2S2O3 as shown in Figure 4. An increase in the amount of Na2S2O3beyond the optimal volume resulted in a reduction in the absorbance of PMB. Therefore, a volume of 1.5 mL Na2S2O3 was used in the subsequent experiments.
|
|
Figure 4: Effect of different volumes of Na2S2O3 solution (0.1192 M, 0.5 – 2 mL) + phosphate (0.05 mg P mL-1,1 mL) + AM-PAT solution (6 mL) + sulphuric acid (5.5 M, 1 mL) diluted to 50 mL with water. |

Effect of order of addition of reagents on phosphomolybdenum blue formation
In this study, the optimized volumes of the various reagents were added in different orders and taken through the proposed method. The results obtained as presented in Table 2 indicate that the change in the order of reagent addition affects absorbance values of the solutions. It was observed that the order AM-PAT + H2SO4 + Na2S2O3 + PO43- registered the highest absorbance. However, the order was not adopted because it compromised the stability of the formed PMB. Moreover, the acid can decompose the Na2S2O3 as shown in Equation 7. Also, the order H2SO4+ Na2S2O3 + PO43-+ AM-PAT, exhibited a higher standard deviation in the absorbance readings. Therefore, the order PO43-+ AM-PAT +H2SO4 + Na2S2O3where the reductant is added last was followed.
S2O32- + 2H+ → SO2 + S + H2O ………………… Equation 7
Table 2: Effect of order of reagents addition in the Na2S2O3 molybdenum blue method
|
Order of addition |
Absorbance±RSD% |
|
PO43-+ AM-PAT + H2SO4+ Na2S2O3 |
0.148±7.97% |
|
AM-PAT + H2SO4+ Na2S2O3+ PO43- |
0.268±11.14% |
|
H2SO4+ Na2S2O3+ PO43-+ AM-PAT |
0.217±26.33% |
|
Na2S2O3+ PO43-+ AM-PAT + H2SO4 |
0.113±17.74% |
Value is the average of three determinations for each order
Effect of time on the formation of phosphomolybdenum blue
The rate of formation of phosphomolybdate is time dependent (Huang and Zhang, 2008) but is also affected by a catalyst. Murphy and Riley, (1962) used potassium antimonyl tartrate as a catalyst in the single solution method of phosphate determination in sea waters. The same method was adopted with modifications to develop the Na2S2O3 molybdenum blue method of orthophosphate anion determination. As seen from the graphs in Figure 5 the rate of colour development was faster in the catalyzed reaction, unlike the uncatalyzed one.The absorbance of the PMB increased steadily up to 20 min after which it increased slightly with time for 60 min studied.Thus, the optimal time lag after theaddition of the reductant to thereading of the absorbance of the formed molybdenum blue complex was 20 minutes. This implies that the rate of molybdenum blue colour formation is slightly higher with ascorbic acid reductant compared to sodium thiosulphate, since the former requires 10 minutes to attain optimal colour development.
 |
Figure 5: Effect of time on the colour stability of Na2S2O3 reduced phosphomolybdate solution |
Validation of the sodium thiosulphate molybdenum blue method for orthophosphate determination
Calibration curve and sensitivity
The calibration curve for orthophosphate analysis obtained by plotting absorbance as a function of the concentration of orthophosphate (in mg P mL-1) at 880 nm is shown in Figure 6. The plot is linear in the range of 0.005 – 0.06 mg P mL-1. The amount of orthophosphate within this range can be determined directly and for those above this range, the sample should be diluted. The molar absorptivity and Sandell’s sensitivity determined from the calibration curve at 880 nm were 57526 L mol-1 cm-1 and 0.2835 µg cm-2 respectively. The values were found to be within acceptable limits. The LoD and LoQ obtained using the proposed method in comparison to those achieved with the Murphy and Riley methods are presented in Table 3. The results show that the present method based on the sodium thiosulphatereductant offers a lower detection (LoD) and quantification (LoQ) limits compared to the commonly used Murphy and Riley method. This suggests that the sodium thiosulphate method can be used to determine low levels of P in water systems.
 |
Figure 6: Calibration curve for the determination of orthophosphate |
Table 3: Comparison of detection limits obtained with the proposed method and the Murphy and Riley methods of orthophosphate determination
|
Method |
LoD (mg P mL-1) |
LoQ (mg P mL-1) |
|
Murphy and Riley |
8.31×10⁻³ |
0.0252 |
|
Present |
2.213×10⁻³ |
5.538×10-³ |
n=6 (average of six readings); LoD and LoQ values of the Murphy and Riley method were calculated from experimentally determined values.
Accuracy and Precision
The precision of the method was determined by repeat analysis of samples at different concentrations and results were expressed as standard deviation (SD) and relative standard deviation (%RSD). Results of the precision studies for 6 replicate determinations of different orthophosphate levels exhibited %RSD values in the range 1.72 to 7.01 % (Table 4). The RSD values of less than 20% are regarded as good indicating the method’s repeatability when used for analysing orthophosphate levels in waters. The results obtained for replicate determinations of 0.008, 0.02 and 0.06 mg P mL-1 phosphate were analysed by ANOVA. The F-critical 4.414 was less than the F-calculated 32.91, 32.77 and 32.29 for the respective concentrations. An indication that the results of the orthophosphate determination obtained using the present sodium thiosulphate molybdenum blue method are precise.
Table 4: Evaluation of precision of the Na2S2O3 molybdenum blue method.
|
Added concentration (mg P mL-1) |
Detected concentration (mg P mL-1) |
MRE (%) |
SD |
RSD (%) |
|
0.008 |
0.0079 |
1.53 |
1.44 x 10⁻⁴ |
1.84 |
|
0.02 |
0.0187 |
6.75 |
1.31 x 10⁻³ |
7.01 |
|
0.06 |
0.0584 |
2.64 |
1.00 x 10⁻³ |
1.72 |
n=6 (average of ten readings), MRE is mean relative error
In this study, the accuracy of the developed method was validated by calculating the mean percent recovery of spiked samples for six replicates at different concentration levels prepared from independent stock solutions. Recoveries above 90% were registered for the different concentration levels. The RSD values were within the acceptable range of less than 20% (Table 5). Therefore, this ably demonstrates that the present sodium thiosulphate molybdenum blue method is suitable for the determination of low levels of the orthophosphate and the results generated are accurate.
Table 5: Evaluation of accuracy of the Na2S2O3 molybdenum blue method.
|
Added concentration (mg P mL-1) |
Recovery ±RSD% |
|
0.008 |
97.68±2.88 |
|
0.02 |
97.5±10.12 |
|
0.06 |
98.67±2.56 |
n = 6 (average of six readings)
Effect of interfering substances
The effect of interfering cations, anions and organic acids on phosphate determination using the developed sodium thiosulphate molybdenum blue method was also examined. In this study, ions that are known to affect the determination PO43- in water samples using the molybdenum blue methods were added to standardsolutions and analysed using the present method. The results show that interferents affected the analysis differently.
The interference caused by arsenate ion is shown in Figure 7. The absorbance of molybdenum blue solutions formed increased in presence of AsO43-(Figure 7b). The AsO43- ion has a tetrahedral geometry like the orthophosphate and can undergo a similar reaction with molybdate forming heteropolyacids. Upon reduction, they form arsenomolybdenum blue species with an absorption maximum close to that of the phosphomolybdenum blue. Indeed, a previous study utilized the molybdenum blue method to determine AsO43-in natural water samples at 865 nm as shown in Figure 7a32, which is likely to affect orthophosphate determination at 880 nm. When AsO43-ions were introduced into in the reaction mixture, they interfered with phosphorus analysis causing a shift in the λmax. Investigations carried out at two orthophosphate levels (0.04 and 0.1 mg P mL-1) show that absorbance increased with increase in AsO43-concentrations. Therefore, AsO43-has positive interference on PO43- determination. In this respect, in the analysis of water samples containing significant amounts of the arsenate using the present sodium thiosulphate molybdenum blue method, this interferent must be removed using standard procedures before determination of the orthophosphate.In contrast, Cl– ions exhibitednegative interference in the orthophosphate determination possibly by decreasing the analytical signal sinceCl– disrupts the formation of PMB28.
 |
Figure 7: Absorbance spectrum of arsenate ions (a), Effect of arsenate ions on molybdenum blue formation (b). |
Results of the investigation for the effect of oxalic acid on molybdenum blue formation are shown in Figure 8. The results show a reduction in absorbance of PMB complex with increase in the oxalic acid concentrations. Generally, organic acids interfere inphosphomolybdenum blue methods by sequestering Mo(VI) and destroying 12-molybdophosphoric acid. This is possible because organic acids like oxalic acid coordinate in a bidentate manner with Mo(VI) to form a stable six membered complex33. This results in a reduction in the absorbance of the PMB.
 |
Figure 8: Effect of oxalic acid on molybdenum blue formation |
The effect of the nitrite ion on the molybdenum blue formation is shown in Figure 9. Presence of the nitrite ion decreases the absorbance of the reduced phosphomolybdate complex. The nitrite ion is an oxidizing agent, thus, it oxidises molybdenum blue according to Equation 8 which is followed by a reduction in absorbance. Similar observations were made in the determination of nitrate and nitrite in water, meat products and vegetables using phosphomolybdenum blue method; a reduction in the intensity of the blue colour was proportional to nitrite content34.
[PMoV4MoVI8O40]7- + NO2– → [PMoVI12O40]3- + NO ………………….. Equation 8
 |
Figure 9: Effect of nitrite on molybdenum blue formation |
Results of the effect of copper(II) ions on molybdenum blue formation presented in Figure 10, show that the absorbance of the complex decreased with increasing concentrations of Cu2+ ions added to PO43- solutions. The reduced absorbance could be a result of inhibition of Mo(VI) reduction which is caused by Cu2+ ions35,36. Like Cu2+, Pb2+ ions also inhibit Mo(VI) reduction leading to reduced intensity of molybdenum blue formed34.
 |
Figure 10: Interference of Cu2+ ion on molybdenum blue formation |
Determination of levels of orthophosphate anion in selected water systems
The developed sodium thiosulphate molybdenum blue method was applied in the determination of the orthophosphate in selected natural waters and the results are presented in Table 6. The results show that the PO43- was present in the different water samples in varying concentrations.Samples from MakerereKikoni Channel and Kiwunya Channel exhibited higher levels of P of 0.03 ppm and 0.028 ppm respectively. The high PO43-concentration in water from these channels could be attributed to the various sources of phosphorus such as solid and liquid wastes generated from households, shops, restaurants and kiosks along the channel. Also, the animal excreta and pit latrines located in the vicinity discharge into the channel especially on rainy days. Moreover, there are several washing bays where youth use detergents some of which are P based, to wash motorcycles and bicycles. Further on, the elevated P levels could also be due to natural decomposition of rocks and minerals, weathering of soluble inorganic materials and leaching of biomass37. On the other hand, the amount of orthophosphate in the distilled water and tap water samples were below detection limits.
As shown in Table 6, the results obtained forPO43- determination in water samples using the present sodium thiosulphate method were compared to those obtained using the Murphy and Riley, 1962 method that employs ascorbic acid reducing agent. The results obtained for the different samples using the two methods are in agreement. The correlation of the two methods was found to be 0.996 for determination of PO43-in five water samples. This demonstrates the applicability of the developed method for the accurate determination of the orthophosphate in environmental water samples.
Table 6: Determination of phosphate in water samples.
|
Sample |
Phosphate concentration ± SD (mg P mL-1) |
|
|
Ascorbic acid method |
Na2S2O3 method |
|
|
Distilled water |
ND |
ND |
|
Tap water |
ND |
ND |
|
MakerereKikoni channel water |
0.0336 ±0.001 |
0.0300 ±0.05 |
|
Kiwunya channel water |
0.0316 ±0.0006 |
0.0278 ±0.005 |
|
Nanfumbambi well water |
0.016 ±0.001 |
0.0177 ±0.009 |
Results based on five measurements. ND = detected. SD = standard deviation
Conclusion
A simple and rapid spectrophotometric method for the determination of low levels of orthophosphate ions in water is reported. The method involves thereduction of phosphomolybdate complex formed by condensation of the molybdate and phosphate in anaqueous acid medium using Na2S2O3 solution. The result is theformation of molybdenum blue which exhibited a maximum absorption at 880 nm. The method is simple and cheap compared to other methods since it does not require sophisticated instruments or involve extraction of the analyte and the Na2S2O3 reducing agent employed to reduce phosphomolybdate is a readily available laboratory chemical. The optimized method was successful employed in the determination of PO43- in water samples and the results of the analysis compared favourably with the Murphy and Riley, 1962 ascorbic acid method. Also, the present sodium thiosulphate molybdenum blue method exhibited low LoD and LoQ in the determination of the orthophosphate compared to the ascorbic acid molybdenum blue which is the most commonly used method for this analysis.
Acknowledgement
The authors would like to acknowledge the Organisation for the Prohibition of Chemical Weapons (OPCW), the African-German Network of Excellence in Science (AGNES) and the German Academic Exchange Service (DAAD) for funding this study. The authors would also like to thank the International Science Programme (ISP), Uppsala University, Sweden, for funding some of the equipment used in the study. Support by the School of Chemistry and Physics, University of KwaZulu Natal – Westville, Departments of Chemistry, Mbarara University of Science and Technology and Department of Chemistry, Makerere University is also gratefully acknowledged.
Conflict of Interest
The authors declare that they have no conflict of interest.
References
- Greenwood, N.N.;Earnshaw, A.; Chemistry of the Elements (2nd ed.).;. Pergamon Press Ltd., 1997, 548.
- Sharpley, A.; Daniel, T. C.; Sims, J. T.; Pote, D. H.; Journal of Soil and Water Conservation., 1996, 51(2), 160 – 166.
- Carpenter, S. R.; Caraco, N. F.; Correll, D. L.; Howarth, R. W.; Sharpley, A. N.; Smith, V. H.; Ecological Applications., 1998, 8(3), 559–568.
CrossRef - Bennett, E. M.; Carpenter, S. R.;Caraco, N. F.; BioScience., 2001, 51(3), 227.
CrossRef - Carpenter, S. R.; Caraco, N. F.; Correll, D. L.; Howarth, R. W.; Sharpley, A. N.; Smith, V. H.; 2010, 8(January 1998), 559–568.
CrossRef - USEPA.; Quality Criteria for Water 1986. Office of Water Regulations and standards Washington, DC 20460., 1986, 235 – 243.
- Chapman, D.; Water Quality Assessments – A Guide to Use of Biota, Sediments and Water in Environmental Monitoring. 2nd ed.; Great Britain: E &FN Spon., 1996, 95 – 97.
- Gales, M. E.; Julian, E. C.;Kroner, R. C.; Journal – American Water Works Association., 1966, 58(10), 1363–1368.
CrossRef - McDowell, R. W.; Nash, D. M.;Robertson, F.; Journal of Environmental Quality., 2007, 36(5), 1281–1288.
CrossRef - Sharpley, A.; Wang, X.; Journal of Environmental Sciences (China)., 2014, 26(9), 1770–1782.
CrossRef - Mihajlović, R. P.; Kaljević, V. M.; Vukašinović, M. P.; Mihajlović, L. V.; Pantić, I. D.; Water SA., 2007, 33(4), 513–517.
CrossRef - Jarvie, H. P.; Withers, P. J. A.;Neal, C.; Hydrology and Earth System Sciences., 2002, 6(1), 113–132.
CrossRef - Christian G. D; Feldman J. F.; Analytica Chimica Acta., 1968,40,173–179.
CrossRef - Bøtker, H. E.; Kimose, H. H.; Helligsø, P.; Nielsen, T. T.; Journal of Molecular and Cellular Cardiology., 1994, 26(1), 41–48.
CrossRef - Fiske, C. H.; Subbarow, Y; Journal of Biological Chemistry., 1925, 66, 375–400.
- Williams, K. E.; Haswell, S. J.; Barclay, D. A.;Preston, G.; The Analyst., 1993, 118(3), 245–248.
CrossRef - Quinlan, Kenneth P; Desesa Michael, A.; Analytical Chemistry., 1951, 2, 1626–1629.
- Shyla, B.; Mahadevaiah; Nagendrappa, G.; Spectrochimica Acta Part A: Molecular and Biomolecular Spectroscopy., 2011, 78(1), 497–502.
CrossRef - Mahadevaiah, Kumar, M. S. Y.; Galil, M. S. A.; Suresha, M. S.; Sathish, M. A.; Nagendrappa, G.; E-Journal of Chemistry., 2007, 4(4), 467–473.
CrossRef - Crouch, S. R.; Malmstadt, H. V.; Analytical Chemistry., 1967, 39(10), 1084–1089.
CrossRef - Dickman, S. R.; Bray, R. H.; Industrial and Engineering Chemistry Analytical Edition., 1940, 12(11), 665–668.
CrossRef - Yatirajam, V.; Dhamija, S.; Talanta., 1977, 24(8), 497–501.
CrossRef - Towns, T. G.; Analytical Chemistry., 1986, 58(1), 223–229.
CrossRef - Woods, J. T.; Mellon, M. G.; Industrial and Engineering Chemistry – Analytical Edition., 1941, 13(11), 760–764.
CrossRef - Chaube, M. A.; Gupta, V. K.; Analyst., 1983, 108, 1141- 1144.
CrossRef - Müller, A.; Das, S. K.; Krickemeyer, E.; Kuhlmann, C.; Inorganic Syntheses., 2004, 34, 191–200.
- Ganesh, S.; Khan, F.; Ahmed, M. K.; Velavendan, P.; Pandey, N. K.; Kamachi Mudali, U.; Water Science and Technology., 2012, 66(12), 2653–2658.
CrossRef - Nagul, E. A.; McKelvie, I. D.; Worsfold, P.; Kolev, S. D.; Analytica Chimica Acta., 2015, 890, 60–82.
CrossRef - Patel, Munjal; Patel, A, Dhagash; Gajra, B.; Journal of Analytical & Bioanalytical Techniques., 2015, 1(2), 41–50.
- Rajendraprasad, N.; Basavaiah, K.; Vinay, K. B.; Ecletica Quimica., 2010, 35(1), 55–66.
CrossRef - Pradhan, S.; Pokhrel, M. R.; Scientific World., 2013, 11(11), 58–62.
CrossRef - Johnson, D. L.; Pilson, M. E. Q.; Analytica Chimica Acta., 1972, 58(2), 289–299.
CrossRef - Cavaleiro, A. M. V. S. V.; Gil, V. M. S.; Pedrosa de Jesus, J. D.; Gillard, R. D.; Williams, P. A.; Transition Metal Chemistry., 1984, 9(2), 62–67.
CrossRef - Zatar, N. A.; Abu-Eid, M. A.; Eid, A. F.; Talanta., 1999, 50(4), 819–826.
CrossRef - Halmi, M. I. E.; Zuhainis, S. W.; Yusof, M. T.; Shaharuddin, N. A.; Helmi, W.; Shukor, Y.; Ahmad, S. A.; BioMed Research International., 2013, 2013,1 – 8.
CrossRef - Othman, A. R.; Bakar, N. A.; Halmi, M. I. E.; Johari, W. L. W.; Ahmad, S. A.; Jirangon, H.; Shukor, M. Y.; BioMed Research International., 2013, 2013, 1 – 9.
CrossRef - Smil, V.; Annual Review of Energy and the Environment., 2000, 25(1), 53–88.
CrossRef
Accepted on: 11-12-2020


ISSN Online: 2231-5039

![]()


