Smart Starch-Gelatin Films Incorporated With Curcumin
Le Thi Bich Nguyet1 and Vinh Tien Nguyen2*
1Science Research and Technology Transfer Institute, Industrial Universityof Ho Chi Minh City, Vietnam..
2Chemical and Food Technology, Ho Chi Minh City University of Technology and Education, Vietnam..
Corresponding Author E-mail: tiennv@hcmute.edu.vn
DOI : http://dx.doi.org/10.13005/ojc/360610
Article Received on : 06-11-2020
Article Accepted on :
Article Published : 30 Dec 2020
In this study, we developed a starch-gelatin film incorporated with synthesized curcumin to be used as a pH-sensitive smartmaterial for food packaging.The film-forming mixture contained five components: starch, gelatin, glycerol, acetic acid and curcumin. The interactionsof the components and their effects on the film properties were investigated by using response surface methodology with central composite experimental design. The results showed impacts of the contents of these components contents as independent variables on tensile strength, elongation at break, Young’s modulus and solubility of the films. The contents of starch, gelatin and glycerol significantly affect these properties, while acetic acid and curcumin do not (p<0.05). Also, it was shown that the incorporation of curcumin provided the film with the capacity to sense pH changes from neutral to basic (yellow at pH ≤ 8 and orange-red at pH ≥ 9).
KEYWORDS:Curcumin; Mechanical Properties; Ph Indicator; Smart Packaging; Solubility
Download this article as:| Copy the following to cite this article: Nguyet L. T. B, Nguyen V. T. Smart Starch-Gelatin Films Incorporated With Curcumin. Orient J Chem 2020;36(6). |
| Copy the following to cite this URL: Nguyet L. T. B, Nguyen V. T. Smart Starch-Gelatin Films Incorporated With Curcumin. Orient J Chem 2020;36(6). Available from: https://bit.ly/3qFxvJF |
Introduction
In recent years, the development of the food industry has created the need to develop smart food packaging films that are capable of evaluating the quality and safety of food during packaging, storage, transportation and distribution1. The pH of packed food items is a factor that changes due to their microbial spoilage during long term storage2. Hence, smartpackaging films that can monitor the pH condition of micro-environment surrounding the packed food items have becomean active and promising research area.
The main requirements for smart food packaging films are safety and biodegradability. The films should be made from materials of natural origin whichdo no harm to human health and do not pollute the food. In this respect, gelatin is a well-known candidate material thank to its good film-forming capacity, low costs, good transparency and biodegradability. However, one of the main disadvantages of gelatin films is that they have poor mechanical properties, high hygroscopicity and high solubility, therefore easily dissolve in contact with high-humidity food surfaces3.
Blending gelatin with starch is a commonly-used method to improve the physical properties and stability of the films. Starch-gelatin based films offer advantages in terms of mechanical properties as well as oxygen and water vapor barrier4. Moreover, various types of colorimetric acid-base indicators were immobilized on biopolymeric matrices to enhance film properties. Musso et al. showed that gelatin-based films incorporated with synthetic or natural pH indicator such as bromocresol green,methyl orange, neutral red, curcumin and anthocyanins can change their color when contacting with liquids of variouspH.Besides, incorporatingcurcumin and starch into gelatin films enhances their mechanical, water vapor barrier and antioxidant properties5,6,7.
In this study, we produced edible and biodegradable composite films from starch, gelatin, glycerol, curcumin and acetic acid. Using the response surface methodology with central composite design, we studied the effects of these components on the mechanical and solubility of the films. We also evaluated the ability of the films containing curcumin to change their color with medium pH changes. The study would play a fundamental role forthe further development of a pH-sensitive smart packaging material.
Materials and Methods
Materials
Corn starch was purchased from Rapunzel LTD. (Austria), granular gelatin from Himedia (India), acetic acid (99.9%) and glycerol (99.9%) from Xilong Scientific (China). Pure curcumin was synthesized according to a patent8and purified by thrice recrystallization in 95% ethanol (Chemsol, Vietnam). Identity and purity of the synthesized curcumin were confirmed by NMR and MS techniques.
Experimental Design
The film-forming mixture contained 5 components: starch, gelatin, glycerol, acetic acid and curcumin. A half 5-factor central composite experimental design was used to evaluatethe effects of these components on the film properties. Our preliminary experiments determined the proper high and low values of each component content (Table 1). The composition of each film-forming mixture was then calculated using Minitab 15.0 software. The order of all experiments was randomized to reduce possibles time-dependent systematic errors.
Table 1: The boundary values of the factors
|
Factor (content of film components, g) |
Designation |
Low |
High |
|
Starch |
x1 |
0 |
9 |
|
Gelatin |
x2 |
0 |
9 |
|
Glycerol |
x3 |
3 |
5 |
|
Acetic acid |
x4 |
0 |
1.5 |
|
Curcumin |
x5 |
0 |
0.0225 |
Preparation of the Composite Films
Precalculated amounts of film-forming components were blended in 100 mL of distilled water and then magnetically stirred under heating at 75 °C for 30 min. The solution was then cooled for 10 min, poured into Petri dishes (10 g/dish), and left drying at room temperature for 48 h. The films were removed from the dishes and stored in a desiccator with saturated solution NaBr (to maintain an air with 58% relative humidity) for at least 48 h to equilibrate the moisture content in the films.
Characterization of the Films
The microstructural analysis of the films was carried out by using Scanning electronic microscope (SEM) (Hitachi S-4800, Japan) operating at a voltage of 10 kV.Fourier transform infrared (FTIR) spectra of the films were recorded with an ATR-FTIR spectrometer (Jasco FT/IR 4700, Germany) in the wavelength range from 4000 cm-1 to 400 cm-1 with a resolution of 4 cm-1 for 15 scans.The film color was determined using a colorimeter (Minolta, Japan).
The tensile strength (TS), elongation at break (EB) and Young’s modulus (YM) of the films were determined using a tensile tester (Testometric, UK) according to the ASTM Standard method D882-12. The films were cut into rectangles of 70×30mm2. Initial separation of the grips was 40 mm and the crosshead speed was 0.8 mm/s. The tensile test was replicated 5 times for each film sample.
TS of the films (MPa) was calculated as follows:

whereNmaxis the maximum load (N) applied to break the film sample and A is the area (thickness×width, mm2) of the film cross-section. Before tensile tests, the thickness of each film was measured at 10 pointsusing a thickness meter (Mitutoyo, Japan).
EB of the films (%)was calculated as follows:
wherel is the length (mm) of the film when broken and l0 = 40 mm is the initial grip separation.
Finally, YM of the films (MPa) was calculated as follows:

whereStress (N/mm2) is the maximum load (N) divided by cross-section area (mm2), and Strain is the change in length (l-lo, mm) divided by original length (l0 = 40 mm).
To determine the film solubility, each film was cut into 2×2-cm2 squares, dried in an oven at 105 oC for 24 h, and weighed to obtain the mass of dry matter (mo, g). The dried film was then immersed in distilled water for 2 h, dried again at 105 oC for 24h, and weighed to obtain the remaining dry weight (m1, g). All solubility experiments were conducted in triplicate.The solubility of the filmsS (%) was calculated as follows:
Responses of the Films to pH Changes
The film containing no acetic acid was used to investigate its response to pH change. Each film sample was wetted with 3 drops of a phosphate buffer (pH from 4 to 11).The film color before and after getting in contact with the buffer was determined using a colorimeter at 10 random points. The L*a*b color scale was used to express the degree of lightness (L), redness – greenness (a), and yellowness – blueness (b) of the films. The total color difference (∆E),compared to the white standard associated with the colorimeter, wasdefined as follows:
Results and Discussion
FTIR Analysis
FTIR spectroscopy was used to characterize the interaction between gelatin and starch. The FTIR spectra for gelatin, starch and composite film are shown in Figure 1 in the range of 4000-400 cm-1. For the reader’s convenience, the positions of all the peaks were noted explicitly in Figure 1. However, we would discuss below only some characteristic peaks.
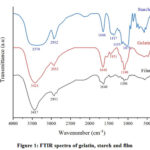 |
Figure 1: FTIR spectra of gelatin, starch and film Click here to View figure |
In Figure 1, the broad peak at 3370 cm-1 for starch and the sharp peak at 3424 cm-1 for gelatin are assignable to −OH and −NH stretching vibrations, respectively. The peak at 2931cm-1 (film) and the other two at 2932 cm-1 (starch and gelatin spectra)are assignable to C−H stretching. C=O stretching was observed via the peaks at 1646 cm-1 (starch), 1648 cm-1 (gelatin) and 1640 cm-1 (film).The peak at 1100 cm-1 for gelatin representsits characteristic C−N stretching.Finally, the peaks at 1079/1155 cm-1 for starchand 1106 cm-1for the film represent C−O stretchingvibration. The characteristic peaks were summarized in Table 2.
Table 2: Characteristic peaks from FTIR spectra of starch, gelatin and the film
|
Characteristic FTIR spectral peaks (cm-1) |
|||
|
Gelatin |
Starch |
Film |
Characteristic group |
|
1100 |
– |
– |
C−N stretching |
|
2932 |
2932 |
2931 |
C−H stretching |
|
1451 |
1417 |
– |
C−H bending |
|
1648 |
1646 |
1640 |
C=O stretching |
|
– |
1079/1155 |
1106 |
C−O stretching |
|
3424 |
– |
3437 |
−NH stretching |
|
– |
3370 |
– |
−OH stretching |
Chemical interactions of the film components are reflected by changes in the peaks of FTIR spectra. For example, in the spectrum of the composite film, the peaks originally related to −OH and −NH stretching vibrations in starch and gelatin, respectively, shifted from 3424 cm-1 and 3370 cm-1 to 3437 cm-1. This change demonstrates the intermolecularhydrogen bonds between amino groups of gelatin and hydroxyl groups of starch9.
SEM Analysis
The SEM microphotographs of the composite film using magnifications of ×200 and ×5000are shown in Figure 2.
 |
Figure 2: SEM images of the film cross-section |
The SEM image at ×200 showed that the structure of the film was homogeneous and dense (Fig. 2a). At ×5000, the presence ofpores/cavities in the structure was observed (Fig. 2b). Corn starch is composed of about 28% of amylose and about 72% of amylopectin.
Amylose is a linear chain of glucose units linked with α-(1→4) glycosidicbonds. Meanwhile, amylopectin is a chain of linear α-(1 → 4)-linked glucose units branched with α-(1→6)- branch points10. The arrangement of starch and gelatin during mixing and drying process might leave intergranular spaces relating to the formation of pores/cavities.
Study of Mechanical Properties and Solubility
Formulations of the composite films were designed by using CCD-RSM. The results for mechanical properties and solubility of the film samples are presented in Table 3, together with the corresponding film formulations.
Table 3: Tensile strength (TS), elongation at break (EB), young modulus (YM) and solubility (S) of the films.
|
Design point |
Independent variables |
Dependent variables* |
|||||||
|
x1 |
x2 |
x3 |
x4 |
x5 |
TS (MPa) |
EB (%) |
YM (MPa) |
S (%) |
|
|
1 |
6 |
6 |
4 |
1 |
0.015 |
1.502±0.044 |
71.755±3.784 |
12.064±0.515 |
43.90 |
|
2 |
12 |
6 |
4 |
1 |
0.015 |
3.506±0.418 |
55.270±10.440 |
83.682±19.448 |
15.22 |
|
3 |
6 |
6 |
4 |
1 |
0.015 |
1.494±0.261 |
83.455±18.650 |
10.106±4.363 |
45.45 |
|
4 |
3 |
9 |
3 |
0.5 |
0.0075 |
5.182±1.697 |
120.051±12.460 |
47.026±10.609 |
30.77 |
|
5 |
6 |
0 |
4 |
1 |
0.015 |
0.688±0.165 |
30.059±12.789 |
4.731±0.475 |
56.67 |
|
6 |
9 |
9 |
5 |
0.5 |
0.0075 |
2.652±0.207 |
84.766±6.984 |
41.014±14.319 |
44.19 |
|
7 |
9 |
9 |
3 |
1.5 |
0.0075 |
6.876±1.469 |
51.979±4.987 |
190.118±59.459 |
47.87 |
|
8 |
6 |
6 |
4 |
1 |
0.015 |
1.896±0.095 |
74.662±4.988 |
13.202±1.126 |
48.39 |
|
9 |
3 |
9 |
3 |
1.5 |
0.0225 |
3.759±0.242 |
144.732±9.652 |
22.575±1.551 |
53.93 |
|
10 |
9 |
3 |
3 |
1.5 |
0.0225 |
4.472±0.307 |
51.733±5.040 |
129.317±31.679 |
43.75 |
|
11 |
6 |
12 |
4 |
1 |
0.015 |
4.489±0.793 |
106.772±12.064 |
55.841±12.064 |
29.67 |
|
12 |
6 |
6 |
2 |
1 |
0.015 |
7.922±0.920 |
29.348±20.832 |
314.442±67.569 |
20.83 |
|
13 |
0 |
6 |
4 |
1 |
0.015 |
4.405±0.302 |
78.181±3.010 |
56.002±13.941 |
47.06 |
|
14 |
3 |
3 |
3 |
1.5 |
0.0075 |
0.336±0.071 |
36.405±20.825 |
12.550±12.413 |
59.14 |
|
15 |
9 |
9 |
3 |
0.5 |
0.0225 |
8.275±0.393 |
45.566±13.426 |
236.701±66.806 |
22.11 |
|
16 |
3 |
9 |
5 |
0.5 |
0.0225 |
1.210±0.166 |
118.595±12.960 |
3.606±0.355 |
48.98 |
|
17 |
6 |
6 |
4 |
1 |
0.015 |
1.551±0.157 |
71.427±21.448 |
11.637±0.908 |
43.00 |
|
18 |
3 |
9 |
5 |
1.5 |
0.0075 |
1.671±0.059 |
165.813±7.920 |
5.143±2.155 |
46.15 |
|
19 |
6 |
6 |
4 |
1 |
0 |
1.684±0.104 |
84.754±19.209 |
12.504±3.456 |
52.13 |
|
20 |
3 |
3 |
3 |
0.5 |
0.0225 |
0.349±0.028 |
41.345±1.271 |
3.115±1.972 |
53.85 |
|
21 |
6 |
6 |
4 |
1 |
0.015 |
1.609±0.289 |
62.827±8.234 |
19.521±6.939 |
45.00 |
|
22 |
9 |
3 |
5 |
1.5 |
0.0075 |
1.314±0.102 |
33.994±6.312 |
8.701±1.864 |
23.33 |
|
23 |
9 |
3 |
3 |
0.5 |
0.0075 |
2.085±0.474 |
32.114±10.067 |
35.481±9.507 |
35.48 |
|
24 |
6 |
6 |
4 |
1 |
0.015 |
1.379±0.249 |
69.356±12.195 |
7.819±1.972 |
41.03 |
|
25 |
6 |
6 |
4 |
1 |
0.03 |
1.732±0.203 |
89.834±12.460 |
12.386±3.750 |
47.31 |
|
26 |
9 |
9 |
5 |
1.5 |
0.0225 |
1.167±0.129 |
73.991±14.866 |
8.241±0.374 |
51.06 |
|
27 |
9 |
3 |
5 |
0.5 |
0.0225 |
0.932±0.010 |
26.683±2.394 |
6.359±0.271 |
19.28 |
|
28 |
6 |
6 |
4 |
2 |
0.015 |
1.288±0.128 |
94.886±16.675 |
6.943±1.197 |
32.14 |
|
29 |
6 |
6 |
4 |
0 |
0.015 |
0.920±0.379 |
88.067±14.502 |
4.874±1.174 |
43.18 |
|
30 |
3 |
3 |
5 |
1.5 |
0.0225 |
0.254±0.063 |
17.590±2.866 |
6.487±1.438 |
48.94 |
|
31 |
6 |
6 |
6 |
1 |
0.015 |
0.469±0.097 |
80.816±40.224 |
2.584±0.158 |
64.13 |
|
32 |
3 |
3 |
5 |
0.5 |
0.0075 |
0.404±0.078 |
37.171±11.509 |
4.891±2.100 |
65.96 |
*The results are expressed as mean ± standard deviation (n=3).
Using regressionanalysis for the data from the CCD experiments, a second-order empirical model was developed:
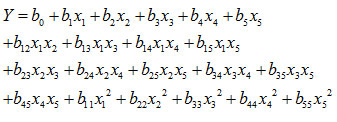
where Y – response variables, including TS, EB, YM and solubility; x1, x2, x3, x4, x5 – independent variables, which are the contents of starch, gelatin, glycerol, acetic acid, glycerol, and curcumin, respectively; b0 – intercept; b1, b2, b3, b4, b5 – regression coefficients for linear terms; b12, b13, b14, b15, b23, b24, b25, b34, b35, b45 – regression coefficients for interactions; b11, b22, b33, b44, b55 – regression coefficients for quadratic terms. Regression coefficients for each term and their p-valuesfrom the analysis of variance are shown in Table 4.
Table 4: Regression coefficients and analysis of variance of the second-order polynomials for TS, EB, YM and solubility S
|
Factor |
TS |
EB |
YM |
S |
||||
|
b |
p |
b |
p |
b |
p |
b |
p |
|
|
x0 |
1.643 |
0.002 |
73.758 |
<0.001 |
14.874 |
0.357 |
44.102 |
<0.001 |
|
x1 |
1.069 |
0.022 |
-27.225 |
0.001 |
50.477 |
0.009 |
-15.360 |
0.003 |
|
x2 |
2.347 |
<0.001 |
56.824 |
<0.001 |
37.494 |
0.037 |
-4.887 |
0.257 |
|
x3 |
-3.107 |
<0.001 |
9.859 |
0.159 |
-102.379 |
<0.001 |
7.015 |
0.118 |
|
x4 |
-0.044 |
0.914 |
6.966 |
0.304 |
0.772 |
0.962 |
2.624 |
0.534 |
|
x5 |
-0.051 |
0.901 |
-2.275 |
0.730 |
2.184 |
0.892 |
-0.845 |
0.840 |
|
x1x2 |
-0.072 |
0.943 |
-76.225 |
0.001 |
61.182 |
0.143 |
22.856 |
0.044 |
|
x1x3 |
-2.381 |
0.034 |
10.351 |
0.526 |
-115.495 |
0.012 |
-5.922 |
0.567 |
|
x1x4 |
0.273 |
0.787 |
-6.202 |
0.702 |
7.131 |
0.857 |
9.089 |
0.384 |
|
x1x5 |
0.979 |
0.342 |
8.075 |
0.620 |
34.737 |
0.389 |
-4.588 |
0.656 |
|
x2x3 |
-3.284 |
0.007 |
31.749 |
0.070 |
-71.143 |
0.093 |
17.604 |
0.107 |
|
x2x4 |
-1.620 |
0.129 |
16.282 |
0.325 |
-52.324 |
0.204 |
13.096 |
0.218 |
|
x2x5 |
-0.939 |
0.361 |
-9.348 |
0.566 |
-23.912 |
0.550 |
6.301 |
0.542 |
|
x3x4 |
-0.091 |
0.928 |
-5.400 |
0.739 |
-14.929 |
0.707 |
-17.850 |
0.103 |
|
x3x5 |
-0.848 |
0.398 |
-34.228 |
0.049 |
-12.834 |
0.741 |
-8.180 |
0.422 |
|
x4x5 |
-0.239 |
0.813 |
10.442 |
0.523 |
-42.769 |
0.293 |
13.342 |
0.210 |
|
x12 |
2.042 |
0.017 |
-11.182 |
0.360 |
43.742 |
0.155 |
-11.014 |
0.166 |
|
x22 |
0.675 |
0.375 |
-9.492 |
0.434 |
4.187 |
0.887 |
1.016 |
0.894 |
|
x32 |
2.423 |
0.007 |
-18.000 |
0.158 |
135.466 |
0.001 |
1.179 |
0.878 |
|
x42 |
-0.809 |
0.291 |
13.569 |
0.271 |
-20.191 |
0.496 |
-4.490 |
0.557 |
|
x52 |
-0.147 |
0.844 |
9.004 |
0.461 |
-9.887 |
0.739 |
6.693 |
0.390 |
The coefficients of determinations (R2) were 0.9276 for TS, 0.9282 for EB, 0.9019 for YM and 0.785 for solubility. These numbers mean that 92.76%, 92.82%, 90.19% and 78.5% of the experimental data can be explained by the fitted equations for TS, EB, YM and solubility, respectively. The high values of R2 indicate the fidelity of the adopted equations in modelling the effects of the composition of the films on their mechanical properties and solubility.
To visualize the revealed interactions between the independent variables on the responses, response surface plots were constructed for those pairs of independent variables that showed significant interactions (p <0.05) (Fig. 3). The remaining variables were kept constant at their middle values.
 |
Figure 3: Response surface plots showing the interactions of independent variables on TS (a, b), EB (c, d), YM (e) and S (f) |
The results in Table 4 show that TS of the films ismainly affected by varying the content of the polymers and glycerol (p <0.05). TS values varied between 0.254 and 8.275 MPa (Table 3), with minimum and maximum with the starch-gelatin-glycerol combination of (3, 3, 5) and (9,9,3) (gram), respectively (see also Fig. 3a,b). It is well known that the hydroxyl groups in starch form intra- and intermolecular hydrogen bonds with each other. The same happens between the amino groups in gelatin. When these two polymers are blended, additional hydrogen bonds appear between the hydroxyl and the amino groups, enhancingmechanical stability of the films11. Our results are in agreement with a previous research12, in which TS of films from chicken-skin gelatin was improved when incorporated with starch.
Glycerol also had a significant effect on TS of the films (p<0.001) (Table 4). Figure 2 (a, b) showed that at low levels of starch and gelatin, TS increased with the increase in glycerol concentration. In contrast, at high levels of starch and gelatin,higher glycerol concentration led to lower TS. Glycerol molecules are small and hydrophilic with three hydroxyl groups, thus can lie between hydrophilic polymer chains and acts as a plasticizer4. By forming hydrogen bonds with starch and gelatin molecules, glycerol diminish the direct hydrogen bonds between the polymer chains, thus reducing TS11.
Regarding EB, both starch and gelatin were found to have profoundeffects on the elongation property of the films (p < 0.05). EBvalues varied between 17.590 and 165.813 % (Table 3), and werelarger when higher gelatin concentration was applied (Fig. 3c, d). At high levels of gelatin, EB decreased with the increase in starch content (Fig. 3c). The decrease in EB ispossibly due to strong intermolecular interactions between the chains of starch and gelatin, which reduces flexibility of the films. In contrast, at low levels of gelatin, EB slightly increased with the increase in starch concentration (Fig. 3c). The observed increase in EBwas related to the change in mobility of polymeric chains15. The plasticizer reduces the inter- and intramolecular bonds between molecules of starch and gelatin, and then substitutes these bonds with hydrogen bonds formed between it and the polymeric molecules. Such disruption and reconstruction of starch and gelatin chains promotefilm flexibility and allow more chain mobility13.Moreover, glycerol with hydrophilic nature can hold more water molecules. The absorbed moisture could cause an extra plasticizing effect that led to the increase in EB and decrease in TS of the films13,14.
YM measures the stiffness of materials: a higher YM indicates a stiffer film12.The positive main effects of starch and gelatin mean that increasing the content of these polymers resulted in stiffer films (Table 4). This effect can be explained again by the strong intermolecular interaction between the chains of starch and gelatin, which produces a stronger structure of the films (Fig. 3e).
Finally, the water solubilities of the filmsare shown in Table 3. The content of starch significantly affectsthe film solubility (p<0.05). Figure 3f shows that the highest solubility (65.96%) was observed in the film with 3g of starch, while the lowest solubility (15.22%) in the film with 12 g of starch. This change might be due to the intermolecular interactions between the chains of starch and gelatin, whichreduces the number of available functional groups such as -OH and –NH2 that can form hydrogen bonds with water. Moreover, the strong interaction between starch and gelatin might enhance film cohesiveness, thus preventing the diffusion of water into the film. These observations are supported by a previous study where the film solubility decreased as starch was blended with gelatin at higher content12.
pH-Sensitivity
In this study, we used curcumin as a sustainable and safe indicator for smart packaging materials. It is well-known that curcumin changes its color from yellow to orange-red when the medium pH changes to alkaline due to the reaction with OH–group16:
 |
Scheme 1: Reaction of curcumin with OH– group |
The test film was homogeneously yellow due to the uniform dispersion of curcumin. Scheme 1 shows that its yellow color did not change when getting in contact with acidic-neutral media (pH ≤ 8), but turned red-orange in contact with alkaline media (pH ≥ 9). Moreover, the stronger the alkaline media was, the more intensive the orange-red coloration became.
 |
Figure 4: Responses of the film when getting contact with buffers of different pH |
The parameters L, a, b and ∆E indicating the film colors are shown in Table 5. The coordinate a represents a color between red (positive a) and green (negative a), and b represent a color between yellow (positive b) and blue (negative b). The parameter L represents the brightness, ranging from 0 (dark) to 100 (bright). Color changes with ΔE higher than 5 can be detected easily by human eyes, and ΔE higher than 12 indicates an obvious change in color17. When the buffer pH was in the range of 4-8, the values of L (from 71 to 76), a (from -0.5 to -5.7) and b (from 97.5 to 71.3) can be interpreted as a bright yellow color with a very small shade of green, which is in accordance with the upper panel of Figure4. Looking closer at thevalues of ΔE, one could see thatthere was a small color change when pH increased from 4 to 5, then the color remained quite the same at pH ranging from 5 to 8.
Table 5: The color parameters (L, a and b) and total color different (∆E) of the films in contact with solutions with various pH
|
pH |
4 |
5 |
6 |
7 |
8 |
9 |
10 |
11 |
|
L |
71.3±2.0 |
71.0±1.0 |
74.4±0.4 |
76.1±0.5 |
74.6±1.6 |
68.4±0.9 |
58.2±1.4 |
46.8±0.4 |
|
a |
-0.5±0.1 |
-2.3±0.5 |
-3.6±0.5 |
-2.1±0.2 |
-5.7±0.5 |
6.9±3.3 |
19.5±2.2 |
70±0.6 |
|
b |
79.5±2.9 |
72.8±0.5 |
74.6±2.1 |
77.9±0.6 |
71.3±1.2 |
65.7±2.6 |
60±1.9 |
60±1.3 |
|
∆E |
79.5±3.2 |
72.4±0.7 |
74.5±2.1 |
77.3±0.5 |
71.6±3.5 |
65.3±2.7 |
65.4±2.9 |
98.5±1.4 |
However, when pH increased to 9 and higher, all color parameters varied significantly, indicating distinct color changes. To be more specific, a strong reduction of Lis understood as that the color became darker;an increase of ameansan increase of redness; and asmall reduction ofbmeans that yellowness slightly decreased, whichcan be seen in the lower panel of Figure 1. Strong color changes occurred when pH increased from 8 to 9, and then from 10 to 11. These results demonstrated that the starch-gelatin films incorporated with curcumin can be applied as asmart packaging material, which can inform consumers about the product quality change, which associates with a pH change from neutral to basic6.
Conclusion
A promising smart food packaging film based on starch-gelatin incorporated with curcumin was investigated. The SEM micrograph of the film cross-section showed a homogeneous and compact structure. The film’s capacity to sense media pH was tested. As a food packaging material, the film could provide information about the quality of products by changing its color. RMS-CCD was successfully applied to investigate the effects of the film components on its properties. The results demonstrated that the examined responses for physical and mechanical properties were strongly influenced not only by starch, gelatin and glycerol contents separately but also by their interactions. This observation opened the window to further studies with the aim of finding the optimized formulation which provides the best physical properties for the composite film.
Acknowledgement
The authors are grateful to Science Research and Technology Transfer Institute, Industrial University of Ho Chi Minh City and Faculty of Chemical and Food Technology, Ho Chi Minh City University of Technology and Education. We thank Dr. Chien-Thang Tran for careful reading of the manuscript and insightful comments.
Conflict of Interest
The authors declare that there is no conflict of interest.
References
- Mustafa, F.; Andreescu, S.Foods2018,7(10), 168-188.
CrossRef - Rawat, S. Asian J. Plant Sci. Res.2015, 5(4), 47-56.
- Rattaya, S.; Benjakul, S.;Prodpran, T. J. Food Eng.2009, 95(1), 151-157.
CrossRef - Ramos, M.; Valdes, A.; Beltran, A.; Garrigós, M. C.Coatings2016, 6(4), 41-61.
CrossRef - Musso, Y. S.; Salgado, P. R.; Mauri, A. N. Food Hydrocoll. 2016,61, 523-530.
CrossRef - Musso,Y. S.; Salgado,P. R.; Mauri,A. N.Food Hydrocoll.2017, 66 (8), 8-15.
CrossRef - Musso, Y. S.; Salgado, P. R.; Mauri, A. N.Food Hydrocoll.2019, 89, 674-681.
CrossRef - Pabon, H. J. J. Rec. Trav. Chim. PaysBas1964, 83(4), 379-386.
CrossRef - Zhong,Q. P.; Xia, W. S. Food Technol.Biotechnol.2008,46(3), 262-269.
- Jha, P.; Dharmalingam, K.; Nishizu, T.; Katsuno, N.; Anandalakshmi, R. Starch‐Stärke2020, 72(1-2), 1900121-1900130.
CrossRef - Thakur, R.; Saberi, B.; Pristijono, P.; Stathopoulos, C. E.; Golding, J. B.; Scarlett, C. J.; Bowyer, M.; Vuong, Q. V. J. Food Sci. Technol.2017, 54(8), 2270-2278.
CrossRef - Alias, S. A.; Sarbon, N. M. NPJ Sci. Food2019, 3(1), 1-9.
CrossRef - Sanyang, M. L.; Sapuan, S. M.; Jawaid, M.; Ishak, M. R.; Sahari, J.Polymers2015,7(6), 1106-1124.
CrossRef - Chinma, C. E.; Ariahu, C. C.; Alakali, J. S.J. Food Sci. Technol.2015,52(4), 2380-2386.
CrossRef - da Rosa Zavareze, E.; Pinto, V. Z.; Klein, B.; El Halal, S.L.; Elias, M.C.; Prentice-Hernández, C.; Dias, A. R. Food Chem.2012, 132(1), 344-50.
CrossRef - Ma, Q.; Du, L.; Wang, L. Sens. Actuators B Chem.2017, 244, 759-766.
CrossRef - Liang, T.; Sun, G.; Cao, L.; Li, J.; Wang, L. Food Hydrocoll.2019, 87, 858-868.
CrossRef

This work is licensed under a Creative Commons Attribution 4.0 International License.
About The Author
![]()
A New Edition of Web of Science
Journal Impact Factor
2022: 0.5
Five Year: 0.8
Journal is Indexed in

Cabells Whitelist
![]()


