Simultaneous Determination of Iron and Cobalt Using Spectrophotometry after Catanionic Mixed Micellar Cloud Point Extraction Procedure
Ravi Kumar Kakitha1, Shyamala Pulipaka1* and Deva Hari Puranam1,2
1Department of PNCO, School of Chemistry, Andhra University, Visakhapatnam-530 003, Andhra Pradesh, India.
2Global Quality Investigations, Mylan, Canonsburg 15317, PA, USA.
Corresponding Author E-mail: shyamalapulipaka06@gmail.com
DOI : http://dx.doi.org/10.13005/ojc/360622
Article Received on : 04-08-2020
Article Accepted on :
Article Published : 30 Dec 2020
A new preconcentration method which utilises a mixture of cationic and anionic surfactants for separation and spectrophotometric determination of iron and cobalt simultaneously has been developed. Themetal ions, iron and cobalt were complexed with thiocyante. The hydrophobic complexes of iron and cobalt were then extracted into catanionic mixed micelles of cetyltrimethylammonium bromide (CTAB) and sodium dodecyl sulphate (SDS). Different parameters like concentration of HCl, concentration of thiocyanate, concentrations of the surfactants (CTAB and SDS), equilibration temperature and time were studied to get maximum efficiency. The linear ranges of Fe3+ and Co2+ were found to be 0.139 – 0.838 µg mL–1 and 5.89 – 35.4 µg mL–1, respectively; thedetection limits obtained were 1.54 ng mL–1 and 6.18 ng mL–1. The developed procedure has been employed for the retrieval of Fe3+ and Co2+ in watersamples successfully(tap water and sea water). 98 – 107% recoveries were obtained.
KEYWORDS:Cloud Point Extraction; Catanionic Mixed Micelles; Iron And Cobalt
Download this article as:| Copy the following to cite this article: Kakitha R. K, Pulipaka S, Puranam D. H. Simultaneous Determination of Iron and Cobalt Using Spectrophotometry after Catanionic Mixed Micellar Cloud Point Extraction Procedure. Orient J Chem 2020;36(6). |
| Copy the following to cite this URL: Kakitha R. K, Pulipaka S, Puranam D. H. Simultaneous Determination of Iron and Cobalt Using Spectrophotometry after Catanionic Mixed Micellar Cloud Point Extraction Procedure. Orient J Chem 2020;36(6).Available from: https://bit.ly/33oiKAC |
Introduction
Iron and Cobalt are the most important metals in biological systems, as they are the constituent elements in haemoglobinand vitamin B12 (Cyanocobalamin). The deficiency of these analytes might lead to deadly diseases like anaemiawhile the high levels of iron might causediseases like thalassemia.Excess of cobalt may result in cardiomyopathy or vasodilation in human beings.It is therefore important to determine thelevels of iron and cobaltaccurately.
Direct determination of these metals inwateris a complex process, because of their very lowconcentrations and the high interferences from other components in the solution. Hence, reducing the matrix effects is an important task prior to their determination. The cloud point extraction is an environmentally favourable technique which follows green chemistry principlesfor extraction. When the surfactants are heated they separate into two different phases at a particular temperature called cloud point temperature, the surfactant abundant phase and the water phase. Solutes/ metal ions can be removed into the surfactantphase. Incloud point extraction procedure,the two important factors for selection of surfactants is that the cloud point temperature should be close to room temperature and the other is extraction efficiency. The extraction of compounds is due to the hydrophobic and electrostatic interactions with the micelles. Maximum extraction efficiency is achieved by using two surfactants.
The method has been used for the extraction of metal complexes with ligands like APDC (ammonium pyrrolidinedithiocarbamate) [1– 4],8-HQ (8-hydroxyquinoline) [5, 6], 2-GB (2-guanidino benzimidazole) [7], TAN (1-(2-thiazolylazo)-2-naphthol) [8, 9 ], PMBP (1-phenyl-3-methyl-4-benzoyl-5-pyrazolone) [10], PHBI (2-phenyl-1H-benzo[d] Imidazole) [11], MPMP (2-[(2-mercaptophenylimino)methyl]phenol) [3], Me-BTABr (2-[2-(6-methyl-benzothiazolylazo)]-4-bromophenol) [12], MPKO (methyl-2-pyridylketone oxime) [13], anthralin (1, 8-dihydroxyanthrone) [14] and ACDA (2-amino-cyclopentene-1-dithiocarboxylic acid) [15].The addition of salts also influences the cloud pointwhere the temperature decreases by salting out effect [16– 18].The retrieval of iron and cobalt in different matrices by cloud point extraction was reported in literature using expensive instruments likeatomic absorption spectrometry with graphite furnace (GFAAS) [12, 19], inductively-coupled plasma with OES(ICP-OES) [5, 6].
In this paper we report thespectrophotometric determination of Fe3+ and Co2+ metal ions simultaneously in the presence of thiocyanate ligand using catanionic mixed micelles of CTAB and SDS. The surfactantphase of catanionic mixed micellesformed from CTAB and SDS have both positive and negative entities of the surfactants [20], which resulted in a strong synergistic effect(indicated by a negative interaction parameter between the two surfactants(b) [21, 22] thereby increasing theefficiency of the extraction process.The factors affecting theextraction were optimised to get maximum efficiency and the developed system was used for the calculation of Fe3+ and Co2+ in different real samples of water.
Materials and Methods
Instrumentation
A Shimadzu spectrophoto meter was used for measuring absorbance. A systronics digital pH meter 335 was used for all pH measurements.
Reagents and Solutions
Analyticalgrade reagents were used.Sigma-Aldrich make Cetyltrimethylammonium bromide, CTAB and(Sodium dodecyl sulfate, SDS) were used. Aqueous solutions of 10% (w/v)CTABand 10% (w/v) SDS were made. Standard solutions of Fe3+ and Co2+ were made from ammonium ferric sulphate and cobaltous chloride respectively which are taken as stock solutions. An aqueous solution of the ligand, sodiumthiocyante (NaSCN) obtained from Lobachemie, India. 5 mol L–1solution of NaSCN was made.
Experimental Procedure
In a graduated testtube, 0.15 mL of concentrated hydrochloric acid and standards of corresponding concentrations of analytes were added followed by 1.1 mL of 5mol dm–3NaSCN, 1.1mL of 10% (w/v) CTAB and 50 µL of 10% (w/v) SDSand made up to 10 mL with Milli-Q water. The mixture was then heated to 50 °C for 15 minutes. After heating, two phases were observed. Phase separation was obtained completely after reducing the temperature of the system during a period of one hour. In this method surfactant rich phase was observed at the top and bulk aqueous phase was observed at bottom. The non-surfactant phase wasdecanted. Methanol was used to dissolve the surfactantphase containing the metal ions and absorbance was recorded at wavelengths of maximum absorbance (502 nm for Fe3+–SCN– complex and 618 nm for Co2+–SCN– complex).
Results and Discussion
To get maximum efficiency of the method, each reagent concentration was changed and keeping all other reagents constant and optimizing each reagent at a time.
Variation of % (v/v) of HCl
Three types of mineral acids (H2SO4, HNO3 and HCl) were chosen for the initial study of the system. The recoveries of the analytes show that hydrochloric acid is the best acid for the extraction of these metal complexes simultaneously. The effect of HCl concentrationwas varied from 0 % (v/v) to 10 % (v/v). The extraction increases up to 1.5 % (v/v) of HCl and thereafter decreases. Figure 1 shows that the percentage concentration of HClfor the simultaneous extraction of Fe3+ and Co2+is 1.5 % (v/v).
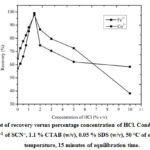 |
Figure 1: Plot of recovery versus percentage concentration of HCl. Conditions: 0.55 mol L–1 of SCN–, 1.1 % CTAB (w/v), 0.05 % SDS (w/v), 50 °C of equilibration temperature, 15 minutes of equilibration time. |
Variation of the amount of SCN–
The concentration of the monodentate ligand, SCN– selected for complex formation with analytes Fe3+ and Co2+ was varied in the range (0.1 to 0.6) mol L–1. The recoveriesincrease up to 0.55 mol L–1concentration of SCN–and then decrease for both the metals. Therefore, 0.55 mol L–1 of SCN–was used for the rest of the study(Fig.2).
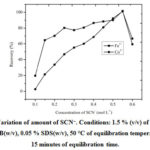 |
Figure 2: Variation of amount of SCN–. Conditions: 1.5 % (v/v) of HCl, 1.1 % CTAB(w/v), 0.05 % SDS(w/v), 50 °C of equilibration temperature,15 minutes of equilibration time. |
Variation of % (w/v) of CTAB
Percentage of CTABwas changed from (0.1 to 1.2) % (w/v) and recovery of Fe3+ and Co2+was studied. The metal retrieval increases up to 1.1 % (w/v) of CTAB and then decreases (Figure 3). 1.1 % (w/v)CTAB was fixed for the rest of the study.
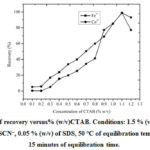 |
Figure 3: Plot of recovery versus% (w/v)CTAB. Conditions: 1.5 % (v/v) of HCl,0.55 mol L–1ofSCN–, 0.05 % (w/v) of SDS, 50 °C of equilibration temperature, 15 minutes of equilibration time. |
Optimization of % (w/v) of SDS
SDS concentration was varied from (0 – 0.1) % (w/v) to get maximum recovery. The extraction of analytes increases till 0.05 % (w/v) of SDS anddecreases thereafter (figure 4). Therefore, 0.05 %SDS concentration was used for maximum extraction of Fe3+ and Co2+.
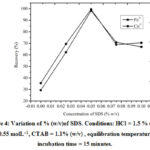 |
Figure 4: Variation of % (w/v)of SDS. Conditions: HCl = 1.5 % (v/v) ,SCN– = 0.55 molL–1, CTAB = 1.1% (w/v) , equilibration temperature=50 °C, incubation time = 15 minutes. |
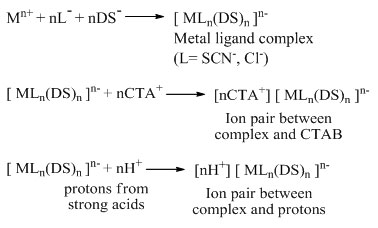
The metal extraction mechanism in for the mixed micellar system of CTAB and SDS can be explained by the following mechanism. The monodentate ligand, SCN–and anionic surfactant, SDS, form a negative metal complex which is then form ion-pair complex with protons from strong acids or positive surfactant CTAB.
Optimization of incubation time and equilibration temperature
It is always advisable to have shortest incubation time and temperature close to room temperature along with maximum recovery of the method.In the present study the equilibration temperature was varied from 25 to 100 °C and equilibration time was changed from5 to 60 minutes. The optimum temperature was observed to be 50 °C and optimum time was found to be15 minutesrespectively.
Analytical figures of the method
The analytical parameters of the developed method were determined. The observed linearity ranges of Fe3+ and Co2+from the calibration graphs were found to be 0.139 – 0.838 µg mL–1 and 5.89 – 35.4 µg mL–1, respectively. Theequations obtained were A = 0.532446[Fe3+] + 0.004214 and A = 0.013357[Co2+] + 0.013000 with correlation coefficients of 0.9990 and 0.9934 for Fe3+ and Co2+. Thedetection limits for Fe3+ and Co2+ were as low as 1.54 ng mL–1 and6.18 ng mL–1, respectively. The preconcentration factor and phase volume ratio of the method are 40 and 0.025, respectively (Table 1).
Table 1: Analytical parameters for the two metals.
|
Parameter |
Fe3+ |
Co2+ |
|
lmax (nm) |
502 |
618 |
|
Linear range (mg mL–1) |
0.13 – 0.84 |
2.9 – 35.4 |
|
Correlation coefficient (R2) |
0.9990 |
0.9934 |
|
LOD (ng mL–1) |
1.54 |
6.18 |
|
Preconcentration factor |
40 |
40 |
|
Phase volume ratio |
0.025 |
0.025 |
|
Extraction efficiency (%) |
98.26 |
100.76 |
A comparison of the results obtained from the developed method with methods reported in literature for the retrieval of Fe3+ and Co2+ is given in Table 2.
Table 2: List of the details of the present method and previous methods
|
Analytes |
Ligand |
Surfactants |
LOD |
Technique |
Matrix |
References |
|
Fe, Co and Ni |
APDC |
TX-114 |
19, 5 and 11 µg L-1 for Fe, Co and Ni. |
FIA-FAAS |
Waste, river, tap and sea water. |
[9] |
|
Fe |
Ferron |
TX-114 |
1.7 µg L-1 |
FI-FAAS |
Water and milk |
[42] |
|
Co |
PAN |
TX-114 |
0.6 µg L-1 |
Spectrophotometry |
Water samples |
[14] |
|
Co |
Without |
PONPE 7.5 |
10 ng L-1 |
ETAAS |
Drinking water samples |
[37] |
|
Co, Ni |
ACDA |
TX-114 |
7.5 and 10 µg L-1 for Co and Ni |
Spectrophotometry |
Natural and waste water samples |
[33] |
|
Fe, Co |
SCN– |
CTAB and SDS |
1.54 and 6.18 ng mL-1 for Fe and Co |
UV-vis Spectrophotometry |
Tap and sea water samples |
Method developed in this paper. |
Validation of the Method and Analysis of Real Samples
The developed cloud point extraction method usingCTAB and SDS mixed micellar system was employed for the simultaneous determination of Fe3+ and Co2+indifferentwater samples. 92 – 102 %spike recoveries were found (Table 3).
Table 3: Recovery values of Fe3+ and Co2+ in water samples along with spike recoveries.
|
Samples |
Spiked (µg mL-1) |
Detected (µg mL-1) |
Recovery (%) |
|||
|
Fe3+ |
Co2+ |
Fe3+ |
Co2+ |
Fe3+ |
Co2+ |
|
|
– |
– |
0.0906±0.0023 |
1.733±0.06 |
– |
– |
|
|
Tap water |
0.419 |
11.79 |
0.519±0.02 |
13.84±0.297 |
102.24±4.89 |
102.69±2.07 |
|
0.698 |
23.57 |
0.783±0.04 |
25.62±1.09 |
99.2±5.65 |
101.34±4.36 |
|
|
– |
– |
ND |
ND |
– |
– |
|
|
Sea water |
0.419 |
11.79 |
0.403±0.02 |
11.27±0.36 |
96.18±5.18 |
95.59±3.05 |
|
|
0.698 |
23.57 |
0.646±0.03 |
21.69±1.02 |
92.55±4.65 |
92.02±4.31 |
|
ND:Not Detected |
||||||
Conclusion
A new cloud point extraction method based on catanionic mixed micelles of CTAB and SDS for thepreconcentration of Fe3+ and Co2+ and their determinationsimultaneously using spectrophotometry in different water samples in the presence of thiocyanate as ligand was developed. This new method is much simple and accurate and for the determination of Fe3+ and Co2+ at ng mL–1 level.
Conflict of Interest
Contributing authors have no conflict of interest regarding the publication of this research work
Funding Resourse
there is no funding resourses.
References
- Giokas, D. L.; Paleologos, E. K.; Tzouwara-Karayanni, S. M.;&Karayannis, M. I.J. Anal. At. Spectrom.2001, 16, 521–526
CrossRef - Paleologos, E. K.; Giokas, D. L.; Tzouwara-Karayanni, S. M.; &Karayannis, M. I.Anal. Chim.Acta. 2002, 458, 241–248
CrossRef - George, L. D.; Clésia, C. N.; Ana, R. A. N.; Marco, A. Z. A.;& Joaquim, A. N. Microchem J.2006, 82, 189–195
- Dimosthenis, L. G.; Evangelos, K. P.; & Miltiades, I. K.Anal. Bioanal. Chem. 2002,373, 237–243
- Francisco, L. F. S.; Wladiana, O. M.; & Gisele, S. L. Anal. 2015, 7, 9844–9849
- Lingling, Z.; Shuxian, Z.; Keming, F.; Zhaosheng, Q.; &Jianrong, C. J. Hazard. Mater. 2012, 239-240, 206 – 212
- Dallali, N.; Zahedi, M. M.; & Yamini, Y. Sci Iran. 2007 14, 291–296
- Ghulam, A. K.; Tasneem, G. K.; Jameel, A. B.; Sirajuddin., Hassan, I. A.; Abdul, Q. S.; Hafeez, R. S.; Nida, F. K.; & Sham, K. W. J. Aoac Int.2010, 93, 1589–1594
- Sidnei, G. S.; Pedro, V. O.; Fábio, R. P. R. J Brazil Chem Soc. 2010, 21, 234-239
- Pei, L.; Hongbo, S.; Zhimei, S. J. Colloid Interface Sci. 2006, 304, 486–490
CrossRef - Ghaedi, M.; Shokrollahi, A.; Niknam, K.; Soylak, M. Sep Sci Technol. 2009, 44, 773–786
CrossRef - Valfredo, A. L.; Robson, S. F.; & Bruno, O. M. Sep. Purif. Technol.2007, 54, 349–354
- Ghaedi, M.; Shokrollahi, A.; Ahmadi, F.; Rajabi, H. R.; Soylak, M.J. Hazard. Mater. 2008, 150, 533–540
CrossRef - Assadollah, B.; Saeed, B.; & Mina, R. Microchem J. 2012, 100, 66–71.
CrossRef - Safavi, A.; Abdollahi, H.; Hormozi, N. M. R.; Kamali, R. Spectrochimi Acta A. 2004,60, 2897–2901
CrossRef - Tayyebeh, M.; Abbas, A.; Afrouz, M. Talanta, 2007, 71, 610–614
CrossRef - Alaa, S. A.; Mohammed, A. K. Talanta, Y. M. RSC Adv.2015, 5, 52095–52100
CrossRef - Wael, I. M.; Al-Ahmad, Z. A.; Mohamed, M. H. Anal. Methods. 2013, 5, 5234–5240
- Raúl, A. G.; José, A. G.; Roberto, O.; Luis, D. M.; Soledad, C. Talanta. 2008, 76, 669–673
- Sylvain, P.; Michael, G. J Colloid Interface Sci. 2009, 337, 472–484
CrossRef - Sara, B. L.; Xiang, W.; Mohammad, R. I.; Emily, J. D.;Douglas, S. E. Phys. Chem.Chem. Phys. 2009, 11, 9315–9325
- Shakerian, F.; Dadfarnia, S.; Haji Shabani, A. M.JIran Chem Soc.2009,6, 594–601
CrossRef

This work is licensed under a Creative Commons Attribution 4.0 International License.
About The Author
![]()
A New Edition of Web of Science
Journal Impact Factor
2022: 0.5
Five Year: 0.8
Journal is Indexed in

Cabells Whitelist
![]()


