Determination of the Order of Kinetics of a DTA Curve by Using the Concept of Skewness
Bikash Kumar Sarkar1* , Indranil Bhattacharyya2, Ananda Sarkar2 and Partha Sarathi Majumdar2
1Department of Physics, Mrinalini Datta Mahavidyapith, Birati, Kolkata-700051, West Bengal, India.
2Department of Physics, Acharya Prafulla Chandra College, New Barrackpore, Kolkata-700131, West Bengal, India.
Corresponding Author E-mail: biku.mdm@gmail.com
DOI : http://dx.doi.org/10.13005/ojc/360632
In the present paper,a novel way of finding out the order of kinetics of Differential Thermal Analysis (DTA) curves by using the concept ofskewness (Sk) has been investigated.It is found that for a particular DTA peak, skewness is a function of both the order of kinetics and the quantity, . First order DTA peaks are characterized by negative skewness whereas those for the second order are characterized by positive skewness.Therefore, skewness can be used as an indicator of the order of kinetics of a DTA peak. We have evaluated and compared theorders of kinetics of some reportedDTA peaks using the concept ofskewness and found that the resulting values of the orders of kinetics are in fair agreement with those reported in literature.
KEYWORDS:Activation Energy; Differential Thermal Analysis; Orders of Kinetics; Skewness
Download this article as:| Copy the following to cite this article: Sarkar B. K, Bhattacharyya I, Sarkar A, Majumdar P. S. Determination of the Order of Kinetics of a DTA Curve by Using the Concept of Skewness. Orient J Chem 2020;36(6). |
| Copy the following to cite this URL: Sarkar B. K, Bhattacharyya I, Sarkar A, Majumdar P. S. Determination of the Order of Kinetics of a DTA Curve by Using the Concept of Skewness. Orient J Chem 2020;36(6). Available from: https://bit.ly/3mgxIzz |
Introduction
Differential thermal analysis (DTA) is a method which is dependent on the observation of chemical and physical changes in a given sample occurred due to the change of temperature in a predetermined manner1, 2, 3.The curves obtained by such analysis are called DTA curves. Three important kinetic parameters, namely order of kinetics n , activation energy E and pre-exponential factor A can be evaluated from these DTA curves for different energetic materials.Since,the shape of the peak of the DTA curves and thevalues of kinetic parameters are indicators of the composition of the sample, these curves are widely utilized for the qualitative identification of inorganic and organic substances.
Order of kinetics (n) is one of the important kinetic parameters of a DTA curve. It is related to the symmetry of a DTA curve.From the statistical point of view, the symmetry of a DTA curve should be determined by using a longer portion of the curve.This symmetry can be characterized by the skewness (Sk ) of DTA peaks.In the present study, skewness of DTA curves resulted from kinetic order model (KOM)has beeninvestigated. A novel attempt has been made to relate the skewness of a DTA peak with its order of kinetics. Finally, the present technique is applied to determine the orders of kinetics (n) of some reported DTA curves. To best of our knowledge, DTA curve has not been analysed by using the concept of skewness.
Methodology
Concept of skewness
Skewness4, 5 is the degree of asymmetry of a distribution. If the frequency curve of a distribution has a longer tail to the right of the maximum than to the left of the distribution, it is said to be skewed to the right or has positive skewness. If the reverse happens, it is said to be skewed to left or negatively skewed. A symmetric distribution has zero skewness. Different types of skewness are shown in Fig. 1.
 |
Figure 1: Different types of skewness Click here to View figure |
The order moment4, 5about an arbitrary origin is defined as

where, (X1) and x are respectively i observed value and mean value of the distribution and is the number of data points. Skewness, actually, indicates the lack of symmetry. The odd order central moments are positive for positively skewed distribution, zero for symmetric distribution and negative for negatively skewed distribution. The 3 order central moment about the mean is give by

It can be shown that for positively skewed distribution, m3 is positive whereas for negatively skewed distribution m3 is negative. For this reason, is taken as the moment measure of skewness. m3 increases with the increase of asymmetry. As m3 depends on the unit of measurement, it is not a pure number.
The dimensionless form of skewness is given by4,5

where, S³ is the standard deviation
Theoretical analysis of DTA curves recorded under a linear heating scheme:
The rate of change of concentration for a solid state reaction can be expressed as6
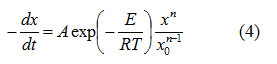
where, x is the initial concentration, x is the concentration at time t , A is the pre-exponential factor and R is the universal gas constant. The temperature deviation T for a DTA curve from horizontal base line is given by
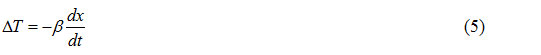
where, β is a proportionality constant.
For a linear heating scheme
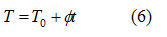
where, Τ0 and T are respectively initial temperature and temperature at time t and ∅ is the constant heating rate.
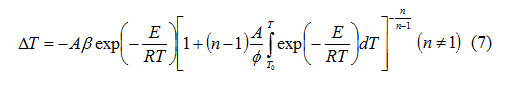
From equations (4), (5) and (6), it follows that
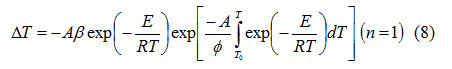
At peak temperature, T = T m the deviation of the DTA curve from the base line is extremumand.
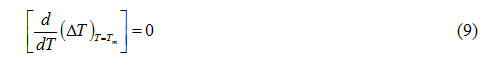
From equations (6)-(8), it is possible to write
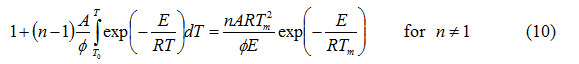
and
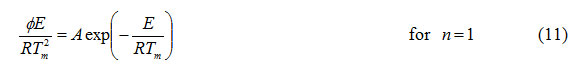
The integral
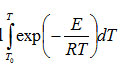
is commonly known as temperature integral1. The lower limit T0 of the above integral can be replaced by zero for which
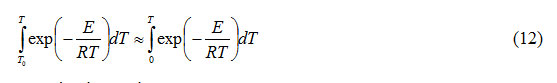
It can be shown that
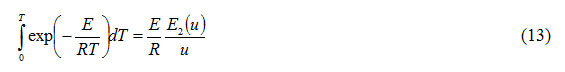
is the second exponential integral7. Using equations (7), (8), (10) and (11), it follows that
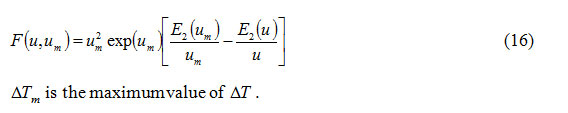
Calculation of skewness for a DTA curve: The curve obtained by plotting T as independent variable and ΔT as dependent variable represents a DTA curve.Therefore, from equations (7) and (8), the skewness
corresponding to

for a DTA curve with a particular order of kinetics n is given by
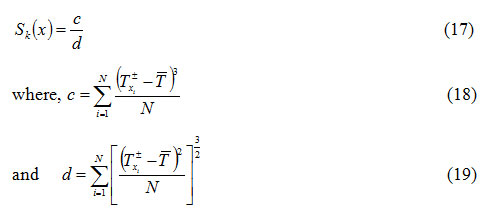
where, T ± is the temperature in DTA curve corresponding to

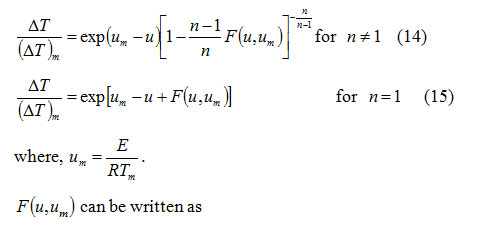
is the average of all temperatures taken into consideration. Equation (18) can be derived by the concept of equation (2). For a particular value of , one can calculate

for an arbitrary value of from equations (14) and (15) (for n ≠ 1 and n =1) by using an iterative technique8.

stand respectively for temperatures in the left and righthalves of the peak.

can be evaluated by using equation (17) for different values of x .
Results and Discussion
From the discussions in the previous section, it is evident that

can be evaluated by using equation (17) for different values of x.To check the validity of the concept adopted, S κ(0.5)
particular value of x, S κ(0.5) depends both on n and

and varies from -0.08 to -0.142 as u is changed from 10 to 100 for first order kinetics(n=1) .Again for(n=2) , the value of S κ(0.5) varies from 0.0075 to 0.009 for . It is, however, observed that the dependence of S κ(0.5) on um is weaker than the dependence of S κ(0.5) on .In Fig. 2, the variation of S κ(0.5) with um is shown for n=1 , 1.5 and 2. It is evident from Fig. 2 that S κ(0.5) decreases with increase in um for all values of n .Therefore, Sκ(0.5) depends both on n and um . Skewness has also been evaluated for two other values of x namely x=0.6667 and x= 0.8 to study the consistency of the results.These are denoted by Sκ (0.6667) and Sκ (0.8).
 |
Figure 2: Variation of skewness(x=0.5) with um |
For a particular value of x and n , the value of Sκ (x) is not unique. Therefore, for a particular value of x and n , themean value of Sκ (n ) for
is calculated. The mean value of Sκ (x) for a particular value of n for the range

is given by
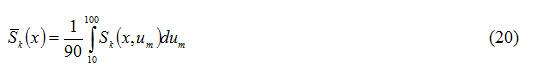
To increase the accuracy of the evaluation of the integral in equation (20), the range (10, 100) of the integration is divided into a number of sub-ranges (10, 20), (20, 30), (30, 40), (40, 50), (50, 60), (60, 70), (70, 80), (80, 90) and (90, 100). The integral over each sub-range has been carried out by using 16-point Gauss-Legendre quadrature7. In Fig. 3, the variation of

with order of kinetics n for 1 ≤ n ≤ 2 is depicted. It is noticed from Fig. 3 that the sign of
 |
Figure 3: Variation of average value of skewness ( x=0.5, 0.6667, 0.8)with order of kinetics n |

changes around n =1.7 to 1.8. Therefore, as varies from first order to second order, DTA curve gets transposedfrom symmetric to asymmetric type. Skewness, therefore, is both a qualitative and quantitative indicator of the symmetry of a DTA curve.

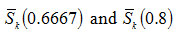
has also been calculated for x= 0.6667 and x=0.8 . The variations of

with um are also shown in Fig. 3.

also display the change of sign. The variations of
with um for n= 1, 1.5 and 2 are respectively presented in Fig. 4 and in Fig. 5. Finally, by using the technique of least square fitting4,
 |
Figure 4: Variation of skewness(x =0.6667) with um Click here to View figure |
 |
Figure 5: Variation of skewness(x=0.8) withum |
are expressed as a function of order of kinetics n as follows:
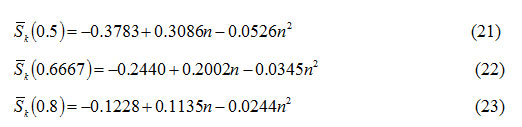
Using equations (21)-(23),the order of kinetics n of DTA peaks has been calculated.
Calculation of order of kinetics by using skeewness from reported DTA curves
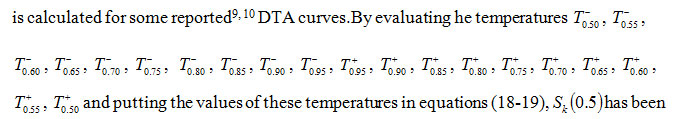
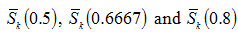
Somereported9, 10 DTA curves of Georgia kaolinite, Eureka halloysite, RDX and TNT are considered. Sκ (x) for different values of x has been computed from these curves. The values of Sκ(0.5), Sκ (0.6667) and Sκ (0.8) for these DTA peaks computed have been presented in Table-1. The orders of kinetics of these peaks as determined from their skewness (equations 21-23) have also been displayed in Table-1. It is observed that the mean value of the orders of kinetics of these peaks is in fair agreement with corresponding values reported in the literature9,10.
Table 1: Determination of the orders of kinetics of some reported DTA peaks9, 10using skewness.
|
Material |
Heating Rate (0Cmn-1) |
Kinetic parameters of the peaks as reported in the literature9, 10 |
Sk(x) |
n calculated from eqns. (21-23) |
Mean n |
||||||
|
E (kcal) |
A (sec-1) |
n |
Sk (0.5) |
Sk (0.6667) |
Sk (0.8) |
Sk (0.5) |
Sk (0.6667) |
Sk (0.8) |
|||
|
Georgia kaolinite9 |
6 |
36.51 |
3.33×10⁶ |
1.0 |
-0.115 |
-0.066 |
-0.031 |
1.01 |
1.10 |
1.04 |
1.05±0.04 |
|
Eureka halloysite9 |
6 |
37.76 |
5.05×10⁷ |
1.0 |
-0.119 |
-0.068 |
-0.032 |
1.03 |
1.08 |
1.02 |
1.04±0.03 |
|
RDX10 |
15 |
46.58 |
7.10×10¹⁷ |
0.96 |
-0.142 |
-0.082 |
-0.038 |
0.93 |
0.98 |
0.90 |
0.94±0.05 |
|
TNT10 |
6 |
21.95 |
6.78×10⁵ |
1.65 |
0.0003 |
-0.0004 |
-0.0003 |
1.70 |
1.74 |
1.74 |
1.73±0.02 |
|
TNT10 |
10 |
20.99 |
2.87×10⁵ |
1.75 |
0.0163 |
0.009 |
0.004 |
1.85 |
1.85 |
1.87 |
1.86 ±0.01 |
Conclusion
In the present paper, the skewness of DTA curves has been studied. Skewness of a first order DTApeak is negative and that of a second order DTA peak is positive. Furthermore, as the sign of skewness changes as order of kinetics of a DTA curve changesfrom first order to second order, it is also a qualitative indicator of the symmetry of a DTA curve. Since skewness is evaluated by using a longer portion of a DTA curve, it can be utilized as a reliable indicator of the order of kinetics of the curves considered.We have evaluated orders of kinetics of some reported DTA peaks and encouraging results have been obtained. This concept of finding out the order of kinetics of DTA curve can serve as a powerful method.
Acknowledgment
We acknowledge Dr. Saktibrata Bhowmik, Principal, Acharya Prafulla Chandra College for providing the facilities to carry out thework and fruitful discussions.
Conflict of Interest
The authors have no conflict of interest to declare
References
- Chen, R.; Krish, Y. Analysis of Thermally Stimulated Processes, Pergamon Press, Oxford, 1981.
CrossRef - Chen, R.; Mckeever, S. W. S.Theory of Thermoluminescences and Related Phenomena, World Scientific, Singapore, 1997.
CrossRef - Balarin, M.Journal of Thermal Analysis, 1979, 17, 319-332.
CrossRef - Das, N. G. Statistical Methods, McGraw Hill Education (India) Private Limited, 2012.
- Spigel, M. R.; Stephens, I. J.Theory and Problems of Statistics, 3rd Edition, Tata McGraw Hill Publication Company, New Delhi, 2000.
- Luo, K. M. Thermochim. Acta, 1995, 255, 241-254.
CrossRef - Abramwitz, M.; Stegun, J. A. Hand Book of Mathematical Functions, Dover, New York, 1965.
- Balagurusamy, E. Numerical Methods, TataMcGraw Hill Publication Company, New Delhi, 2000, Chapter 6.
- Yang, R. T.; Steinberg, M. Anal. Chem., 1977, 49, 998-1001.
CrossRef - Huang, C. C.; Wu, T.S. Thermochim. Acta, 1992, 204,239-250.
CrossRef

This work is licensed under a Creative Commons Attribution 4.0 International License.
About The Author
![]()
A New Edition of Web of Science
Journal Impact Factor
2022: 0.5
Five Year: 0.8
Journal is Indexed in

Cabells Whitelist
![]()


