Study of Growth and Sublimation of Germanium Nitride Using the Concept of Tedmon's Kinetic Model
Irakli Nakhutsrishvili
Institute of Cybernetics of Georgian Technical University, Tbilisi, Georgia.
Corresponding Author E-mail: iraklinakhutsrishvili52@gmail.com
DOI : http://dx.doi.org/10.13005/ojc/360508
Article Received on : 01-05-2019
Article Accepted on : 10-09-2020
The paper gives a mathematical model of a thermogravimetric curve for the growth of scale on a metal surface with its simultaneous sublimation is presented and considers the case of the growth-sublimation of scale being preceded by the process of gas etching of the monocrystal surface. The obtained equations are used to describe the kinetic curve of the mass change of a germanium sample when a nitride layer is formed on it in a medium of hydrazine vapors.
KEYWORDS:Germanium Nitride; Growth and Sublimation; Tedmon's Kinetic
Download this article as:| Copy the following to cite this article: Nakhutsrishvili I. Study of Growth and Sublimation of Germanium Nitride Using the Concept of Tedmon's Kinetic Model. Orient J Chem 2020;36(5). |
| Copy the following to cite this URL: Nakhutsrishvili I. Study of Growth and Sublimation of Germanium Nitride Using the Concept of Tedmon's Kinetic Model. Orient J Chem 2020;36(5). Available from: https://bit.ly/3jF5JYM |
Introduction
The growth of a scale on the surface of a metal or alloy in the active gas medium is often accompanied by secondary processes limiting its kinetics. In particular, such a process is the sublimation of scale, which leads to the change of the form of the kinetic equations describing the process1,2. The work3 considers the mathematical model of the kinetic dependence of the mass change of the metal (alloy)-scale system in the course of this process. This model uses the equation of the mass gain of the system per unit area (m) due to the active gas, as a starting point.

Where n=2 or 3; kn is the power-law constant; kr is a rectilinear constant; vg is the speed of the system mass reduction due to the gas component of the subliming part of the scale; t is the time. Its integral form is as follows:

where
![]()
is the maximum mass gain of the system at the expense of active gas. By considering expression (2), the total mass change (M) is possible to represent in a parametric form:

where q is the stoichiometric coefficient of conversion of the gas component of the scale into a metallic component. At the same time vm/vg=q, (vis the rate of mass reduction of the system due to the metallic component of the sublimated part of the scale);
![]()
For the given values of the index of power n and boundary conditions, solutions of Eq. (2) can be represented by means of elementary functions. Thus, for n=2, 3 and 4 provided t=0,m=0

and

Respectively. Explicit expressions of the given type (when k=0) are given in a number of works to describe experimental data4-10.
In reference 3 , Eqs.(3) and (4) were used to describe the thermogravimetric curves of the growth-sublimation of germanium nitride (Ge3N4) formed by the interaction of ammonia with the surface of Ge(111) at temperatures of 800-820OC (3Ge+4NH3=Ge3N4+6H2). It should be noted, however, that the process of formation-sublimation of the reaction product can be preceded by other processes, for example etching of the surface of a monocrystal11. An example of this is the nitriding of same germanium in hydrazine vapors (3Ge+4N2H4=Ge3 N4+4H2).This part of the paper considers the mathematical model of the kinetic curve (mass change-time) of growth-sublimation of Ge3 N4 in the medium of vapors N2 H4 in the presence of the etching process of Ge surface.
Experimental
initial reagents were germanium plates (with the same pretreatment procedure described in 3) and concentrated hydrazine with refraction index n20D=~1.705 . The inlet pressure of vapor N2H4 was =~ 2.103Pa. The temperature interval was 650-800oC. The scale formed on the germanium surface, according to X-ray analysis, was a mixture of α- and β-modifications of Ge3 N4 . The registration of the sample mass change during the reaction was done on the continuous weighing microbalance mounted in a vacuum installation (the sensitivity of the balance was 10-6 g).
Results and Discussion
Figure 1 shows the most typical thermo-gravimetric curve of the mass change of a germanium sample in hydrazine vapors obtained at 720oC. Section 0A corresponds to the accumulation of hydrazine and the products of its decomposition on the surface of Ge.
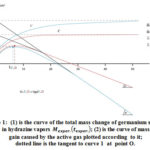 |
Figure 1: (1) is the curve of the total mass change of germanium sample in hydrazine vapors ; (2) is the curve of mass gain caused by the active gas plotted according to it; dotted line is the tangent to curve 1 at point O. |
The abnormally high initial sample mass gain for the adsorption processes can be explained by the presence of highly polarized forms on the surface of germanium capable of accumulating in large quantities due to physical forces11. (We would like to note that in the NH3 media, no similar initial increments of the germanium sample are observed.) The negative course of the mass change along AC section(the mass of the sample gradually becomes smaller than its initial mass) evidences the presence of etching process of the Ge surface. Later, a mass increase is observed repeatedly (section CD) caused by the gradual growth of the nitride layer. Nitride formation is accompanied by its sublimation (like in case of NH3)3 as evidenced by the precipitation of an amorphous germanium oxynitride film in the cold zone of the reactor. The sublimation process causes a repeated decrease of mass of the sample (section DF). The rectilinear part of this section (EF) corresponds to the steady state reaction, when the nitride layer reaches its maximum mass (thickness): at this stage, the amounts of the forming and subliming nitride are equalized.The slope of straight line EF corresponds to the rate of mass decrease of the sample due to the metallic component (vm) of the subliming part of nitride. According to Fig.1,

Eq. (2) for any n>1, assumes convexity of the corresponding graph m(t) along the positive direction of the ordinate axis. Therefore, the considered mathematical model can be applied by choosing a new coordinate system (t,m) with the origin at the second inflection point (O) on the experimental curve Mexper(texper) (Fig.1). The values of characteristic parameters of the process determined in this new system of coordinates are:

![]()
where m in mg/cm2, t in hours.
To determine the exponent , we use formula 3, 12 :

This formula is an analog of formula derived in 6, which in our designations of experimentally determined quantities is as follows:

By substituting the experimental values in Eqs.(7) and (8), we obtain n=~ 5.9 abd 5,1, respectively. (In the first part of the work, for the nitriding of germanium with ammonia, the values n=~ 2.2 and 3.3 were obtained. This made it possible to describe the corresponding thermogravimetric curves with Eqs. (3) and (4); see also appendix 1.) In our case, with the aim of selecting the appropriate equation to describe dependence of t , constructed based on the curve Mexper(texper) , we give all the graphs for n =2, 3, 4 and 5 in Eq.(6) for the boundary conditions t = 0, m = 0 , see Fig.2, curves (1-4).
 |
Figure 2: Graphs of Eq. (2) when (1)n = 2, (2)n = 3, (3)n=4, (4)n=5; (5)is curve 2 in Figure 1. |
It also shows dependence m(t) from Fig.1 (curve 5). The fact that this graph is saturated on top of all calculated curves is not unexpected: the thermogravimetric experiment is performed with a certain accuracy, and the exit of curve 5 on the ordinate m max=0.092 mg/cm2 is observed for 6 hours (in (t,m) coordinate system); while theoretically, m -> m max as t -> Fig.2 shows that curve 3 (constructed from ) is the closest to curve 5. In this connection, it should be noted that value in Eqs. (7) and (8) change significantly with relatively small changes of the parameters included in them. For instance, if in Fig.1, artificially increasing the slope of the EF line by 20%, then changing the value vm will change the values of vg, v max and ko (k, respectively). Then, for the same values of t and M in Eqs.(7) and (8), we obtain n=4.3 and 3.7, respectively. Thus, gaining values n>4 from formulae (7) and (8) should be associated with the error in measuring the experimental values. Moreover, when the equation corresponding to n=5 (see appendix 2) lacks physical meaning.
It should be noted, however, that none of the curves presented in Fig.2 correspond totally to the “true” mass gain of germanium sample, since it is obvious that the growth of the nitride layer will occur well before the occurrence of second inflection point (O) on experimental curve Mexper(texper) (the same process is also observed in the control experiments). To estimate the value of this initial “hidden” mass gain (m0), we can solve Eq. (2) for n=4 with boundary conditions t=o, m=m0 . This solution is shown by the following expression:

Thus, m0 can be determined by an approximate solution of transcendental Eq.(10) by considering the values of experimentally calculated indices (see appendix 2). Assuming that in the study process, the environs of the first inflection point (B) corresponds to the onset of nitride formation, the time shift between the two inflection points (t0) can be estimated with value t0=11.5+1.5=0.192 hour(Fig.1). Eq.(10′) gives the value m=0.030 mg/cm2. This value is >30% of the “observed” mass gain , which cannot be ignored when studying the process by the thermogravimetric method.
Dependence m(t) constructed from Eq. (9′) is shown in Fig.3 (curve 1). This figure also shows the extrapolation of curve 1 in the negative direction of the ordinate axis (curve 2). In new coordinate system (t,m), this curve can be considered as the “true” kinetic dependence of the mass gain of a germanium sample in hydrazine vapors.
 |
Figure 3: Ggraphs of Eq.(9′) for 1(m) ≥ 0 and (2) m ≳-0.037 mg/cm2. (On site m ≥ 0, curve 2 coincides with curve 1.) |
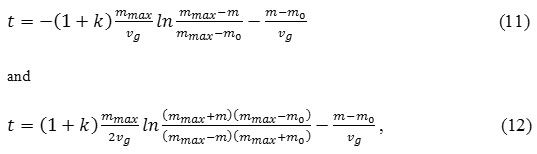
From Eq.(1) that graphs kinetic dependences m(t) must have the top at the point with ordinate
 |
Figure 4: Graphs of Eqs.(3) and (5) when (1, 1′) k and (2, 2′) k= 0.5 with rated (dimensionless) coordinates.(m/m max is considered as an argument, and vg t/m max-as a function.) In the block: dependence of correlation m module on coefficient k |
As value m increases with an increase of value k, it can be assumed that “hidden” mass gain m0~k ; and that in this case, . m0 = -m. This assumption can be justified by the fact that for low values of rectilinear constant kr (and consequently, for high values of parameter k = vg/ko= vg/(kr – vg) ), the kinetic control of the process will be quite visible. And with the predominance of diffusion control (at high values of kr), the model in question will assume all the low values of Therefore, Eq. m0=-m will probably have a physical justification. In this connection, we can add that in the past, we empirically deduced a similar equality in the study of the oxidation of the structural (Al2O3 forming) chromium alloys in air 13. (In this case, the secondary process, which changes the form of the initial parabolic equation, is not the sublimation of the scale, but the decrease of the effective area of reaction due to the formation of diffusion barriers from the oxides of the doping elements of the alloy.)
Conclusion
The above equations can be used to describe thermogravimetric curves of the growth-sublimation of scale, when this process is preceded by gas etching of the metal(alloy) surface. According to its, we can determine the initial “hidden” mass gain, which is not directly revealed on thermogravimetric curves. This approach can also be used for parabolic and cubic processes. In this case, solutions of Eq. (2) for n= 2and 3 provided t = 0, m = m0will be:
Time shift between Eqs.(3) and (11)

By calculating values ko,vg, mmax and to from the experimental data, “hidden” mass gain mo can also be identified by using approximate solutions of Eqs.(13) and (14).
Acknowledgments
Author thanks the leader engineer of the Institute of cybernetics Omar Tkheshelashvili for useful participating of discussing of the article.
Conflicting Interest
There is no conflicting interest in this study.
References
- Tedmon, C.S. Electrochem. Soc., 1966,113 (8), 766-768.
CrossRef - Taimatsu, H. Electrochem. Soc., 1999, 146 (10), 3686-3689.
CrossRef - Nakhutsrishvili, I. Technical Sci. & Technologies, 2016, 5 (1), 19-22.
- Wang, G., Liu, Y., Zhang, J., Chou, K.-C., Hou, X. Ceramic Soc. Jap., 2014, 1(10), 889-894.
- Chen, Y., Tan, T., Chen, H. Nuclear Sci. and Technology, 2008, 45(7), 662-667.
CrossRef - Zhu, S.L., Feng, Z., Liu, J. Advanced Materials Res., 2014, 860/863, 899-902.
CrossRef - Smialek, J.L. Europ. Ceramic Soc. 2017, 37(1), 23-34.
CrossRef - Stringer, J. Oxidat. Metals, 1972, 5, (1), 49-58.
CrossRef - Liu, T.-K., Bautista, R.G. Oxidat. Metals, 1981, 16 (3/4), 243-252.
CrossRef - Carrette, F., Guinard, L., Pieraggi, B. Int. Conf. Water Chemistry in Nuclear Reactor Systems, 2002, 22-26 April, Avignon, France, 1-32.
- Aronishidze, M. Vardosanidze, Z., Nakhutsrishvili I., Chanishvili, A. Proc. Georgian Acad. Sci., Chemical Ser., 2015, 41 (4), 361-365.
- Nakhutsrishvili, I. Proc. Georgian Acad. Sci., Chemical Ser., 2008, 34 (1), 53-58.
- Nakhutsrishvili, I., Mikadze, O., Mikadze, G. Proc.Georgian Acad. Sci., Chemical Ser., 2007, 33 (1), 60-63.
- Ihara, Y., Ohgame, H., Sakiyama, K., Hashimoto, K., Corrosion Sci., 1983, 23(2), 167-181.
CrossRef - 15. Davis, H.H., Graham, H.C., Kverens, I.A. Oxidat. Metals, 1971, 3 (5), 431-451.
CrossRef

This work is licensed under a Creative Commons Attribution 4.0 International License.
About The Author
![]()
A New Edition of Web of Science
Journal Impact Factor
2022: 0.5
Five Year: 0.8
Journal is Indexed in

Cabells Whitelist
![]()


