Transparent Membrane of Polyelectrolyte Complex Doped with 2,6-Dichlorophenol-Indophenol as an Optical Sensor for Colorimetric Measurements of Ascorbic Acid
Dhony Hermanto1,2,* , Nurul Ismillayli1, Ruru Honiar2, I. G. Ayu Sri Andayani2, Baiq Mariana2 and Rochmad Kris Sanjaya3
1Department of Chemistry, Faculty of Mathematics and Natural Sciences, University of Mataram, Mataram–West Nusa Tenggara 83125, Indonesia
2Analytical Chemistry Laboratory, Faculty of Mathematics and Natural Sciences, University of Mataram, Mataram–West Nusa Tenggara 83125, Indonesia
3Department of Pharmacy, Faculty of Healthy Science, University of Kadiri, Kediri–East Java 64115, Indonesia
Corresponding Author E-mail : dhony.hermanto@unram.ac.id
DOI : http://dx.doi.org/10.13005/ojc/360412
Article Received on : 15 July 2020
Article Accepted on : 16 Aug 2020
Article Published : 29 Aug 2020
An optical chemical sensor based on a transparent membrane of polyelectrolyte complex (PEC), composed of alginate–chitosan membrane and 2,6-dichlorophenol-indophenol (2,6-DCPIP), coated on transparent mica was coupled with UV-Vis spectrophotometry and used for colorimetric measurements of ascorbic acid (AA). The transparent membranes of PEC were characterized using scanning electron microscopy (SEM) technique. The experimental parameters of the biosensor were optimized. Here, the optical chemical sensor showed maximum response at wavelength of 545 nm, with the optimum pH at 3. The calibration curve had a dynamic working range at 0.0 to 5.0 mM of AA with a limit of detection (LOD) of 0.13 mM AA. The membrane sensor has a long life time in the defined condition (4 oC). The developed optical chemical sensor correlated well with the standard method, HPLC for the determination of AA concentration in real samples.
KEYWORDS:Alginate-Chitosan PEC Membrane; Ascorbic Acid; Colorimetric Sensor; DCPIP
Download this article as:| Copy the following to cite this article: Hermanto D, Ismillayli N, Honiar R, Andayani I. G. A. S, Mariana Baiq, Sanjaya R. K. Transparent Membrane of Polyelectrolyte Complex Doped with 2,6-Dichlorophenol-Indophenol as an Optical Sensor for Colorimetric Measurements of Ascorbic Acid. Orient J Chem 2020;36(4). |
| Copy the following to cite this URL: Hermanto D, Ismillayli N, Honiar R, Andayani I. G. A. S, Mariana Baiq, Sanjaya R. K. Transparent Membrane of Polyelectrolyte Complex Doped with 2,6-Dichlorophenol-Indophenol as an Optical Sensor for Colorimetric Measurements of Ascorbic Acid. Orient J Chem 2020;36(4). Available from: https://bit.ly/32w8oh0 |
Introduction
In recent years, the development of optical sensors as analyte detection device in environmental, chemistry and biotechnology science, as well as in the pharmaceutical and health industry, have received great attention from researchers.1 Colorimetric sensors as a type of optical chemical sensor is very interesting due to its ability in detecting analytes through a change in color.2 This feature makes it possible to obtain visual and analytical signal readings which is easily scalable. This chemical sensor usually contains chromogenic materials that are immobilized in the supporting matrix.3 Many parameters such us mechanical properties, stability, suitability and permeability of chromogenic material influence the selection of appropriate supporting matrix. Polymers with many desirable features are widely used as supporting materials for various optical chemical sensors.4 Currently, polymers such us polyvinyl chloride (PVC), polystyrene (PS), polytetrafluoroethylenes (PTFE), polydimethylsiloxanes (PDMS), polymethacrylate (PMA) and their derivative cellulose such as ethyl cellulose have been used widely.5
In the last decade, PEC has drawn attention from various scientific disciplines to be applied as a supporting matrix. PEC is an association complex formed between polymers that have polyions with opposite charges trough electrostatic interaction.6 Alginate which is polyanionic and polycationic chitosan when dissolved in the right conditions can interact each other through carboxyl groups from alginate and amino groups from chitosan.7 The formed PEC is expected to provide better applications due to its unique structure and properties.8 Recently, it has been developed a sensor using PEC alginate-chitosan matrix as immobilized membrane of bioactive material.9 The membrane is suitable for immobilizing active material to produce a selective sensing interface for detection of target analytes.10 In this case, a fast and very sensitive response is expected because of the large specific surface area, and rapid penetration of the sample solution into the pores of the membrane. These features facilitate the rapid interaction of target analytes with a large number of active sites that can be accessed on the membrane network. The use of natural alginate-chitosan membrane in optical chemical sensors with spectroscopy requires a transparent membrane.
In this research optical chemical sensor fabrication based on alginate-chitosan doped with 2,6-DCPIP transparent membranes was carried out, then sensors were applied for colorimetric detection of AA using a spectrophotometer. The role of vitamin C in metabolic function is very important, especially in development and maintenance of connective tissue, activation vitamin B and folic acid and conversion of cholesterol to bile acid and tryptophan to serotonin.11 As antioxidant, vitamin C protects the body from radical damage as well as immune system by reducing the effect of allergies and fighting infection.12,13
The developed optical sensor was built by forming a transparent PEC membrane from alginate-chitosan and 2,6-DCPIP membrane coated on transparent mica. For the detection of AA colorimetry, the sample solution was contacted with an optical sensor. The colorimetric reaction is based on the 2,6-DCPIP interaction as an indicator with AA.14 This is the first time that optical sensor colorimetry based on transparent PEC membranes has been made and coupled with UV-Vis spectrophotometry for colorimetric detection of AA.
Experimental
Materials and Instruments
Chemicals consisting of 2,6-dichlorophenol-indophenol, sodium alginate of brown algae (300 to 400 cp), and chitosan of crab shells (95% deacetylation) were purchased from Sigma (St. Lois, USA). Hydrochloric acid (37%), glacial acetic acid (98%), metaphosphoric acid, sodium hydroxide, sodium bicarbonate and ascorbic acid were received from Merck (UK). A standard solution of ascorbic acid (only prepared at the time of use) was prepared by dissolving 50 mg of ascorbic acid with solution of metaphosphate-acetic acid into a 50 mL volumetric flask. The methosphoric acid solution was prepared by mixing 100 mL of deionized distilled water (dd) with 20 mL of acetic acid, and 7.5 g of metaphosphoric acid. The mixture was diluted up to 250 mL with dd water under stirring condition. The indophenol coloring solution was prepared by mixing 50 mL of water, 42 mg of sodium bicarbonate, and 50 mg of 2,6-dichloroindophenol sodium salt. The mixture was diluted to 200 mL with dd water and stirred until homogeneous. Each metaphosphoric acid-acetic acid solution and indophenol dye solution were filtered and then stored at a closed container in the refrigerator until use.
Preparation of Transparent PEC Membrane
The membrane was prepared from hydrosols of chitosan and alginate, as described by Hermanto et al.6,9 The scanning electron microscope (SEM) study was carried out on a transparent PEC membrane after being coated with gold palladium on SEM (Joel LV 5600 USA model) to evaluate the morphology and structure of membrane surface, as shown in Fig. 1. Here, the morphology of the alginate-chitosan membrane mixed was less homogeneous, it can be observed that the transparent membrane surface of the alginate-chitosan shows a fibrous structure with a rough morphology and irregular shape, which is a network of electrostatic interactions of alginate and chitosan. The likeness of its surface morphology has been described at previously work.6,9
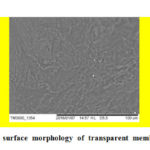 |
Figure 1: SEM images of surface morphology of transparent membrane of alginate-chitosan. |
Immobilization Procedure
Alginate-chitosan hydrosol mixture was used as a supporting matrix for 2,6-DCPIP (as an indicator of the colorimetric optical system). Before the hydrosol mixture (50 mL alginate- chitosan) was used, the mixture was added with 2 mL of 32% (v/v) HCl and 10% NaOH (w/v) to reach approximately pH of 5.28. Stirring was carried out for ± 4 hours at room temperature until the mixture was homogeneous. After that, 3 μL hydrosol mixture was taken and added to 1 L phosphate buffer (pH 6). Then, 3 μL indophenol dye solution was added to the buffered mixture. Immediately, the transparent mica coated with alginate-chitosan hydrosol mixture were used for indophenol immobilization. The mixture was stored for 5 days in the refrigerator until the membrane was formed. The final membrane was removed from the mold and stored in a closed container and was kept in the refrigerator for the aging process until use.
Measurement Procedure
Alginate-chitosan/indophenol membrane was added to AA in a buffer phophate solution (pH 6.0) at a specified time (5 s). The membrane was rinsed with water and then dried. Film absorbance was measured using spectrophotometer at maximum wavelength. This procedure allows measurement of absorbance in a colored or turbid sample, such as an orange/apple juice sample. To evaluate the feasibility of the optical chemical sensor for colorimetric measurements of AA detection in the real sample, the sample orange/apple juice was first filtered with a 0.22 µm syringe filter and then spiked with standard AA solutions to prepare stock solutions with various AA concentrations. The optical intensity was recorded on UV-VIS spectrophotometer under the same conditions. As a comparison, the HPLC was used as the reference method for the determination of AA in the real sample, recommended by AOAC official method 2012.22.15 The HPLC used is a product from Waters Breeze HPLC-USA (which is equipped with various devices, namely Waters Delta-600 pump, Waters 600-controller, Waters-2487 Dual l Absorbance Detector and column SGE type 250CL4-ODS2-8/5 µm, length 250 mm, ϴ 4 mm dan frit 4/5 µm). Real samples were analyzed by HPLC using a standard internal method with a UV detector at a maximum wavelength of 245 nm. A calibration curves for AA in the concentration range of 0 and 10% (v/v) was obtained using 96% ethanol as a solvent. The sample was previously diluted to obtain an adequate AA concentration.
Results and Discussion
Sensor Scheme
AA concentration in this study was determined by optical chemical sensors for colorimetric measurements based on a transparent membrane of PEC, composed of alginate-chitosan membrane and 2,6-DCPIP, coated on transparent mica was coupled with UV-Vis spectrophotometry. The principle for determining AA concentration is the presence of AA oxidation by 2,6-DCPIP which is a color indicator to dehydroascorbic acid.16 AA will donate one electron to form semidehydroascorbic acid which then undergoes disproportionation to form dehydroascorbic acid which is unstable. Dehydroascorbic acid would be degraded to form oxalic acid and treonic acid. At the same time, the 2,6-DCPIP indicator becomes a colorless material (leucodye). The 2,6-DCPIP solution is blue in neutral or basic conditions and rose pink in acidic conditions.14 Redox reactions between indicators (DCPIP) and analytes (AA) can be represented as follows:
DCPIPox + AAred → DCPIPred + AAox (1)
rosepink colorless colorless colorless
where ‘ox’ and ‘red’ refer to oxidized and reduced forms of each species. Here, there are two half reactions: DCPIPox accepted electrons to be DCPIPred and AAred became AAox by releasing electrons, where electron transfer occured between the two species. Once the AA analyte reacted with the DCPIP indicator, the AA was oxidized and the DCPIP indicator was reduced, i.e. there was a loss of electrons in the former process and a gain of electrons in the latter process. The DCPIP indicator changes from a color oxidized form to a colorless reduced form. Therefore, the absorbance intensity of the DCPIP indicator decreased with decreasing of indicator due to the interaction between AA and DCPIP. Hence, this can be used as a basic principle for the measurement of AA in solution. This principle has also been observed in AA titrimetry analysis using 2,6-DCPIP.17,18
Optimization of the Colorimetric Measurements
Optimization of experimental parameters is an important step in the analytical characteristics of optical chemical sensors performance for the colorimetric measurement of AA. To determine the optimal operating parameters, a series of initial investigations were carried out and Table 1 showed the range of each parameter and its optimal value. Parameters can be grouped into physical and chemical dimensions.
Table 1: Experimental parameters of optical sensor performance for AA measurement
|
Dimensions |
Parameter |
Range |
Optimum Value |
|
Wave length λmax (nm) |
400-800 |
545 |
|
|
Physical |
Respon time (s) |
0-60 |
5 |
|
|
Temperature (°C) |
20-35 |
25 |
|
Chemical |
pH |
2-6 |
3 |
|
|
Volume of indicator solution (mL) |
0.1-0.5 |
0.2 |
One important aspect in physical/chemical parameters to determine the optimal conditions of optical chemical sensors for colorimetric AA measurements is scanning wavelength, response time and temperature. The optimum wavelength as the best operational wavelength of an optical chemical sensor, was determined by measuring the difference in signal intensity before and after reacting with the analyte (AA). This change in signal intensity occured due to color change of dye when a redox reaction occurs with the interaction between the analyte and the dye. The intensity of the absorbance signal decreased because the indicator color changes from pink-rose to colorless. Monochromator was used to monitor changes in signal intensity at wavelength of 545 nm, where the absorbance difference of reduced and oxidized forms was the greatest. In addition, the sensor response time was the needed time for an optical chemical sensor reaching a stable signal intensity. The sensor response time was measured in range from 0 to 20 s. It was found that 5 seconds is the response time of the optical chemical sensor, because after 5 s, the sensor signal did not increase significantly with increasing time. The working temperature of the redox reaction affects changes in blank and redox signals. It was obtained that the room temperature, 25 °C was the optimum temperature for this redox reaction. At lower temperatures redox activity decreased due to the limited movement of the analyte into the pore membrane (less elastic membrane) although AA analytes can be protected from the effects of oxidation by the environment at low temperatures. At higher temperatures, redox activity decreased because AA molecules are easily oxidized at relatively high temperatures. The temperature of 25 °C was then chosen as the working temperature on the optical chemical sensor for the measurement of colorimetric AA.
In chemical dimensions, the parameters directly involved in the redox process, namely pH and the amount of dye solution. The redox reaction indicator 2,6-DCPIP followed the change from oxidized to reduced form and involved the transfer of electrons and H+ ions in their reactions so that the reaction depends on pH. The effect of pH ws examined by comparing the sensor characteristic response at pH 3.0–6.0. The linear range of sensors observed shifted to lower concentrations when the pH increased. At pH 6.0 the sensor response was observed to be lower than the value at pH 3.0. This is due to a decrease in the formal potential of the indicator as a result of an increase in pH. The formal potential of 2,6-DCPIP has previously been observed to decrease with increasing pH. A decrease in formal potential indicates that the indicator was more easily reduced, thus lower analytic concentrations could cause the indicator changed color. This also implies that the pH of the analyte solution during measurements must be kept as constant as possible. In this study, phosphate buffer solution at pH 3 was found to be optimum for use in the redox reaction. The buffer solution was used to minimize the influence of the matrix and other electrocatalytic interference so that the stability of the sensor response to changes in pH can be controlled. In addition, concentration of immobilized indicator in the matrix was determined at optimum conditions for obtaining a high and constant signal intensity. Measurement of dye solution volume with variations 0.1, 0.2, 0.3, 0.4 and 0.5 mL was conducted and the optimum volume was 0.2 mL.
Response Optical Sensor for Colorimetric Measurements of AA
The response of optical sensors for colorimetric measurements of AA has been investigated under optimal conditions. The optical sensor response curve for colorimetric measurements of AA showed change in optical intensity due to change in AA concentration. Fig. 2 is an optical sensor calibration curve for colorimetric measurements of AA at wavelength of 545 nm.
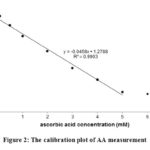 |
Figure 2: The calibration plot of AA measurement |
Fig. 2 show a calibration curve plot between optical signal intensity and AA concentration. The curve linearity is good with the correlation coefficient, R2 = + 0.9903 (r »1) in the range of AA ion concentrations between 0.0 to 5.0 mM. The negative value of the gradient showed a redox decrease in proportion to its concentration. To calculate limit of detection for colorimetric measurements of AA, the membrane was immersed in a phosphate buffer solution (pH = 3) without AA (blank solution) for 5 s and then the absorbance was measured at 545 nm. Limit of detection of biosensor is 0.13 mM.
Reproducibility and repeatability of optical chemical sensors were two important characteristics studied in this work. Reproducibility and repeatability are the ability of the biosensor to provide the same output when given a fixed input after the system is reset. Repeatability of experiments is expected to produce the difference in results between experiments as small as possible or produce precise data. Reproducibility of the optical sensor for colorimetric measurements of AA at a wavelength of 545 nm was determined by making three measurements using three different membranes. The results showed that at least 99% reproducibility and membranes made on different days showed no statistically significant differences (α = 0.05). Meanwhile, optical chemical sensor repeatability was determined as the relative standard deviation (RSD) in determining the standard AA solution (n = 3, AA1 = first membrane to AA3 = third membrane) using the same membrane in the concentration range of 0.0 to 7.0 mM. Its value was 0.0 up to 0.98 %. This RSD are higher when compared with other reported for determination AA-based optical sensor19,20. This show that optical chemical sensors have excellent reproducibility and repeatability, as shown in Fig. 3.
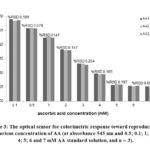 |
Figure 3: The optical sensor for colorimetric response toward reproducibility at various concentration of AA |
Analytical Characteristics of This Method for the Determination of AA
Optical chemistry sensor based on transparent doped membrane with 2,6-DCPIP has the advantage that can be reused through reactivation by flushing using 1 mM of K3Fe(CN)6 solution. The lifetime or reuse of optical chemical sensor was determined from the decreased redox activity due to the leaching effect of the dye from the membrane cavity at a certain time. Besides being caused by redox reaction with AA, activity of immobilized indicator was also reduced during storage due to interacting with air and high temperatures. To minimize this factor, immobilized dyes were stored in the refrigerator when not in used. Figure 3 shows the use of optical chemical sensors for the measurement of colorimetric AA-based transparent membrane alginate-chitosan doped with 2,6-DCPIP for 10 times the use after reactivation. Absorbance readings on the first day were considered as 100% relative response. As shown in Fig. 4, the optical chemical sensor response was stable for period of 18 days with maintaining more than 75% of the initial response. However, the response of the optical chemical sensor decreased dramatically to 45% of the initial response during the 20 days of its storage. It indicated that the optical chemical sensor was stable for 10 times usage.
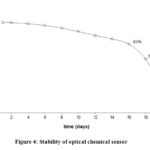 |
Figure 4: Stability of optical chemical sensor |
The selectivity of optical chemical sensors was determined by adding interference that was potentially disturbing and commonly found in real samples such as glucose, caffeine, boric acid, lactic acid and citric acid. Table 2 shows the activity of optical chemical sensors for the measurement of colorimetric AA at several interferences. The analysis was carried out with the ratio of AA concentration to the interferent of 1:10 (1 mM AA, 10 mM interference). Redox values were relatively very small (<5%), indicating that the interferent does not have a significant effect. However, citric acid and boric acid had relatively greater values compared to other interferences because citric acid and boric acid at high concentrations could affect redox activity at 2,6-DCPIP.
Table 2: Determination results of possible interferences tested with the optical sensor.
|
Interference |
Relative Redox Activity (%) |
Recovery (%) |
|
Glucosa |
+ 0.55±0.05 |
105.6 |
|
Cafein |
+ 0.46±0.06 |
103.1 |
|
Boric Acid |
+ 1.78±0.13 |
99.2 |
|
Lactic Acid |
+ 1.55±0.11 |
99.0 |
|
Citric Acid |
+ 1,86±0.14 |
99.4 |
Notes: Percentage of interfering or percentage of relative redox activity (%): ((a − b)/b) × 100%; a: absorbance for the mixture of interfering compound and AA; b: absorbance for AA (without interfering compound).
Detection of AA in a Real Sample
The performance of optical chemical sensors were evaluated in the analysis of real samples. The standard addition method was used by spiking different amounts of AA into the sample. The results of determination are summarized in Table 3. The results indicated that the optical chemical sensor developed has very good characteristics for colorimetric determination of AA in real sample. The results shown in Table 3 were in accordance with the reference method using HPLC.
Table 3: Determination of AA in real samples using purposed optical sensors and HPLC.
|
Sample |
AA concentration (mg in 100 g sample) |
Relative Error (%) |
|
|
Found by Sensor |
Found by HPLC |
||
|
Orange Juice |
52.66±0.87 |
52.91± 0.17 |
2.9 |
|
Apple Juice |
4.13±0.97 |
3.82±0.59 |
2.5 |
Notes: average triplicate of measurements.
Conclusion
The 2,6-DCPIP dye was immobilized into the transparent alginate-chitosan membrane and then coated on transparent mica as an optical chemical sensor for colorimetric measurements of ascorbic acid (AA). After optimization of experimental parameters, optical chemical sensors have a linear response in the AA concentration range of 0.0 to 5.0 mM and a detection limit of 0.13 mM. Reproducibility and repeatability was excellent (RSD 0.2%) as well as its stability up to 10 times usage. Hence, optical chemical sensors based on 2,6-DCPIP / alginate-chitosan transparent membranes became an alternative method for determining AA levels in samples.
Conflicts of Interest
The authors declare no conflict of interest.
References
- Dey, D.; Goswami, T. J. Biomed. Biotechnol. 2011, 2011, 1–7.
- Li, Z.; Askim, J. R.; Suslick, K. S. Chem. Rev. 2018, 19(1), 1–62.
- Wang, X.; Wolfbeis, O. S. Chem. Soc. Rev. 2014, 43, 3666–3761.
- Gruber, P.; Marques, M. P. C.; Szita, N.; Mayr, T. L. a Chip 2017, 17, 2693–2712.
- Cichosz, S.; Masek, A.; Zaborski, M. Polym. Test. 2018, 67, 342–348.
- Hermanto, D.; Mudasir, M.; Siswanta, D.; Kuswandi, B.; Ismillayli, N. Molekul 2020, 15(1), 40–47.
- Ismillayli, N.; Hadi, S.; Dharmayani, N. K. T.; Sanjaya, R. K.; Hermanto, D. IOP Conference Series: Mat. Sci. Eng. 2020, 833, 1–6.
- Yabuki, S. Anal. Sci. 2011, 27, 695–702.
- Hermanto, D.; Mudasir, M.; Siswanta, D.; Kuswandi, B.; Ismillayli, N. J. Math. Fundam. Sci. 2019, 51(3), 309–319.
- Hermanto, D.; Kuswandi, B.; Siswanta, D.; Mudasir, M. Indones. J. Chem. 2019, 19(3), 786–795.
- Chambial, S.; Dwivedi, S.; Shukla, K. K.; John, P. J.; Sharma, P. Indian J. Clin. Biochem. 2013, 28(4), 314–328.
- Padayatty, S. J.; Katz, A.; Wang, Y.; Eck, P.; Kwon, O.; Lee, H.; Chen, S.; Corpe, C.; Dutta, A.; Dutta, S. K. J. Am. Coll. Nutr. 2003, 22(1), 18–35.
- Carr, A. C.; Maggini, S. Nutrients 2017, 9(121), 1–25.
- Elbehery, N. H. A.; Amr, A. E. E.; Kamel, A. H.; Elsayed, E. A.; Hassan, S. S. M. Sensors 2019, 19(2058), 1–13.
- AOAC. AOAC Official Method 2012.22. 2012, 1, 1–2.
- Sripakdee, T.; Mahachai, R.; Chanthai, S. Orient. J. Chem. 2017, 33(1), 74–86.
- AOAC. AOAC Official Method 967.21. 2006, 1, 6–7.
- Ugbe, F. A.; Ikudayisi, V. A.; Amusan, O. T. Int. Ann. Sci. 2017, 3(1), 19–22.
- Bsalan, G. A.; Rabi, M. A.; Ashkhourian, J. T. Anal. Sci. 2012, 28, 1225–1230.
- Russell, M.; Foreman, S. Cogent Chem. 2015, 1, 4–11.

This work is licensed under a Creative Commons Attribution 4.0 International License.
![]()
A New Edition of Web of Science
Journal Impact Factor
2022: 0.5
Five Year: 0.8
Journal is Indexed in

Cabells Whitelist
![]()


